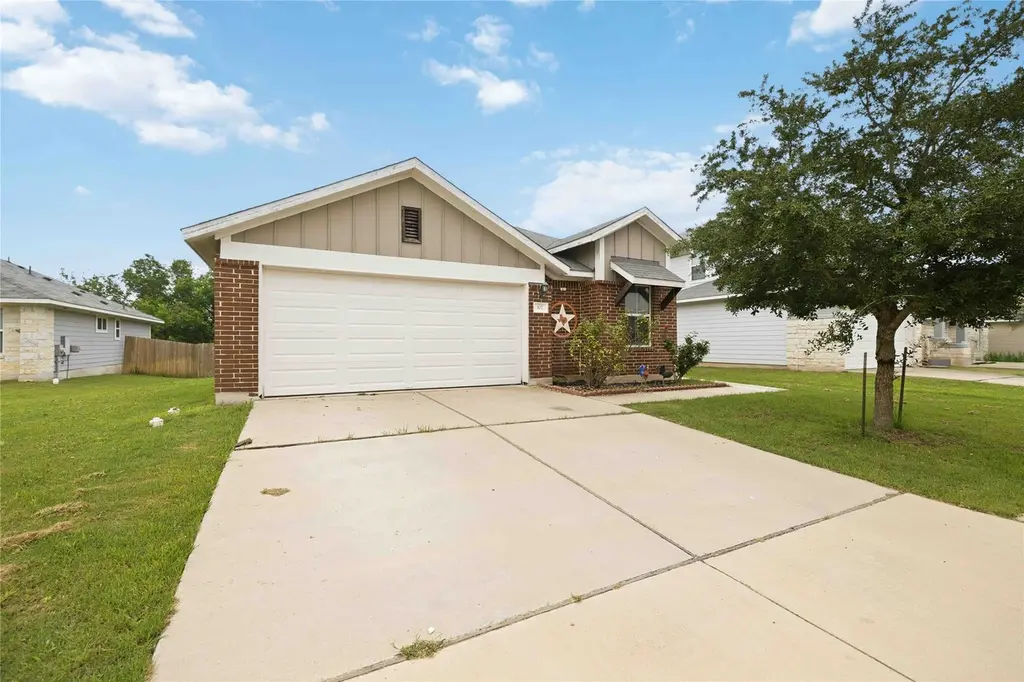
107 Saranac Dr · Elgin, TX
Flood risk 1/10 · Minimal
- FEMA flood zone
- X (unshaded)
- Chance of flooding over 30 yrs
- 0.0%
- Est. flood insurance / yr
- $507 – $1,088
Fire risk 4/10 · Minor
- Est. fire insurance / yr
- $1,222 – $2,270
Heat risk 8/10 · Major
- Hot days now (above 109°F)
- 6 days/yr
- Hot days in 30 yrs
- 19 days/yr
Wind risk 8/10 · Major
- Chance of severe wind over 30 yrs
- 80.0%
Air-quality risk 1/10 · Minimal
- Unhealthy air days now
- 0 days/yr
- Unhealthy air days in 30 yrs
- 0 days/yr
Risk factors via First Street. Map © Google.
Why this score? — see what drove the D grade
The composite is a weighted blend of 9 inputs, each scored 0–100. Each bar is that input's sub-score; the figure is the points it added to the 100-point composite (weight × sub-score).
- ARV discount +11.4/15.0
- Appreciation +10.0/10.0
- Cash flow +5.2/30.0
- Livability +3.7/5.0
- Rent growth +3.3/5.0
- Condition / age +2.5/5.0
- 1% rule +2.0/10.0
- Schools +2.0/10.0
- DSCR +0.0/10.0
$284,999
🖨 Deal sheet (PDF) 📄 Offer letter ✓ Due diligence
Listing remarks MLS
MLS# 2440185 - Built by Brohn Homes - CONST. COMPLETED Oct 22! ~ Listed during construction. Disregard days on market. Most popular one story plan. Covered back patio, 10' ceilings, open floor plan, full sprinkler system, double vanity in master. Tile in all main areas, carpet in bedrooms. Restrictions: Yes Sprinkler Sys:Yes
Key facts
- Walk-in closet
- Granite countertops
- Open-concept layout
Tags
Property features AI
Finance
- HOA & community: Homeowners association with quarterly fee of $50 covering common area maintenance; Community mailbox
Exterior
- Parking: Attached garage; Driveway parking; Two covered garage spaces; Four total parking spaces
- Utilities: Public water; Public sewer; Electricity available; Underground utilities
- Home design: Single-story home; Faces north; Resale property; Slab foundation
- Construction: HardiPlank and masonry exterior; Composition shingle roof
- Exterior features: Rear covered porch and patio; Wood fencing (fenced yard); Landscaped yard with medium-size trees; Front yard; Interior lot
Interior
- Kitchen: Dishwasher; Free-standing range; Oven; Microwave; Disposal; Exhaust fan; Granite counters; Pantry
- Bedrooms: Three main-level bedrooms
- Flooring: Carpet; Tile
- Bathrooms: Two full bathrooms
- Heating & cooling: Central heating; Central air; Ceiling fan(s)
- Interior features: Granite counters; High ceilings; Pantry; Walk-in closet(s); Main level primary
- Laundry & utility: Main level laundry room; Electric water heater
Neighborhood map
What this means for you Summary
Snapshot
- This is a 3-bed/2.0-bath single-family listed at $285k.
Deal economics
- At list price, monthly cash flow is $-647 ($-8k/yr) — negative.
- To cash-flow at today's rent, offer at most $171k (40.1% below list).
- To meet the 1% rule (rent ≥ 1% of price), the offer needs to be $199k (30.3% below list).
- Recommended offer: $171k (40.1% below list) — sets the bar for cash-flow.
Location & tenants
- Location reads 74/100 on livability (#167 in TX, #4,404 nationally) — a middle-class / working-renter tenant base. Strengths: cost of living A+, housing A+, health & safety A+; Watch: amenities F, commute F.
- Elgin ISD (rural): math 17% / reading 26% proficiency, ranked #741 of 826 in TX (top 90%) — low school quality limits family demand, transient renter base, plan for 1-2y turnover; 67% free/reduced lunch — lower-income household profile, screen leases tightly.
- Zoned schools: Elgin El (math 8% / reading 17%, grade F, #4,180 of 4,322 statewide, top 97%, 847 students, 84% FRL); Elgin Middle (math 22% / reading 24%, grade F, #1,327 of 1,662 statewide, top 81%, 780 students, 82% FRL); Elgin H S (math 12% / reading 37%, grade F, #1,264 of 1,632 statewide, top 82%, 1,672 students, 74% FRL).
- Market conditions: Rents rising (+3.1%/yr); 814 active listings in the ZIP; 12 comparable units currently listed for rent nearby; rentals at typical pace (median 20d on market — plan ~3-4 weeks tenant-placement turnaround); solid renter incomes; 1,841 units permitted in Bastrop County in 2024 (150 in 5+ unit buildings).
Forward outlook
- In year one you build about $30k of equity ($2k loan paydown + $28k appreciation (10.0% local appreciation)).
- Bastrop County population projected at +37% by 2050 — long-run rental-demand tailwind backs the buy-and-hold thesis.
- By year 2, paydown + projected appreciation supports a ~$49k cash-out refi (75% LTV) — recoverable capital for the next deal without selling this one.
Negotiation context
- It's been on market 51 days — a 3% lower offer ($276k) is reasonable based on typical stale-listing flexibility.
- 2 sale attempts since 8y ago with the ask held roughly flat each time — persistent listings suggest the price (not the market) is what's stuck; bring a comps-based counter.
Risks & watch-outs
- Climate carrying-cost: severe wind risk, 80% chance of damaging wind over 30y; extreme-heat days projected 6→19/yr by 2055 (HVAC capex compounding) — expect insurance premiums to compound above CPI over the hold.
Questions for the listing agent
- What do current leases actually rent for vs. the listed asking? Can we see a recent rent roll and the last 12 months of T-12 income?
- It's been on market 51 days. Have you received any prior offers? Is the seller open to a 40% concession, seller financing, or rate buy-down credit?
- What does the HOA fee cover, when was the last increase, and are there any pending special assessments or reserve-fund shortfalls?
- Is there a deadline driving the sale (1031 exchange, divorce, estate, relocation)? That informs how much negotiation room exists.
- Schools are F-rated, which usually means shorter tenancies and higher turnover. Who's the typical renter profile here, and what's been the actual vacancy rate?
- The area grade is low — what's the realistic commute time and amenity access for the typical tenant pool here? Any planned neighborhood developments (good or bad) we should know about?
- What's the average days-on-market for RENTAL listings here right now (not sales)? A rising rental-DOM trend means longer vacancies and softer asking-rent achievability than the comps imply.
- What's the recent tenant-quality profile in this submarket — average credit score on applications, eviction rate, late-payment / NSF rate, and stable-employment percentage? A property-management company in the area should have these aggregated.
- How much new for-sale + rental construction is in the pipeline within 1–3 miles? Heavy new supply typically softens prices + rents 12–24 months out; constrained supply supports both.
Investment metrics
- 1% rule
- 0.70% ✗
- Cap rate
- 3.57%
- Cash-on-cash
- -9.74%
- DSCR
- 0.57
- GRM
- 12.0
CMA / ARV
- ARV (median comp)
- $312,298
- List price
- $284,999
- Delta
- -8.74%
- Verdict
- FAIR
- Comps
- 20 within 1.0 mi
Show comp detail 12 sales within ~0.75 mi
| Address | Dist | Beds/Ba | Sqft | Sold | Price | $/sf | Match |
|---|---|---|---|---|---|---|---|
| 140 Tolo Dr | 0.61mi | 3/2.0 | 1,487 (-3%) | 0mo | $253,990 | $171 | 66 |
| 153 Tolo Dr | 0.59mi | 3/2.0 | 1,482 (-3%) | 2mo | $299,990 | $202 | 66 |
| 150 Tolo Dr | 0.61mi | 3/2.0 | 1,487 (-3%) | 1mo | $284,990 | $192 | 66 |
| 445 Lucky Ave | 0.64mi | 3/2.0 | 1,487 (-3%) | 2mo | $276,990 | $186 | 64 |
| 131 Tolo Dr | 0.61mi | 3/2.0 | 1,482 (-3%) | 3mo | $284,990 | $192 | 64 |
| 435 Lucky Ave | 0.65mi | 4/2.0 (+1) | 1,522 (-0%) | 1mo | $299,490 | $197 | 63 |
| 130 Tolo Dr | 0.62mi | 4/2.0 (+1) | 1,523 (-0%) | 5mo | $306,900 | $202 | 62 |
| 612 Cardinal St | 0.71mi | 4/2.0 (+1) | 1,452 (-5%) | 1mo | $305,000 | $210 | 53 |
| 118 Anderson Dr | 0.74mi | 2/2.0 (-1) | 1,557 (+2%) | 6mo | $339,000 | $218 | 53 |
| 137 Tolo Dr | 0.60mi | 4/3.0 (+1) | 1,639 (+7%) | 4mo | $299,900 | $183 | 48 |
| 437 Lucky Ave | 0.65mi | 4/3.0 (+1) | 1,648 (+8%) | 2mo | $300,490 | $182 | 46 |
| 124 Tolo Dr | 0.62mi | 4/3.0 (+1) | 1,674 (+10%) | 3mo | $325,900 | $195 | 44 |
Match score weights: distance 35% · size 25% · config 20% · recency 20%. Top-matched comps best support the ARV.
Projected returns pro-forma
10.0% appreciation · 3.12% rent growth · sell at horizon
- IRR
- 17.5%
- Equity multiple
- 2.43×
- Total profit
- $114,408
- Equity at exit
- $256,750
- IRR
- 16.5%
- Equity multiple
- 5.64×
- Total profit
- $370,191
- Equity at exit
- $553,690
Cash invested: $79,800 (down + closing). Projections, not guarantees.
Landlord ↔ Tenant lean methodology
- Overall (STATE)
- 87 Strongly Landlord-Friendly
- State Texas
- 87 Strongly Landlord-Friendly · R+5
- County
- — inherits STATE
- City
- — inherits STATE
ZIP-level market 78621
- Home prices YoY
- 7.6%
- Rents YoY
- 3.1%
- Active inventory
- 814
- Price-to-rent
- 12.0×
Monthly cashflow live
- Estimated rent
- $1,987 high interval (Pro) →
- Mortgage (P&I)
- −$1,495
- Tax from tax record
- −$587 /mo · $7,045/yr
- Insurance
- −$119
- HOA
- −$17
- Vacancy / Maint / Mgmt
- −$417
- Net cashflow
- $-647
Break-even live
Sensitivity live
| Price | -10% $-486 | -5% $-567 | +0% $-647 | +5% $-728 | +10% $-809 |
|---|---|---|---|---|---|
| Rent | -10% $-804 | -5% $-726 | +0% $-647 | +5% $-569 | +10% $-490 |
| Rate | -1.0pp $-504 | -0.5pp $-575 | base $-647 | +0.5pp $-721 | +1.0pp $-796 |
UW: 25.0% down · 7.5% · 30yr · 1.5% tax · 5.0% vac · 8.0% maint · 8.0% mgmt
Financing live
Cash to close
- Down payment
- $71,250
- Closing costs
- $8,550
- Reserves months
- —
- Total cash needed
- —
Loan-product check · same deal, 3 products live
Conventional
25% down · 7.5% · 30yr
- Down + closing
- —
- Monthly P&I
- —
- Monthly cashflow
- —
- DSCR
- —
- Eligible?
- —
Personal DTI + credit; lowest rate.
DSCR
20% down · 8.5% · 30yr
- Down + closing
- —
- Monthly P&I
- —
- Monthly cashflow
- —
- DSCR
- —
- Eligible?
- —
No personal income docs; deal must DSCR.
Hard money
10% down · 12.0% · 12mo
- Down + closing
- —
- Monthly P&I
- —
- Monthly cashflow
- —
- DSCR
- —
- Eligible?
- —
Short-term bridge; refi at stabilization.
Rent comps 12 comps
| Address | Beds | Baths | Sqft | Rent | $/sqft | DOM | Units | Dist |
|---|---|---|---|---|---|---|---|---|
| 212 Lake Placid Run Elgin, TX | 3.0 | 2.5 | 1681 | $1,895 | $1.13 | 0d | 1 | 0.08mi |
| 102 Schuylerville Dr Elgin, TX | 3.0 | 2.0 | 1479 | $1,800 | $1.22 | 45d | 1 | 0.25mi |
| 120 Jim Dandy Dr Elgin, TX | 4.0 | 2.0 | 1650 | $1,923 | $1.17 | 6d | 1 | 0.46mi |
| 813 Central Ave Elgin, TX | 4.0 | 2.0 | 2025 | $2,300 | $1.14 | 6d | 1 | 0.62mi |
| 419 Gettysburg Loop Elgin, TX | 3.0 | 2.0 | 1565 | $1,850 | $1.18 | 14d | 1 | 0.98mi |
| 108 Bendecido Loop Elgin, TX | 3.0 | 2.0 | 1300 | $1,950 | $1.50 | 19d | 1 | 1.01mi |
| 722 Lavaca Loop Elgin, TX | 4.0 | 2.5 | 2075 | $1,895 | $0.91 | 19d | 1 | 1.16mi |
| 401 Bandara Woods Blvd Elgin, TX | 3.0 | 2.0 | 1665 | $1,875 | $1.13 | 45d | 1 | 1.22mi |
| 13817 County Line Rd Elgin, TX | 1.0–3.0 | 1.0–2.0 | 937 | $1,890 | $2.02 | 0d | 6 | 1.35mi |
| 110 S Main St #104 Elgin, TX | 3.0 | 2.0 | 1061 | $1,700 | $1.60 | 45d | 1 | 1.37mi |
| 101 Bandara Woods Blvd Elgin, TX | 3.0 | 2.0 | 1499 | $1,769 | $1.18 | 16d | 1 | 1.40mi |
| 19405 Bear Grass Dr Elgin, TX | 3.0 | 2.0 | 1495 | $1,760 | $1.18 | 45d | 1 | 1.47mi |
HOA detail
- Monthly dues
- $17 · $204/yr
Listing history 23 events
-
2026-06-21days on market $284,999 Active 51 DOM
-
2026-06-18days on market $284,999 Active 48 DOM
-
2026-06-17days on market $284,999 Active 47 DOM
-
2026-06-16days on market $284,999 Active 46 DOM
-
2026-06-15days on market $284,999 Active 45 DOM
-
2026-06-13days on market $284,999 Active 43 DOM
-
2026-06-09days on market $284,999 Active 39 DOM
-
2026-06-08days on market $284,999 Active 38 DOM
-
2026-06-07days on market $284,999 Active 37 DOM
-
2026-06-04days on market $284,999 Active 34 DOM
-
2026-06-03days on market $284,999 Active 33 DOM
-
2026-06-02days on market $284,999 Active 32 DOM
-
2026-06-01days on market $284,999 Active 31 DOM
-
2026-05-31days on market $284,999 Active 30 DOM
-
2026-05-01$284,999 Active 1057-char remark
-
2019-01-17soldstatus Sold 327-char remark
Show marketing remark (327 chars)
MLS# 2440185 - Built by Brohn Homes - CONST. COMPLETED Oct 22! ~ Listed during construction. Disregard days on market. Most popular one story plan. Covered back patio, 10' ceilings, open floor plan, full sprinkler system, double vanity in master. Tile in all main areas, carpet in bedrooms. Restrictions: Yes Sprinkler Sys:Yes
-
2018-12-22status Pending 327-char remark
Show marketing remark (327 chars)
MLS# 2440185 - Built by Brohn Homes - CONST. COMPLETED Oct 22! ~ Listed during construction. Disregard days on market. Most popular one story plan. Covered back patio, 10' ceilings, open floor plan, full sprinkler system, double vanity in master. Tile in all main areas, carpet in bedrooms. Restrictions: Yes Sprinkler Sys:Yes
-
2018-10-14price $222,866 327-char remark
Show marketing remark (327 chars)
MLS# 2440185 - Built by Brohn Homes - CONST. COMPLETED Oct 22! ~ Listed during construction. Disregard days on market. Most popular one story plan. Covered back patio, 10' ceilings, open floor plan, full sprinkler system, double vanity in master. Tile in all main areas, carpet in bedrooms. Restrictions: Yes Sprinkler Sys:Yes
-
2018-09-25price $222,166 327-char remark
Show marketing remark (327 chars)
MLS# 2440185 - Built by Brohn Homes - CONST. COMPLETED Oct 22! ~ Listed during construction. Disregard days on market. Most popular one story plan. Covered back patio, 10' ceilings, open floor plan, full sprinkler system, double vanity in master. Tile in all main areas, carpet in bedrooms. Restrictions: Yes Sprinkler Sys:Yes
-
2018-08-04price $220,166 327-char remark
Show marketing remark (327 chars)
MLS# 2440185 - Built by Brohn Homes - CONST. COMPLETED Oct 22! ~ Listed during construction. Disregard days on market. Most popular one story plan. Covered back patio, 10' ceilings, open floor plan, full sprinkler system, double vanity in master. Tile in all main areas, carpet in bedrooms. Restrictions: Yes Sprinkler Sys:Yes
-
2018-06-07price $218,166 327-char remark
Show marketing remark (327 chars)
MLS# 2440185 - Built by Brohn Homes - CONST. COMPLETED Oct 22! ~ Listed during construction. Disregard days on market. Most popular one story plan. Covered back patio, 10' ceilings, open floor plan, full sprinkler system, double vanity in master. Tile in all main areas, carpet in bedrooms. Restrictions: Yes Sprinkler Sys:Yes
-
2018-06-02price $217,581 327-char remark
Show marketing remark (327 chars)
MLS# 2440185 - Built by Brohn Homes - CONST. COMPLETED Oct 22! ~ Listed during construction. Disregard days on market. Most popular one story plan. Covered back patio, 10' ceilings, open floor plan, full sprinkler system, double vanity in master. Tile in all main areas, carpet in bedrooms. Restrictions: Yes Sprinkler Sys:Yes
-
2018-05-14$214,581 Active 327-char remark
Show marketing remark (327 chars)
MLS# 2440185 - Built by Brohn Homes - CONST. COMPLETED Oct 22! ~ Listed during construction. Disregard days on market. Most popular one story plan. Covered back patio, 10' ceilings, open floor plan, full sprinkler system, double vanity in master. Tile in all main areas, carpet in bedrooms. Restrictions: Yes Sprinkler Sys:Yes
ⓘ Source: listings_history table (triggers on properties + properties_extension) + one-shot
backfill from property_details.listing_events for pre-trigger history.
Tax reassessment forecast TX · Resets to sale price
- Current annual tax
- $7,045 · $587/mo
- Projected year-2 tax
- $7,045 · $587/mo
- Expected delta
- $0/yr ($0/mo · 0.0%)
ⓘ Screening estimate from a state-policy table — verify with the county assessor before closing.
Climate risk First Street
- Flood 1/10 Low FEMA zone X (unshaded) · 0% chance over 30 yrs
- Wildfire 4/10 Moderate
- Heat 8/10 Severe 6 d/yr ≥109°F today · 19 d/yr by 30 yrs out
- Wind 8/10 Severe 80% chance of damaging wind over 30 yrs
- Air quality 1/10 Low 0 unhealthy d/yr today · 0 by 30 yrs out
Nearby sold comps map
Loading sold comps map…
Walkable amenities ~0.75 mi
Loading nearby amenities…
Taxation est. · year 1
- Rental income
- $23,848
- − Mortgage interest
- −$15,964
- − Property taxes
- −$7,045
- − Insurance
- −$1,425
- − Repairs & maintenance
- −$1,908
- − Management
- −$1,908
- − HOA
- −$204
- − Depreciation
- −$8,291
- Taxable loss
- −$12,897
- Est. tax savings @ 24.0%
- +$3,095
- After-tax cash flow
- $-4,673/yr
For passive investors: Depreciation is non-cash, so a rental often shows a tax loss while cash-flowing — sheltering income. Rental losses are passive: they offset passive income freely, and up to $25,000/yr can offset ordinary (W-2) income if you actively participate and your MAGI is under $100k (phasing out to $0 by $150k); unused losses carry forward. On sale, claimed depreciation is recaptured at up to 25%, and gains may owe capital-gains tax (a 1031 exchange can defer both). Figures are a year-1 estimate at your 24.0% rate — not tax advice; consult a CPA.
Schools (NCES district)
- District
- Elgin ISD
- NCES district ID
- 4818360
- Math proficiency
- 17% ▼ -9.00%
- Reading proficiency
- 26% ▼ -5.00%
- Median HH income
- $55,176
- Composite
- 19.62/100
- National rank
- #8749
- State rank
- #741 of 826 in TX
Livability — Elgin
- Score
- 74/100
- State rank
- #167
- US rank
- #4404
Category grades
Schools grade is shown separately in the Schools card above.
Census & demographics
- Census place
- Elgin, TX
- County
- Bastrop County · 68,601 people
- City population
- 27,860
- Metro
- Austin-Round Rock-Georgetown, TX
- Population (ZIP)
- 30,411
- Household income
- $98,534
- Rent vs Own
- Severe rent burden
- 235.0
Population outlook (Bastrop County) Hauer SSP2
- Today (2025)
- 94,260 people
- By 2030
- 101,355 · +7.5%
- By 2040
- 115,578 · +22.6%
- By 2050
- 129,464 · +37.3%
- By 2075
- 168,068 · +78.3%
- By 2100
- 194,857 · +106.7%
Race, ethnicity, and origin ACS 2023
- Neighborhood character
- Diverse neighborhood (Simpson 0.64)
- Race & ethnicity
- Hispanic / Latino 46% White 38% Two or more races 19% Black 11% Native American 1%
- Hispanic origin (detail)
- Mexican 38%
- Common ancestry
- Slovak 2% Italian 2% Romanian 1%
- Foreign-born
- 17% · Canada, Vietnam
- Languages at home
- 63% English-only · Spanish 36%
Political lean MEDSL · Bastrop
- 2024 margin
- R (+18.4) · D 40.2% · R 58.6% · Other 1.2%
- 2008→2024 swing
- -10.2pp toward R · 2008: -8.2pp · 2024: -18.4pp
- All cycles
- 2024: R+18.4 2020: R+13.8 2016: R+20.4 2012: R+17.0 2008: R+8.2
Not yet ingested
- Civics
- —
Market trends
- HPI YoY
- ▲ 29.47%
- Current HPI
- 416.87
- Rent YoY
- ▲ 3.12%
- Metro
- Austin-Round Rock-Georgetown, TX
- State GDP YoY
- ▲ 3.95%
- F500 in state
- 110
Industry mix (Fortune 500 HQ in TX)
| Industry | F500 HQs | Revenue |
|---|---|---|
| Energy | 16 | $1,198B |
|
||
| Technology | 5 | $198B |
|
||
| Engineering / Construction | 4 | $72B |
|
||
| Energy Services | 3 | $60B |
|
||
| Utilities | 3 | $41B |
|
||
| Healthcare | 2 | $330B |
|
||
Price history
+32.8% since first listed9 events — show timeline
- 2026-05-01 Listed $284,999 Unlock MLS
- 2019-01-17 Sold (MLS) — Unlock MLS
- 2018-12-22 Pending — Unlock MLS
- 2018-10-14 Price Changed $222,866 Unlock MLS
- 2018-09-25 Price Changed $222,166 Unlock MLS
- 2018-08-04 Price Changed $220,166 Unlock MLS
- 2018-06-07 Price Changed $218,166 Unlock MLS
- 2018-06-02 Price Changed $217,581 Unlock MLS
- 2018-05-14 Listed $214,581 Unlock MLS
Property tax history
+0.9%/yrLatest (2026): $7,045 · -4.3% YoY. Source: county tax records.
Cash-flow waterfall
monthlySold comps — $/sqft
last 12 mo · ≤1 miLoading sold comps…