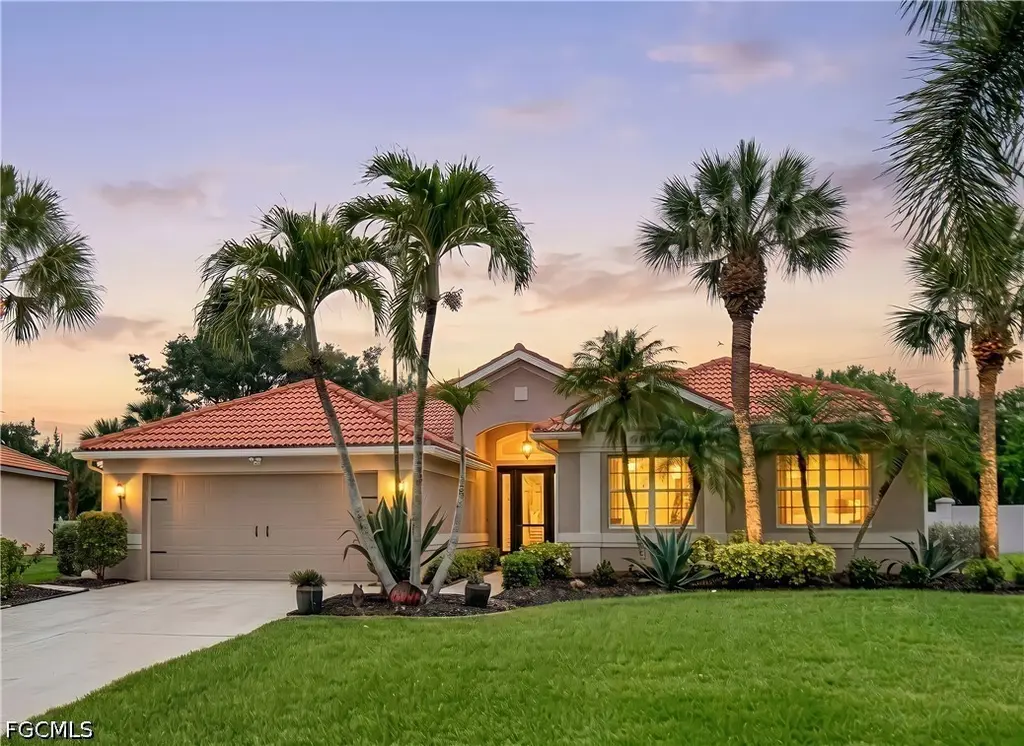
12111 Hidden Links Dr · Gateway, FL
Flood risk 1/10 · Minimal
- FEMA flood zone
- X (unshaded)
- Chance of flooding over 30 yrs
- 0.0%
- Est. flood insurance / yr
- $507 – $1,088
Fire risk 4/10 · Minor
- Est. fire insurance / yr
- $947 – $1,759
Heat risk 10/10 · Severe
- Hot days now (above 107°F)
- 7 days/yr
- Hot days in 30 yrs
- 30 days/yr
Wind risk 10/10 · Severe
- Chance of severe wind over 30 yrs
- 99.0%
Air-quality risk 2/10 · Minimal
- Unhealthy air days now
- 1 days/yr
- Unhealthy air days in 30 yrs
- 1 days/yr
Risk factors via First Street. Map © Google.
Why this score? — see what drove the B grade
The composite is a weighted blend of 9 inputs, each scored 0–100. Each bar is that input's sub-score; the figure is the points it added to the 100-point composite (weight × sub-score).
- Cash flow +26.9/30.0
- ARV discount +15.0/15.0
- DSCR +9.3/10.0
- 1% rule +7.4/10.0
- Schools +4.1/10.0
- Livability +3.5/5.0
- Rent growth +2.6/5.0
- Condition / age +2.5/5.0
- Appreciation +0.0/10.0
$415,000
🖨 Deal sheet (PDF) 📄 Offer letter ✓ Due diligence
Listing remarks
Welcome to this beautifully situated 3bedroom 2 bath single-family home located in the gated peaceful community of Hidden Links in Gateway! This inviting home offers a serene setting with a huge backyard, room for a pool and backyard oasis. Also nearby access to a community lap pool & hot tub perfect for enjoying the Florida lifestyle. Hidden Links neighborhood has its own private lap pool and hot tub surrounded by oak trees. Seller is offering exceptional value by paying for a FULL ROOF REPLACEMENT at closing, giving buyers peace of mind and long-term protection. In addition, a HOME WARRANTY covering the AC unit, appliance, water heater, and more will be provided, making this home a
Key facts
- Gated community
- Home warranty
- Community lap pool
Tags
Property features AI
Finance
- Financial info: Pets allowed
- HOA & community: Homeowners association (quarterly fee); Association amenities include golf course, pool, spa/hot tub, management; Association fee covers association management, cable TV, irrigation water, legal/accounting, pest control, road maintenance, sewer, street lights, security, trash; Community features: golf, gated community, tennis courts, street lights; Community of about 50 units
Exterior
- Parking: Attached 2-car garage; Paved parking; Garage door opener; Two covered spaces
- Security: Gated community with security gate; Security guard; Key card entry; Smoke detector(s)
- Utilities: Public water; Public sewer; Cable available; High speed internet available; Underground utilities; Irrigation uses reclaimed water
- Home design: Single-story home; Resale property; Faces West; Exposed to East
- Construction: Block, concrete and stucco construction; Tile roof
- Exterior features: Lanai (screened porch); Porch; Screened porch; Sprinkler/Irrigation system; Room for pool; Privacy wall; Shutters (manual); Oversized lot; Cul-de-sac lot; Sprinklers (automatic); Paved road
Interior
- Kitchen: Dryer; Dishwasher; Electric cooktop; Disposal; Indoor grill; Icemaker; Microwave; Range; Refrigerator with ice maker; Self-cleaning oven; Refrigerator; Water purifier; Kitchen island; Pantry; Breakfast bar
- Bedrooms: Primary bedroom on main level; Split bedroom layout
- Flooring: Carpet; Laminate; Tile
- Bathrooms: 2 full bathrooms; Dual sinks; Bidet; Separate shower; Bathtub
- Heating & cooling: Central heating (electric); Central air conditioning (electric); Ceiling fan(s)
- Interior features: Furnished; Breakfast bar; Entrance foyer; High ceilings; Living/Dining room; Main level primary bedroom; Pantry; Walk-in pantry; Walk-in closet(s); Window coverings; Window treatments; Cable TV available; High speed internet available; Split bedrooms; Bidet; Bathtub; Dual sinks; Separate shower; Kitchen island
- Laundry & utility: Washer; Dryer; Indoor laundry
Neighborhood map
What this means for you Summary
Snapshot
- This is a 2-bed/2.0-bath single-family listed at $415k.
Deal economics
- At list price, monthly cash flow is $1k ($14k/yr) — positive.
- The deal already cash-flows at list — no discount required.
- Meets the 1% rule at list price ($5k rent vs $415k).
- Recommended offer: $403k (3.0% below list) — sets the bar for market timing.
- Cap rate 9.6% vs local median 3.5% in Gateway — top-decile yield for the area; either an underpriced asset or a hidden risk that comps aren't pricing in. Stress-test before assuming the spread holds.
Location & tenants
- Location reads 69/100 on livability (#477 in FL) — a middle-class / working-renter tenant base. Strengths: crime A+, employment A+, housing A+; Watch: cost of living C-, amenities F, commute F.
- Lee (suburban): math 47% / reading 50% proficiency, ranked #42 of 73 in FL (top 58%) — families likely to look elsewhere, expect single-tenant / working-renter base with shorter leases.
- Market conditions: Rents flat; 811 active listings in the ZIP; 40 comparable units currently listed for rent nearby; rentals at typical pace (median 24d on market — plan ~3-4 weeks tenant-placement turnaround); high-income renter base; 15,411 units permitted in Lee County in 2024 (4,686 in 5+ unit buildings).
- At $5,147/mo this rent would consume 56% of the median local household income ($110k/yr) (locally 276% of renters already pay >50% of income on rent) — very limited rent-growth headroom before tenants either downsize or default.
Forward outlook
- Local home prices are declining (-3.0%/yr); year-one equity from $3k of loan paydown is wiped out by about $12k of value loss. Plan a longer hold.
- Lee County population projected at +44% by 2050 — long-run rental-demand tailwind backs the buy-and-hold thesis.
Negotiation context
- It's been on market 38 days — a 3% lower offer ($403k) is reasonable based on typical stale-listing flexibility.
Risks & watch-outs
- Climate carrying-cost: severe wind risk, 99% chance of damaging wind over 30y; extreme-heat days projected 7→30/yr by 2055 (HVAC capex compounding) — expect insurance premiums to compound above CPI over the hold.
Questions for the listing agent
- It's been on market 38 days. Have you received any prior offers? Is the seller open to a 3% concession, seller financing, or rate buy-down credit?
- What does the HOA fee cover, when was the last increase, and are there any pending special assessments or reserve-fund shortfalls?
- Is there a deadline driving the sale (1031 exchange, divorce, estate, relocation)? That informs how much negotiation room exists.
- Schools are B-rated — typically a magnet for longer-tenancy family renters. What's the average tenant stay here, and is there a school-zone premium baked into asking?
- What's the average days-on-market for RENTAL listings here right now (not sales)? A rising rental-DOM trend means longer vacancies and softer asking-rent achievability than the comps imply.
- What's the recent tenant-quality profile in this submarket — average credit score on applications, eviction rate, late-payment / NSF rate, and stable-employment percentage? A property-management company in the area should have these aggregated.
- How much new for-sale + rental construction is in the pipeline within 1–3 miles? Heavy new supply typically softens prices + rents 12–24 months out; constrained supply supports both.
Investment metrics
- 1% rule
- 1.24% ✓
- Cap rate
- 9.62%
- Cash-on-cash
- 11.88%
- DSCR
- 1.53
- GRM
- 6.7
CMA / ARV
- ARV (on-the-fly)
- $516,705
- Comps found
- 10
Show comp detail 10 sales within ~0.75 mi
| Address | Dist | Beds/Ba | Sqft | Sold | Price | $/sf | Match |
|---|---|---|---|---|---|---|---|
| 11420 Arezzo Way | 0.55mi | 2/2.0 | 1,822 (+0%) | 15mo | $399,000 | $219 | 61 |
| 12542 Ivory Stone Loop | 0.69mi | 2/2.0 | 1,836 (+1%) | 9mo | $375,000 | $204 | 58 |
| 12560 Lake Run Dr | 0.50mi | 3/2.0 (+1) | 1,931 (+6%) | 4mo | $550,000 | $285 | 57 |
| 11277 Callaway Greens Dr | 0.70mi | 3/2.0 (+1) | 1,660 (-8%) | 3mo | $490,000 | $295 | 46 |
| 12421 Eagle Pointe Cir | 0.61mi | 3/2.5 (+1) | 2,021 (+12%) | 1mo | $350,000 | $173 | 44 |
| 12563 Stone Tower Loop | 0.72mi | 3/2.0 (+1) | 2,001 (+10%) | 2mo | $340,000 | $170 | 42 |
| 10614 Pistoia Dr | 0.60mi | 3/3.0 (+1) | 2,032 (+12%) | 5mo | $745,000 | $367 | 38 |
| 10209 Livorno Dr | 0.68mi | 3/3.0 (+1) | 1,852 (+2%) | 22mo | $585,000 | $316 | 37 |
| 12411 Jewel Stone Ln | 0.54mi | 3/2.0 (+1) | 2,001 (+10%) | 24mo | $390,000 | $195 | 32 |
| 11855 Cantanzaro Ct | 0.53mi | 3/3.0 (+1) | 2,032 (+12%) | 22mo | $595,000 | $293 | 28 |
Match score weights: distance 35% · size 25% · config 20% · recency 20%. Top-matched comps best support the ARV.
Projected returns pro-forma
-3.0% appreciation · 0.37% rent growth · sell at horizon
- IRR
- -1.7%
- Equity multiple
- 0.94×
- Total profit
- $-7,154
- Equity at exit
- $61,878
- IRR
- 4.9%
- Equity multiple
- 1.32×
- Total profit
- $36,872
- Equity at exit
- $35,882
Cash invested: $116,200 (down + closing). Projections, not guarantees.
Landlord ↔ Tenant lean methodology
- Overall (STATE)
- 87 Strongly Landlord-Friendly
- State Florida
- 87 Strongly Landlord-Friendly · R+3
- County
- — inherits STATE
- City
- — inherits STATE
ZIP-level market 33913
- Home prices YoY
- -10.3%
- Rents YoY
- 0.4%
- Active inventory
- 811
- Price-to-rent
- 6.7×
Monthly cashflow live
- Estimated rent
- $5,147 high interval (Pro) →
- Mortgage (P&I)
- −$2,176
- Tax from tax record
- −$327 /mo · $3,920/yr
- Insurance
- −$173
- HOA
- −$240
- Vacancy / Maint / Mgmt
- −$1,081
- Net cashflow
- $1,150
Break-even live
Sensitivity live
| Price | -10% $1,385 | -5% $1,268 | +0% $1,150 | +5% $1,033 | +10% $915 |
|---|---|---|---|---|---|
| Rent | -10% $744 | -5% $947 | +0% $1,150 | +5% $1,354 | +10% $1,557 |
| Rate | -1.0pp $1,359 | -0.5pp $1,256 | base $1,150 | +0.5pp $1,043 | +1.0pp $933 |
UW: 25.0% down · 7.5% · 30yr · 1.5% tax · 5.0% vac · 8.0% maint · 8.0% mgmt
Financing live
Cash to close
- Down payment
- $103,750
- Closing costs
- $12,450
- Reserves months
- —
- Total cash needed
- —
Loan-product check · same deal, 3 products live
Conventional
25% down · 7.5% · 30yr
- Down + closing
- —
- Monthly P&I
- —
- Monthly cashflow
- —
- DSCR
- —
- Eligible?
- —
Personal DTI + credit; lowest rate.
DSCR
20% down · 8.5% · 30yr
- Down + closing
- —
- Monthly P&I
- —
- Monthly cashflow
- —
- DSCR
- —
- Eligible?
- —
No personal income docs; deal must DSCR.
Hard money
10% down · 12.0% · 12mo
- Down + closing
- —
- Monthly P&I
- —
- Monthly cashflow
- —
- DSCR
- —
- Eligible?
- —
Short-term bridge; refi at stabilization.
Rent comps 40 comps
| Address | Beds | Baths | Sqft | Rent | $/sqft | DOM | Units | Dist |
|---|---|---|---|---|---|---|---|---|
| 12021 Brassie Cir #201 Fort Myers, FL | 3.0 | 2.0 | 2343 | $2,700 | $1.15 | 3d | 1 | 0.19mi |
| 12482 Kentwood Ave Fort Myers, FL | 3.0 | 2.5 | 2251 | $4,900 | $2.18 | 19d | 1 | 0.28mi |
| 11900 Grosseto Ct Fort Myers, FL | 2.0 | 2.0 | 1713 | $5,500 | $3.21 | 24d | 1 | 0.33mi |
| 11900 Grosseto Ct Fort Myers, FL | 2.0 | 2.0 | 1713 | $6,000 | $3.50 | 19d | 1 | 0.33mi |
| 10284 Livorno Dr Fort Myers, FL | 3.0 | 3.0 | 2202 | $7,000 | $3.18 | 3d | 1 | 0.43mi |
| 12525 Astor Pl Unit 1049698P Fort Myers, FL | 3.0 | 2.0 | 2174 | $6,065 | $2.79 | 15d | 1 | 0.52mi |
| 10455 Casella Way #202 Fort Myers, FL | 3.0 | 2.0 | 2319 | $7,200 | $3.10 | 24d | 1 | 0.67mi |
| 11082 Lakeland Cir Fort Myers, FL | 3.0 | 2.0 | 1883 | $2,095 | $1.11 | 24d | 1 | 0.81mi |
| 10520 Casella Way #101 Fort Myers, FL | 3.0 | 2.0 | 1722 | $7,000 | $4.07 | 24d | 1 | 0.89mi |
| 10529 Casella Way #102 Fort Myers, FL | 3.0 | 2.0 | 1722 | $4,500 | $2.61 | 24d | 1 | 0.89mi |
| 11343 Tiverton Trce Fort Myers, FL | 2.0 | 2.0 | 1685 | $4,000 | $2.37 | 3d | 1 | 0.92mi |
| 10730 Cetrella Dr Fort Myers, FL | 3.0 | 2.0 | 1558 | $6,900 | $4.43 | 24d | 1 | 0.99mi |
| 11442 Tiverton Trce Fort Myers, FL | 3.0 | 2.0 | 2010 | $9,500 | $4.73 | 24d | 1 | 1.04mi |
| 10714 Cetrella Dr Fort Myers, FL | 2.0 | 2.0 | 1227 | $5,500 | $4.48 | 24d | 1 | 1.05mi |
| 11170 Lakeland Cir Fort Myers, FL | 3.0 | 2.0 | 1571 | $1,975 | $1.26 | 15d | 1 | 1.07mi |
| 10820 Palazzo Way #203 Fort Myers, FL | 2.0 | 2.0 | 1235 | $5,400 | $4.37 | 24d | 1 | 1.08mi |
| 10702 Cetrella Dr Fort Myers, FL | 2.0 | 2.0 | 1347 | $5,500 | $4.08 | 24d | 1 | 1.09mi |
| 10700 Cetrella Dr Fort Myers, FL | 2.0 | 2.0 | 1227 | $3,500 | $2.85 | 24d | 1 | 1.10mi |
| 10791 Palazzo Way #301 Fort Myers, FL | 2.0 | 2.0 | 1390 | $5,300 | $3.81 | 24d | 1 | 1.17mi |
| 10428 Materita Dr Fort Myers, FL | 2.0 | 2.0 | 1568 | $6,250 | $3.99 | 24d | 1 | 1.19mi |
| 2419 Joe Ave S Lehigh Acres, FL | 3.0 | 2.0 | 2232 | $1,195 | $0.54 | 3d | 1 | 1.24mi |
| 10751 Palazzo Way #103 Fort Myers, FL | 2.0 | 2.0 | 1235 | $5,000 | $4.05 | 24d | 1 | 1.26mi |
| 2431 Paul Ave S Lehigh Acres, FL | 3.0 | 2.0 | 2600 | $2,000 | $0.77 | 24d | 1 | 1.26mi |
| 12010 Rock Brook Run #1704 Fort Myers, FL | 2.0 | 2.5 | 1410 | $1,750 | $1.24 | 21d | 1 | 1.27mi |
| 9440 Ivy Brook Run Fort Myers, FL | 2.0–3.0 | 2.5 | 1269 | $1,550 | $1.22 | 24d | 2 | 1.27mi |
| 12011 Rock Brook Run #2003 Fort Myers, FL | 2.0 | 2.5 | 1344 | $1,650 | $1.23 | 16d | 1 | 1.28mi |
| 10711 Palazzo Way Unit 203 Fort Myers, FL | 2.0 | 2.0 | 1257 | $5,300 | $4.22 | 21d | 1 | 1.29mi |
| 10711 Palazzo Way Fort Myers, FL | 2.0 | 2.0 | 1257 | $3,900 | $3.10 | 16d | 2 | 1.29mi |
| 10700 Palazzo Way #201 Fort Myers, FL | 2.0 | 2.0 | 1390 | $5,000 | $3.60 | 21d | 1 | 1.30mi |
| 2404 Mae Ave S Lehigh Acres, FL | 2.0 | 2.0 | 2242 | $1,700 | $0.76 | 24d | 1 | 1.31mi |
| 11230 Suffield St Fort Myers, FL | 2.0 | 2.0 | 1560 | $8,500 | $5.45 | 24d | 1 | 1.31mi |
| 12001 Rock Brook Run #1903 Fort Myers, FL | 2.0 | 2.5 | 1410 | $1,750 | $1.24 | 3d | 1 | 1.31mi |
| 2402 Lantana Ave S Unit 2402 Lehigh Acres, FL | 3.0 | 2.0 | 1840 | $1,750 | $0.95 | 21d | 1 | 1.32mi |
| 9420 Ivy Brook Run Fort Myers, FL | 2.0 | 2.5 | 1415 | $1,700 | $1.20 | 24d | 1 | 1.33mi |
| 5022 25th St SW Lehigh Acres, FL | 3.0 | 2.0 | 2388 | $1,850 | $0.77 | 11d | 1 | 1.33mi |
| 2401 Matena Ave S Lehigh Acres, FL | 3.0 | 2.0 | 1400 | $1,850 | $1.32 | 24d | 1 | 1.34mi |
| 5317 30th St SW Lehigh Acres, FL | 3.0 | 2.0 | 2508 | $1,700 | $0.68 | 15d | 1 | 1.39mi |
| 5317 30th St SW Lehigh Acres, FL | 3.0 | 2.0 | 1600 | $1,650 | $1.03 | 3d | 1 | 1.39mi |
| 5321 30th St SW Lehigh Acres, FL | 3.0 | 2.0 | 2292 | $1,450 | $0.63 | 24d | 1 | 1.41mi |
| 11801 Pine Timber Ln Fort Myers, FL | 3.0 | 2.5 | 2508 | $8,000 | $3.19 | 24d | 1 | 1.42mi |
HOA detail
- Monthly dues
- $240 · $2,880/yr
- Likely covers
- waterpoolsecurity
Listing history 2 events
-
2026-05-13price $415,000
-
2026-04-19$420,000 Active
ⓘ Source: listings_history table (triggers on properties + properties_extension) + one-shot
backfill from property_details.listing_events for pre-trigger history.
Tax reassessment forecast FL · Resets to sale price
- Current annual tax
- $3,920 · $327/mo
- Projected year-2 tax
- $3,920 · $327/mo
- Expected delta
- $0/yr ($0/mo · -0.0%)
ⓘ Screening estimate from a state-policy table — verify with the county assessor before closing.
Climate risk First Street
- Flood 1/10 Low FEMA zone X (unshaded) · 0% chance over 30 yrs
- Wildfire 4/10 Moderate
- Heat 10/10 Extreme 7 d/yr ≥107°F today · 30 d/yr by 30 yrs out
- Wind 10/10 Extreme 99% chance of damaging wind over 30 yrs
- Air quality 2/10 Low 1 unhealthy d/yr today · 1 by 30 yrs out
Nearby sold comps map
Loading sold comps map…
Walkable amenities ~0.75 mi
Loading nearby amenities…
Taxation est. · year 1
- Rental income
- $61,764
- − Mortgage interest
- −$23,246
- − Property taxes
- −$3,920
- − Insurance
- −$2,075
- − Repairs & maintenance
- −$4,941
- − Management
- −$4,941
- − HOA
- −$2,880
- − Depreciation
- −$12,073
- Taxable income
- $7,688
- Est. tax owed @ 24.0%
- −$1,845
- After-tax cash flow
- $11,958/yr
For passive investors: Depreciation is non-cash, so a rental often shows a tax loss while cash-flowing — sheltering income. Rental losses are passive: they offset passive income freely, and up to $25,000/yr can offset ordinary (W-2) income if you actively participate and your MAGI is under $100k (phasing out to $0 by $150k); unused losses carry forward. On sale, claimed depreciation is recaptured at up to 25%, and gains may owe capital-gains tax (a 1031 exchange can defer both). Figures are a year-1 estimate at your 24.0% rate — not tax advice; consult a CPA.
Schools (NCES district)
- District
- Lee
- NCES district ID
- 1201080
- Math proficiency
- 47% ▼ -11.00%
- Reading proficiency
- 50% ▼ -4.00%
- Median HH income
- $49,518
- Composite
- 41.49/100
- National rank
- #3458
- State rank
- #42 of 73 in FL
Livability — Gateway
- Score
- 69/100
- State rank
- #477
- US rank
- #8703
Category grades
Schools grade is shown separately in the Schools card above.
Census & demographics
- Census place
- Gateway, FL
- County
- Lee County · 788,662 people
- Metro
- Cape Coral-Fort Myers, FL
- Population (ZIP)
- 31,538
- Household income
- $110,373
- Rent vs Own
- Severe rent burden
- 276.0
Population outlook (Lee County) Hauer SSP2
- Today (2025)
- 871,946 people
- By 2030
- 955,468 · +9.6%
- By 2040
- 1,113,587 · +27.7%
- By 2050
- 1,256,891 · +44.1%
- By 2075
- 1,560,270 · +78.9%
- By 2100
- 1,726,848 · +98.0%
Race, ethnicity, and origin ACS 2023
- Neighborhood character
- Predominantly White (74%)
- Race & ethnicity
- White 74% Hispanic / Latino 13% Two or more races 11% Black 5% Asian 2%
- Hispanic origin (detail)
- Mexican 3% Puerto Rican 3% Cuban 2%
- Common ancestry
- Romanian 5% Lithuanian 3% Slovak 2%
- Foreign-born
- 14% · Canada, Vietnam, China
- Languages at home
- 84% English-only · Spanish 10% Other Indo-European 2% French/Haitian/Cajun 2%
Political lean MEDSL · Lee
- 2024 margin
- Strong R (+28.4) · D 35.5% · R 63.9%
- 2008→2024 swing
- -18.0pp toward R · 2008: -10.4pp · 2024: -28.4pp
- All cycles
- 2024: R+28.4 2020: R+19.2 2016: R+20.4 2012: R+16.6 2008: R+10.4
Not yet ingested
- Civics
- —
Market trends
- HPI YoY
- ▼ -25.45%
- Current HPI
- 221.7115
- Rent YoY
- ▲ 0.37%
- Metro
- Cape Coral-Fort Myers, FL
- State GDP YoY
- ▲ 3.28%
- F500 in state
- 36
Industry mix (Fortune 500 HQ in FL)
| Industry | F500 HQs | Revenue |
|---|---|---|
| Industrial Technology | 2 | $29B |
|
||
| Insurance | 2 | $17B |
|
||
| Retail | 1 | $60B |
|
||
| Technology Distribution | 1 | $58B |
|
||
| Homebuilding | 1 | $35B |
|
||
| Technology Manufacturing | 1 | $35B |
|
||
Price history
-1.2% since first listed2 events — show timeline
- 2026-05-13 Price Changed $415,000 FORTMLS
- 2026-04-19 Listed $420,000 FORTMLS
Property tax history
+3.6%/yrLatest (2025): $3,920 · +5.7% YoY. Source: county tax records.
Cash-flow waterfall
monthlySold comps — $/sqft
last 12 mo · ≤1 miLoading sold comps…