205 W 5th St · Pineville, MO
Flood risk 1/10 · Minimal
- FEMA flood zone
- X (unshaded)
- Chance of flooding over 30 yrs
- 0.0%
- Est. flood insurance / yr
- $507 – $1,088
Fire risk 4/10 · Minor
- Est. fire insurance / yr
- $1,054 – $1,958
Heat risk 6/10 · Moderate
- Hot days now (above 106°F)
- 7 days/yr
- Hot days in 30 yrs
- 22 days/yr
Wind risk 2/10 · Minimal
- Chance of severe wind over 30 yrs
- 2.0%
Air-quality risk 2/10 · Minimal
- Unhealthy air days now
- 1 days/yr
- Unhealthy air days in 30 yrs
- 1 days/yr
Risk factors via First Street. Map © Google.
Why this score? — see what drove the D grade
The composite is a weighted blend of 9 inputs, each scored 0–100. Each bar is that input's sub-score; the figure is the points it added to the 100-point composite (weight × sub-score).
- Cash flow +10.5/30.0
- Appreciation +7.6/10.0
- ARV discount +7.5/15.0
- 1% rule +3.1/10.0
- Schools +3.1/10.0
- Livability +3.1/5.0
- DSCR +3.0/10.0
- Rent growth +2.5/5.0
- Condition / age +2.5/5.0
$199,000
🖨 Deal sheet (PDF) 📄 Offer letter ✓ Due diligence
Listing remarks
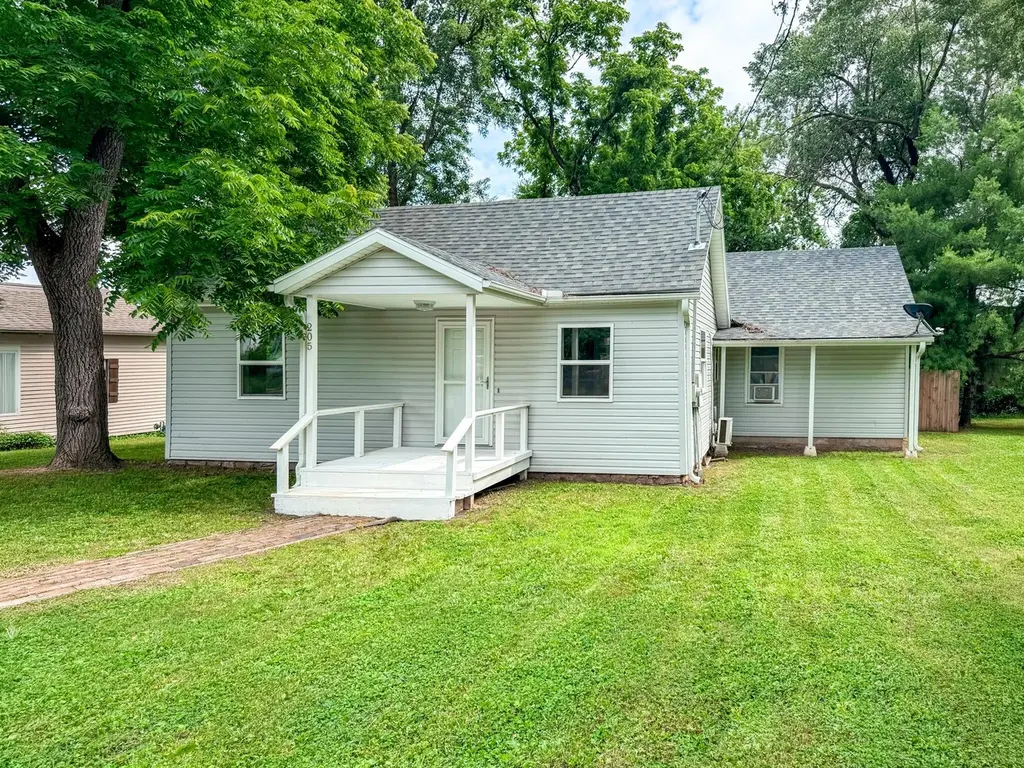
Seize your chance to own this delightful 4-bedroom, 2-bathroom home in the heart of downtown Pineville, Missouri! Perfectly positioned, this gem features a spacious kitchen with a central island, a generous living area, and ample bedrooms for you and your loved ones. The fenced backyard offers a haven for pets or a private retreat to unwind on the back deck. With quick access to Hwy 49, you're just minutes from NWA, Neosho, or Joplin. Don't miss out on this ideal blend of charm and convenience!
Key facts
- Central island
- Spacious kitchen
- Private retreat
Tags
Property features AI
Exterior
- Parking: Has garage
- Utilities: Public water; Public sewer
- Home design: Single-family residence; One level
- Construction: Vinyl siding; Asphalt roof
- Exterior features: Front porch; Rear porch; Privacy fencing; Shed(s); Has a view
Interior
- Kitchen: Electric oven; Free-standing electric oven; Dishwasher
- Flooring: Carpet; Tile; Laminate
- Bathrooms: 2 full bathrooms
- Heating & cooling: Electric and natural gas heating; Baseboard and wall furnace heating options; Ceiling fans; Window air conditioning units
- Interior features: Fireplace in the living room (gas); Tankless and electric water heaters; Disposal
- Laundry & utility: Laundry on main level
Neighborhood map
What this means for you Summary
Snapshot
- This is a 4-bed/2.0-bath other listed at $199k.
Deal economics
- At list price, monthly cash flow is $-102 ($-1k/yr) — negative.
- To cash-flow at today's rent, offer at most $184k (7.4% below list).
- To meet the 1% rule (rent ≥ 1% of price), the offer needs to be $161k (19.0% below list).
- Recommended offer: $161k (19.0% below list) — sets the bar for 1% rule.
Location & tenants
- Location reads 61/100 on livability (#447 in MO) — a middle-class / working-renter tenant base. Strengths: cost of living A+, housing B+; Watch: crime F, amenities F, commute F.
- Mcdonald County R-I (rural): math 34% / reading 41% proficiency, ranked #192 of 324 in MO (top 59%) — families likely to look elsewhere, expect single-tenant / working-renter base with shorter leases; 61% free/reduced lunch — lower-income household profile, screen leases tightly.
- Zoned schools: Pineville Primary (100 students, 48% FRL); Pineville Elem. (math 37% / reading 47%, grade D-, #149 of 391 statewide, top 41%, 121 students, 55% FRL); Mcdonald County High (math 15% / reading 52%, grade F, #349 of 521 statewide, top 67%, 1,051 students, 59% FRL).
- Market conditions: 48 active listings in the ZIP; 20 units permitted in McDonald County in 2024 (0 in 5+ unit buildings).
Forward outlook
- In year one you build about $12k of equity ($1k loan paydown + $10k appreciation (5.2% local appreciation)).
- McDonald County population projected at -14% by 2050 — secular population decline; favor cash flow + early exit over multi-decade hold.
- By year 4, paydown + projected appreciation supports a ~$40k cash-out refi (75% LTV) — recoverable capital for the next deal without selling this one.
Negotiation context
- Only 8 days on market — expect competitive offers; lowballing is unlikely to land.
- 4 sale attempts since 5y ago with the ask held roughly flat each time — persistent listings suggest the price (not the market) is what's stuck; bring a comps-based counter.
Risks & watch-outs
- Watch-outs: built in 1920 — expect roof / HVAC / electrical / plumbing capex.
- Climate carrying-cost: extreme-heat days projected 7→22/yr by 2055 (HVAC capex compounding) — expect insurance premiums to compound above CPI over the hold.
Questions for the listing agent
- What do current leases actually rent for vs. the listed asking? Can we see a recent rent roll and the last 12 months of T-12 income?
- Built in 1920 — when were the roof, HVAC, electrical panel, plumbing, and water heater last replaced?
- Is there a deadline driving the sale (1031 exchange, divorce, estate, relocation)? That informs how much negotiation room exists.
- Schools are D-rated, which usually means shorter tenancies and higher turnover. Who's the typical renter profile here, and what's been the actual vacancy rate?
- Crime grade is F in this area — have there been break-ins, vandalism, or insurance claims at this property in the last 3 years? What carrier currently insures it and at what premium?
- The area grade is low — what's the realistic commute time and amenity access for the typical tenant pool here? Any planned neighborhood developments (good or bad) we should know about?
- What's the average days-on-market for RENTAL listings here right now (not sales)? A rising rental-DOM trend means longer vacancies and softer asking-rent achievability than the comps imply.
- What's the recent tenant-quality profile in this submarket — average credit score on applications, eviction rate, late-payment / NSF rate, and stable-employment percentage? A property-management company in the area should have these aggregated.
- How much new for-sale + rental construction is in the pipeline within 1–3 miles? Heavy new supply typically softens prices + rents 12–24 months out; constrained supply supports both.
Investment metrics
- 1% rule
- 0.81% ✗
- Cap rate
- 5.68%
- Cash-on-cash
- -2.19%
- DSCR
- 0.90
- GRM
- 10.3
CMA / ARV
No comps found within radius.
Projected returns pro-forma
5.24% appreciation · 3.0% rent growth · sell at horizon
- IRR
- 11.7%
- Equity multiple
- 1.76×
- Total profit
- $42,151
- Equity at exit
- $115,686
- IRR
- 12.7%
- Equity multiple
- 3.37×
- Total profit
- $131,863
- Equity at exit
- $202,110
Cash invested: $55,720 (down + closing). Projections, not guarantees.
Landlord ↔ Tenant lean methodology
- Overall (STATE)
- 81 Strongly Landlord-Friendly
- State Missouri
- 81 Strongly Landlord-Friendly · R+10
- County
- — inherits STATE
- City
- — inherits STATE
ZIP-level market 64856
- Home prices YoY
- 2.9%
- Active inventory
- 48
- Price-to-rent
- 10.3×
Monthly cashflow live
- Estimated rent
- $1,612 medium interval (Pro) →
- Mortgage (P&I)
- −$1,044
- Tax est. 1.5%
- −$249 /mo · $2,985/yr
- Insurance
- −$83
- HOA
- −$0
- Vacancy / Maint / Mgmt
- −$339
- Net cashflow
- $-102
Break-even live
Sensitivity live
| Price | -10% $36 | -5% $-33 | +0% $-102 | +5% $-171 | +10% $-239 |
|---|---|---|---|---|---|
| Rent | -10% $-229 | -5% $-165 | +0% $-102 | +5% $-38 | +10% $26 |
| Rate | -1.0pp $-2 | -0.5pp $-51 | base $-102 | +0.5pp $-153 | +1.0pp $-206 |
UW: 25.0% down · 7.5% · 30yr · 1.5% tax · 5.0% vac · 8.0% maint · 8.0% mgmt
Financing live
Cash to close
- Down payment
- $49,750
- Closing costs
- $5,970
- Reserves months
- —
- Total cash needed
- —
Loan-product check · same deal, 3 products live
Conventional
25% down · 7.5% · 30yr
- Down + closing
- —
- Monthly P&I
- —
- Monthly cashflow
- —
- DSCR
- —
- Eligible?
- —
Personal DTI + credit; lowest rate.
DSCR
20% down · 8.5% · 30yr
- Down + closing
- —
- Monthly P&I
- —
- Monthly cashflow
- —
- DSCR
- —
- Eligible?
- —
No personal income docs; deal must DSCR.
Hard money
10% down · 12.0% · 12mo
- Down + closing
- —
- Monthly P&I
- —
- Monthly cashflow
- —
- DSCR
- —
- Eligible?
- —
Short-term bridge; refi at stabilization.
Listing history 7 events
-
2026-06-21days on market $199,000 Active 8 DOM
-
2026-06-18days on market $199,000 Active 5 DOM
-
2026-06-17days on market $199,000 Active 4 DOM
-
2026-06-16days on market $199,000 Active 3 DOM
-
2026-06-15days on market $199,000 Active 2 DOM
-
2026-06-14remarks 499-char remark
-
2026-06-14$199,000 Active 1 DOM
ⓘ Source: listings_history table (triggers on properties + properties_extension) + one-shot
backfill from property_details.listing_events for pre-trigger history.
Climate risk First Street
- Flood 1/10 Low FEMA zone X (unshaded) · 0% chance over 30 yrs
- Wildfire 4/10 Moderate
- Heat 6/10 Major 7 d/yr ≥106°F today · 22 d/yr by 30 yrs out
- Wind 2/10 Low 2% chance of damaging wind over 30 yrs
- Air quality 2/10 Low 1 unhealthy d/yr today · 1 by 30 yrs out
Nearby sold comps map
Loading sold comps map…
Walkable amenities ~0.75 mi
Loading nearby amenities…
Taxation est. · year 1
- Rental income
- $19,344
- − Mortgage interest
- −$11,147
- − Property taxes
- −$2,985
- − Insurance
- −$995
- − Repairs & maintenance
- −$1,548
- − Management
- −$1,548
- − Depreciation
- −$5,789
- Taxable loss
- −$4,667
- Est. tax savings @ 24.0%
- +$1,120
- After-tax cash flow
- $-101/yr
For passive investors: Depreciation is non-cash, so a rental often shows a tax loss while cash-flowing — sheltering income. Rental losses are passive: they offset passive income freely, and up to $25,000/yr can offset ordinary (W-2) income if you actively participate and your MAGI is under $100k (phasing out to $0 by $150k); unused losses carry forward. On sale, claimed depreciation is recaptured at up to 25%, and gains may owe capital-gains tax (a 1031 exchange can defer both). Figures are a year-1 estimate at your 24.0% rate — not tax advice; consult a CPA.
Schools (NCES district)
- District
- Mcdonald County R-I
- NCES district ID
- 2920610
- Math proficiency
- 34% ▼ -8.00%
- Reading proficiency
- 41% ▼ -9.00%
- Median HH income
- $38,301
- Composite
- 31.28/100
- National rank
- #6017
- State rank
- #192 of 324 in MO
Livability — Pineville
- Score
- 61/100
- State rank
- #447
- US rank
- #18254
Category grades
Schools grade is shown separately in the Schools card above.
Census & demographics
- Census place
- Pineville, MO
- Population (ZIP)
- 4,154
Population outlook (McDonald County) Hauer SSP2
- Today (2025)
- 21,753 people
- By 2030
- 21,154 · -2.8%
- By 2040
- 19,946 · -8.3%
- By 2050
- 18,666 · -14.2%
- By 2075
- 16,201 · -25.5%
- By 2100
- 14,550 · -33.1%
Race, ethnicity, and origin ACS 2023
- Neighborhood character
- Predominantly White (90%)
- Race & ethnicity
- White 90% Two or more races 7% Hispanic / Latino 2%
- Common ancestry
- Slovak 2% Serbian 2% Lithuanian 1%
- Foreign-born
- 2% · Canada
- Languages at home
- 98% English-only · Spanish 2% Other Asian/Pacific 1%
Political lean MEDSL · McDonald
- 2024 margin
- Solid R (+68.8) · D 15.2% · R 84.0%
- 2008→2024 swing
- -31.3pp toward R · 2008: -37.4pp · 2024: -68.8pp
- All cycles
- 2024: R+68.8 2020: R+66.6 2016: R+64.0 2012: R+48.3 2008: R+37.4
Not yet ingested
- Civics
- —
Market trends
- HPI YoY
- ▲ 5.24%
- Current HPI
- 183.5874
- Rent YoY
- —
- Metro
- —
- State GDP YoY
- ▲ 1.84%
- F500 in state
- 20
Industry mix (Fortune 500 HQ in MO)
| Industry | F500 HQs | Revenue |
|---|---|---|
| Healthcare | 1 | $163B |
|
||
| Insurance | 1 | $21B |
|
||
| Industrial Technology | 1 | $17B |
|
||
| Retail | 1 | $16B |
|
||
| Industrial Distribution | 1 | $10B |
|
||
| Utilities | 1 | $9B |
|
||
Price history
+37.2% since first listed13 events — show timeline
- 2026-06-13 Listed $199,000 SOMO
- 2025-11-11 Price Changed $189,900 NWARMLS
- 2025-10-17 Price Changed $189,900 SOMO
- 2025-09-15 Price Changed $194,900 SOMO
- 2025-08-11 Price Changed $204,900 SOMO
- 2025-08-11 Price Changed $204,900 NWARMLS
- 2025-07-24 Listed $208,900 SOMO
- 2021-12-10 Sold (MLS) — OGAR
- 2021-12-10 Sold (MLS) — SOMO
- 2021-10-15 Sold (Public Records) — Public Records
- 2021-09-29 Listed $145,000 SOMO
- 2021-09-29 Listed $145,000 OGAR
- 2016-07-26 Sold (Public Records) — Public Records
Property tax history
+1.8%/yrLatest (2025): $223 · +8.5% YoY. Source: county tax records.
Cash-flow waterfall
monthlySold comps — $/sqft
last 12 mo · ≤1 miLoading sold comps…