 Duplex
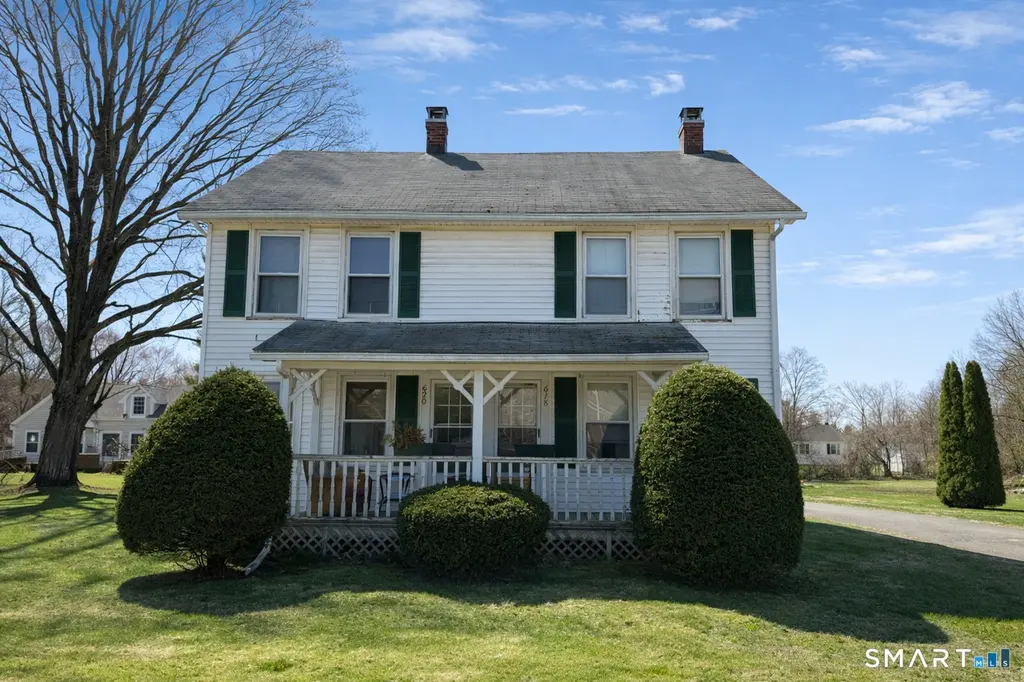
620 Main St · Somers, CT
Flood risk No data
- FEMA flood zone
- —
- Chance of flooding over 30 yrs
- —
- Est. flood insurance / yr
- —
Fire risk No data
- Est. fire insurance / yr
- —
Heat risk No data
- Hot days now (above threshold)
- —
- Hot days in 30 yrs
- —
Wind risk No data
- Chance of severe wind over 30 yrs
- —
Air-quality risk No data
- Unhealthy air days now
- —
- Unhealthy air days in 30 yrs
- —
Risk factors via First Street. Map © Google.
Why this score? — see what drove the B grade
The composite is a weighted blend of 9 inputs, each scored 0–100. Each bar is that input's sub-score; the figure is the points it added to the 100-point composite (weight × sub-score).
- Cash flow +30.0/30.0
- DSCR +10.0/10.0
- 1% rule +9.4/10.0
- ARV discount +7.5/15.0
- Schools +5.2/10.0
- Livability +3.4/5.0
- Rent growth +2.5/5.0
- Condition / age +2.5/5.0
- Appreciation +0.0/10.0
$375,000
🖨 Deal sheet 📄 Offer letter ✓ Due diligence
Multi-family units
County records classify this as Multi-Family (2-4 Unit). Listing-text estimate: 2 units. confirmed
Listing remarks
This side-by-side two-family property offers a great opportunity for both investors and owner-occupants, ideally located on Main Street with convenient access to local amenities, shopping, dining, and major routes. Each unit provides comfortable living space with separate utilities, offering flexibility for tenants and ease of management. The interiors of both units are remarkably well maintained, showcasing a level of care that stands out, especially for a home of this age. Higher-than-typical ceiling heights enhance the sense of space, creating a more open and inviting feel throughout. Current leases are month-to-month, and rents have not been increased over time, presenting a clear oppor
Key facts
- 0.46 acre lot
- 2 garage spots
- Built 1800
Property features AI
Exterior
- Parking: Detached garage; 2-car garage
- Utilities: Public water connected; Public sewer connected
- Home design: Multi-family 2-family property
- Construction: Frame construction; Concrete foundation
- Exterior features: Level lot; Vinyl siding; Asphalt shingle roof
Interior
- Bedrooms: 4 bedrooms total
- Bathrooms: 2 full bathrooms
- Heating & cooling: Hot air heating (oil-fired, above-ground tank); Window unit cooling
- Interior features: 8 total rooms; Full basement; Attic with pull-down stairs; Multi-family property with 2 units (8 total rooms)
Neighborhood map
What this means for you Summary
Snapshot
- This is a 2 × 2-bed/1.0-bath units multifamily listed at $375k.
Deal economics
- At list price, monthly cash flow is $2k ($22k/yr) — positive. Per door: $935/mo.
- The deal already cash-flows at list — no discount required.
- Meets the 1% rule at list price ($5k rent vs $375k).
- Cap rate 12.3% vs local median 2.9% in Somers — top-decile yield for the area; either an underpriced asset or a hidden risk that comps aren't pricing in. Stress-test before assuming the spread holds.
Location & tenants
- Location reads 68/100 on livability (#109 in CT) — a middle-class / working-renter tenant base. Strengths: crime A+, employment A+, housing A+; Watch: amenities F, commute F, cost of living F.
- Somers School District (suburban): math 49% / reading 63% proficiency, ranked #53 of 153 in CT (top 35%) — acceptable for families but not a draw, mixed tenant base, ~2y average lease; only 5% free/reduced lunch — higher-income household profile.
- Zoned schools: Somers Elementary School (math 46% / reading 56%, grade C-, #232 of 553 statewide, top 42%, 649 students, 7% FRL); Somers High School (math 52% / reading 77%, grade B-, #33 of 194 statewide, top 18%, 384 students, 4% FRL) — zoned schools at 6% FRL track the district average.
- Market conditions: 47 active listings in the ZIP; 1 comparable units currently listed for rent nearby; 1,867 units permitted in Capitol Planning Region in 2024 (1,399 in 5+ unit buildings).
Forward outlook
- Local home prices are declining (-3.0%/yr); year-one equity from $3k of loan paydown is wiped out by about $11k of value loss. Plan a longer hold.
- At projected returns (-3.0% appreciation + 3.0% rent growth), your $105k cash investment doubles in ~6 years — after that, you're playing with house money.
Negotiation context
- Only 13 days on market — expect competitive offers; lowballing is unlikely to land.
Risks & watch-outs
- Watch-outs: built in 1800 — expect roof / HVAC / electrical / plumbing capex.
Questions for the listing agent
- Can we see the unit-by-unit rent roll, current vacancy, and any below-market leases? What's the average tenancy length?
- What capital expenditures (roof, boiler, parking lot, exteriors) have been made in the last 5 years, and what's planned in the next 2?
- Built in 1800 — when were the roof, HVAC, electrical panel, plumbing, and water heater last replaced?
- Is there a deadline driving the sale (1031 exchange, divorce, estate, relocation)? That informs how much negotiation room exists.
- Schools are B-rated — typically a magnet for longer-tenancy family renters. What's the average tenant stay here, and is there a school-zone premium baked into asking?
- What's the average days-on-market for RENTAL listings here right now (not sales)? A rising rental-DOM trend means longer vacancies and softer asking-rent achievability than the comps imply.
- What's the recent tenant-quality profile in this submarket — average credit score on applications, eviction rate, late-payment / NSF rate, and stable-employment percentage? A property-management company in the area should have these aggregated.
- How much new apartment / multifamily construction is in the pipeline within 1–3 miles? Heavy new supply (>2% of stock underway) typically softens rents 12–24 months out; light construction supports rent growth.
Investment metrics
- 1% rule
- 1.44% ✓
- Cap rate
- 12.27%
- Cash-on-cash
- 21.36%
- DSCR
- 1.95
- GRM
- 5.8
CMA / ARV
No comps found within radius.
Projected returns pro-forma
-3.0% appreciation · 3.0% rent growth · sell at horizon
- IRR
- 13.9%
- Equity multiple
- 1.55×
- Total profit
- $58,236
- Equity at exit
- $55,914
- IRR
- 22.7%
- Equity multiple
- 2.94×
- Total profit
- $203,840
- Equity at exit
- $32,423
Cash invested: $105,000 (down + closing). Projections, not guarantees.
Landlord ↔ Tenant lean methodology
- Overall (STATE)
- 27 Tenant-Leaning
- State Connecticut
- 27 Tenant-Leaning · D+7
- County
- — inherits STATE
- City
- — inherits STATE
ZIP-level market 06071
- Active inventory
- 47
- Price-to-rent
- 11.6×
Monthly cashflow live
- Estimated rent
- $5,400 medium interval (Pro) →
- Mortgage (P&I)
- −$1,967
- Tax from tax record
- −$274 /mo · $3,290/yr
- Insurance
- −$156
- HOA
- −$0
- Vacancy / Maint / Mgmt
- −$1,134
- Net cashflow
- $1,869
Break-even live
2-unit breakdown (identical units grouped — click to expand)
| Units | Beds | Baths | Est. rent |
|---|---|---|---|
| 2× units | 2 | 1 | $5,400 |
| #1 | 2 | 1 | $2,700 |
| #2 | 2 | 1 | $2,700 |
| Total (2 units) | $5,400 | ||
UW: 25.0% down · 7.5% · 30yr · 1.5% tax · 5.0% vac · 8.0% maint · 8.0% mgmt
Financing live
Cash to close
- Down payment
- $93,750
- Closing costs
- $11,250
- Reserves months
- —
- Total cash needed
- —
Loan-product check · same deal, 3 products live
Conventional
25% down · 7.5% · 30yr
- Down + closing
- —
- Monthly P&I
- —
- Monthly cashflow
- —
- DSCR
- —
- Eligible?
- —
Personal DTI + credit; lowest rate.
DSCR
20% down · 8.5% · 30yr
- Down + closing
- —
- Monthly P&I
- —
- Monthly cashflow
- —
- DSCR
- —
- Eligible?
- —
No personal income docs; deal must DSCR.
Hard money
10% down · 12.0% · 12mo
- Down + closing
- —
- Monthly P&I
- —
- Monthly cashflow
- —
- DSCR
- —
- Eligible?
- —
Short-term bridge; refi at stabilization.
Rent comps 1 comps
| Address | Beds | Baths | Sqft | Rent | $/sqft | DOM | Units | Dist |
|---|---|---|---|---|---|---|---|---|
| 2 Robert St Somers, CT | 3.0 | 1.0 | 1488 | $2,700 | $1.81 | 2d | 1 | 0.28mi |
Listing history 4 events
-
2026-04-30status Under Contract
-
2026-04-19price $375,000
-
2026-04-18$400,000 Active
-
2026-04-12historical $400,000
ⓘ Source: listings_history table (triggers on properties + properties_extension) + one-shot
backfill from property_details.listing_events for pre-trigger history.
Tax reassessment forecast CT · Partial reset (capped growth)
- Current annual tax
- $3,290 · $274/mo
- Projected year-2 tax
- $5,658 · $471/mo
- Expected delta
- +$2,368/yr (+$197/mo · 72.0%)
ⓘ Screening estimate from a state-policy table — verify with the county assessor before closing.
Nearby sold comps map
Loading sold comps map…
Walkable amenities ~0.75 mi
Loading nearby amenities…
Taxation est. · year 1
- Rental income
- $64,800
- − Mortgage interest
- −$21,006
- − Property taxes
- −$3,290
- − Insurance
- −$1,875
- − Repairs & maintenance
- −$5,184
- − Management
- −$5,184
- − Depreciation
- −$10,909
- Taxable income
- $17,352
- Est. tax owed @ 24.0%
- −$4,164
- After-tax cash flow
- $18,264/yr
For passive investors: Depreciation is non-cash, so a rental often shows a tax loss while cash-flowing — sheltering income. Rental losses are passive: they offset passive income freely, and up to $25,000/yr can offset ordinary (W-2) income if you actively participate and your MAGI is under $100k (phasing out to $0 by $150k); unused losses carry forward. On sale, claimed depreciation is recaptured at up to 25%, and gains may owe capital-gains tax (a 1031 exchange can defer both). Figures are a year-1 estimate at your 24.0% rate — not tax advice; consult a CPA.
Schools (NCES district)
- District
- Somers School District
- NCES district ID
- 0904140
- Math proficiency
- 49% ▼ -3.00%
- Reading proficiency
- 63% ▼ -1.00%
- Median HH income
- $96,412
- Composite
- 52.14/100
- National rank
- #1615
- State rank
- #53 of 153 in CT
Livability — Somers
- Score
- 68/100
- State rank
- #109
- US rank
- #9446
Category grades
Schools grade is shown separately in the Schools card above.
Census & demographics
- Census place
- Somers, CT
- City population
- 10,554
- Population (ZIP)
- 10,554
Population outlook (Capitol County) Hauer SSP2
- By 2040
- 1,063,519
Race, ethnicity, and origin ACS 2023
- Neighborhood character
- Predominantly White (84%)
- Race & ethnicity
- White 84% Hispanic / Latino 6% Black 4% Two or more races 3%
- Hispanic origin (detail)
- Puerto Rican 2%
- Common ancestry
- Romanian 14% Lithuanian 10% Slovak 3%
- Foreign-born
- 4% · Canada
- Languages at home
- 96% English-only · Spanish 3%
Political lean MEDSL · Capitol
- 2024 margin
- Strong D (+21.9) · D 60.1% · R 38.2% · Other 1.7%
- All cycles
- 2024: D+21.9
Not yet ingested
- Civics
- —
Market trends
- HPI YoY
- ▼ -141.15%
- Current HPI
- 167.3798
- Rent YoY
- —
- Metro
- —
- State GDP YoY
- ▲ 1.06%
- F500 in state
- 38
Industry mix (Fortune 500 HQ in CT)
| Industry | F500 HQs | Revenue |
|---|---|---|
| Industrial Machinery | 4 | $38B |
|
||
| Insurance | 3 | $71B |
|
||
| Financial Services | 2 | $25B |
|
||
| Transportation / Logistics | 2 | $18B |
|
||
| Healthcare | 1 | $247B |
|
||
| Telecommunications | 1 | $55B |
|
||
Price history
-6.2% since first listed4 events — show timeline
- 2026-04-30 Pending — Smart MLS
- 2026-04-19 Price Changed $375,000 Smart MLS
- 2026-04-18 Listed $400,000 Smart MLS
- 2026-04-12 Coming Soon $400,000 Smart MLS
Property tax history
+0.9%/yrLatest (2023): $3,290 · +2.7% YoY. Source: county tax records.
Cash-flow waterfall
monthlySold comps — $/sqft
last 12 mo · ≤1 miLoading sold comps…