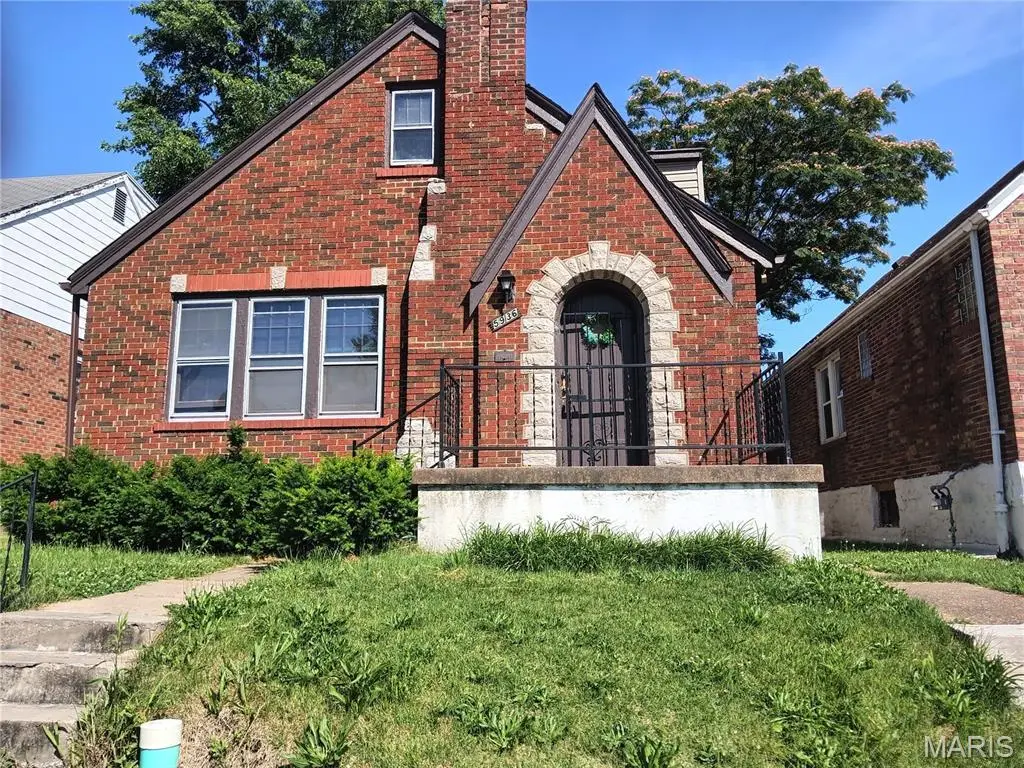
5936 Pamplin Ave · St. Louis, MO
Flood risk 1/10 · Minimal
- FEMA flood zone
- X (unshaded)
- Chance of flooding over 30 yrs
- 0.0%
- Est. flood insurance / yr
- $473 – $860
Fire risk 1/10 · Minimal
- Est. fire insurance / yr
- $1,054 – $1,958
Heat risk 5/10 · Moderate
- Hot days now (above 107°F)
- 7 days/yr
- Hot days in 30 yrs
- 22 days/yr
Wind risk 2/10 · Minimal
- Chance of severe wind over 30 yrs
- 1.0%
Air-quality risk 4/10 · Minor
- Unhealthy air days now
- 5 days/yr
- Unhealthy air days in 30 yrs
- 6 days/yr
Risk factors via First Street. Map © Google.
Why this score? — see what drove the C grade
The composite is a weighted blend of 9 inputs, each scored 0–100. Each bar is that input's sub-score; the figure is the points it added to the 100-point composite (weight × sub-score).
- Cash flow +26.1/30.0
- DSCR +8.8/10.0
- ARV discount +7.5/15.0
- 1% rule +5.8/10.0
- Rent growth +2.5/5.0
- Livability +2.5/5.0
- Condition / age +2.5/5.0
- Schools +1.2/10.0
- Appreciation +0.0/10.0
$110,000
🖨 Deal sheet 📄 Offer letter ✓ Due diligence
Listing remarks MLS
A must see! This home has been meticulously refurbished to blend the original styling with the modern amenities sought after today. This home needs nothing to move in except you and your belongings. The kitchen and both baths have been updated along with a new roof and gutters. The original hardwood floors gleam and the woodwork of the trim and doors are just fantastic. This home is in the sought after North Pointe neighborhood and is surrounded with great neighbors. Homes of this quality in this price range are far and few between, so don't let this one get away.
Key facts
- 3,044 sq ft lot
- Garage
- Built 1939
Property features AI
Finance
- Other: Home warranty available; Seller may consider concessions; Utility easement present
- HOA & community: Public bus access; Neighborhood sidewalks and street lights
Exterior
- Parking: Detached garage (1 car); Alley access and on-street parking; Secured garage/parking
- Security: Secured garage/parking
- Utilities: Public water; Public sewer; Electric service by Ameren; Cable available; Electricity available; Natural gas available; Water available; Sewer connected
- Home design: Single-family residence; Attached property; Two and a half levels; Fixer condition; Private ownership
- Construction: Brick construction; Shingle roof; Brick/mortar and concrete perimeter foundation; House structure type
- Exterior features: Patio; Porch with rear porch and screened area; Private backyard; Chain link fencing in backyard; Concrete road frontage on a city street; Near public transit; Sidewalks and street lights in neighborhood
Interior
- Kitchen: Dishwasher; Microwave; Free-standing gas oven; Refrigerator
- Bedrooms: 3 bedrooms total (1 on main level, 2 on upper level)
- Flooring: Hardwood; Laminate
- Bathrooms: 1 full bathroom; 1 half bathroom
- Heating & cooling: Forced air heating (natural gas); Central air conditioning; Ceiling fans
- Interior features: Ceiling fans; Eat-in kitchen; Master bedroom on main level; Window coverings and treatments
- Laundry & utility: Washer hookup; Laundry area in basement
Neighborhood map
What this means for you Summary
Snapshot
- This is a 3-bed/1.0-bath single-family listed at $110k.
Deal economics
- At list price, monthly cash flow is $278 ($3k/yr) — positive.
- The deal already cash-flows at list — no discount required.
- Meets the 1% rule at list price ($1k rent vs $110k).
- Cap rate 9.3% vs local median 5.0% in St. Louis — top-decile yield for the area; either an underpriced asset or a hidden risk that comps aren't pricing in. Stress-test before assuming the spread holds.
Location & tenants
- Location reads: area grade C — affects rentability + tenant quality, not the cash-flow math above.
- St. Louis City (urban): math 10% / reading 18% proficiency, ranked #312 of 324 in MO (top 96%) — low school quality limits family demand, transient renter base, plan for 1-2y turnover; 80% free/reduced lunch — lower-income household profile, screen leases tightly.
- Zoned schools: Herzog Elem. (math 2% / reading 8%, grade F, #1,072 of 1,115 statewide, top 98%, 247 students, 99% FRL); Vashon High (math 2% / reading 2%, grade F, #520 of 521 statewide, top 100%, 568 students, 100% FRL) — zoned schools average 99% FRL vs 80% district-wide (19 pts higher); higher-poverty schools than district average — tighter screening recommended.
- Market conditions: 57 active listings in the ZIP; 40 comparable units currently listed for rent nearby; rentals at typical pace (median 24d on market — plan ~3-4 weeks tenant-placement turnaround); lower-income renter base — watch delinquency; 294 units permitted in St. Louis city in 2024 (227 in 5+ unit buildings).
- This rent runs 35% of the median local income ($41k/yr) — at the standard rent-burdened threshold; future hikes will face affordability resistance.
Forward outlook
- Local home prices are declining (-3.0%/yr); year-one equity from $761 of loan paydown is wiped out by about $3k of value loss. Plan a longer hold.
- St. Louis County population projected to shrink 6% by 2050 — rents likely to lag national; underwrite the cash flow, not the appreciation.
Negotiation context
- Only 6 days on market — expect competitive offers; lowballing is unlikely to land.
Risks & watch-outs
- Watch-outs: built in 1939 — expect roof / HVAC / electrical / plumbing capex.
- Climate carrying-cost: extreme-heat days projected 7→22/yr by 2055 (HVAC capex compounding) — expect insurance premiums to compound above CPI over the hold.
Questions for the listing agent
- Built in 1939 — when were the roof, HVAC, electrical panel, plumbing, and water heater last replaced?
- Is there a deadline driving the sale (1031 exchange, divorce, estate, relocation)? That informs how much negotiation room exists.
- What's the average days-on-market for RENTAL listings here right now (not sales)? A rising rental-DOM trend means longer vacancies and softer asking-rent achievability than the comps imply.
- What's the recent tenant-quality profile in this submarket — average credit score on applications, eviction rate, late-payment / NSF rate, and stable-employment percentage? A property-management company in the area should have these aggregated.
- How much new for-sale + rental construction is in the pipeline within 1–3 miles? Heavy new supply typically softens prices + rents 12–24 months out; constrained supply supports both.
Investment metrics
- 1% rule
- 1.08% ✓
- Cap rate
- 9.33%
- Cash-on-cash
- 10.84%
- DSCR
- 1.48
- GRM
- 7.7
CMA / ARV
- ARV (on-the-fly)
- $54,912
- Comps found
- 12
Show comp detail 12 sales within ~0.75 mi
| Address | Dist | Beds/Ba | Sqft | Sold | Price | $/sf | Match |
|---|---|---|---|---|---|---|---|
| 5916 Alpha Ave | 0.06mi | 2/1.0 (-1) | 936 (+9%) | 3mo | $74,900 | $80 | 75 |
| 5653 Park Ln | 0.32mi | 2/1.0 (-1) | 880 (+3%) | 7mo | $35,900 | $41 | 70 |
| 5811 Helen Ave | 0.61mi | 3/1.0 | 806 (-6%) | 0mo | $29,900 | $37 | 61 |
| 1934 Damato Ct | 0.46mi | 2/1.0 (-1) | 900 (+5%) | 6mo | $25,000 | $28 | 60 |
| 5712 Floy Ave | 0.36mi | 2/1.0 (-1) | 966 (+13%) | 1mo | $62,000 | $64 | 57 |
| 1900 Hildred Ave | 0.61mi | 2/1.0 (-1) | 825 (-4%) | 6mo | $25,000 | $30 | 55 |
| 1965 Park Ln | 0.73mi | 2/1.0 (-1) | 825 (-4%) | 3mo | $65,000 | $79 | 52 |
| 1940 Park Ln | 0.71mi | 2/1.0 (-1) | 830 (-3%) | 6mo | $61,000 | $73 | 52 |
| 8926 Hillview Ave | 0.68mi | 2/1.0 (-1) | 920 (+7%) | 3mo | $38,700 | $42 | 49 |
| 5515 Hodiamont Ave | 0.73mi | 2/1.0 (-1) | 818 (-5%) | 8mo | $60,000 | $73 | 47 |
| 5820 Helen Ave | 0.59mi | 2/1.0 (-1) | 936 (+9%) | 6mo | $52,500 | $56 | 47 |
| 1719 Veronica Ave | 0.49mi | 2/1.0 (-1) | 984 (+15%) | 2mo | $94,500 | $96 | 46 |
Match score weights: distance 35% · size 25% · config 20% · recency 20%. Top-matched comps best support the ARV.
Projected returns pro-forma
-3.0% appreciation · 3.0% rent growth · sell at horizon
- IRR
- -0.1%
- Equity multiple
- 1.00×
- Total profit
- $-147
- Equity at exit
- $16,401
- IRR
- 9.5%
- Equity multiple
- 1.73×
- Total profit
- $22,511
- Equity at exit
- $9,511
Cash invested: $30,800 (down + closing). Projections, not guarantees.
Landlord ↔ Tenant lean methodology
- Overall (STATE)
- 81 Strongly Landlord-Friendly
- State Missouri
- 81 Strongly Landlord-Friendly · R+10
- County
- — inherits STATE
- City
- — inherits STATE
ZIP-level market 63147
- Home prices YoY
- -31.4%
- Active inventory
- 57
- Price-to-rent
- 7.7×
Monthly cashflow live
- Estimated rent
- $1,185 high interval (Pro) →
- Mortgage (P&I)
- −$577
- Tax from tax record
- −$35 /mo · $422/yr
- Insurance
- −$46
- HOA
- −$0
- Vacancy / Maint / Mgmt
- −$249
- Net cashflow
- $278
Break-even live
UW: 25.0% down · 7.5% · 30yr · 1.5% tax · 5.0% vac · 8.0% maint · 8.0% mgmt
Financing live
Cash to close
- Down payment
- $27,500
- Closing costs
- $3,300
- Reserves months
- —
- Total cash needed
- —
Loan-product check · same deal, 3 products live
Conventional
25% down · 7.5% · 30yr
- Down + closing
- —
- Monthly P&I
- —
- Monthly cashflow
- —
- DSCR
- —
- Eligible?
- —
Personal DTI + credit; lowest rate.
DSCR
20% down · 8.5% · 30yr
- Down + closing
- —
- Monthly P&I
- —
- Monthly cashflow
- —
- DSCR
- —
- Eligible?
- —
No personal income docs; deal must DSCR.
Hard money
10% down · 12.0% · 12mo
- Down + closing
- —
- Monthly P&I
- —
- Monthly cashflow
- —
- DSCR
- —
- Eligible?
- —
Short-term bridge; refi at stabilization.
Rent comps 40 comps
| Address | Beds | Baths | Sqft | Rent | $/sqft | DOM | Units | Dist |
|---|---|---|---|---|---|---|---|---|
| 5932 Floy Ave Saint Louis, MO | 3.0 | 1.0 | 1080 | $1,373 | $1.27 | 20d | 1 | 0.17mi |
| 5955 Floy Ave Saint Louis, MO | 2.0 | 1.0 | 1032 | $1,050 | $1.02 | 2d | 1 | 0.20mi |
| 8548 Drury Ln Saint Louis, MO | 3.0 | 2.0 | 1107 | $1,420 | $1.28 | 43d | 1 | 0.25mi |
| 5756 Floy Ave Saint Louis, MO | 2.0 | 1.0 | 1080 | $995 | $0.92 | 43d | 1 | 0.28mi |
| 5741 Floy Ave Saint Louis, MO | 2.0 | 1.0 | 1000 | $1,100 | $1.10 | 23d | 1 | 0.32mi |
| 5721 Floy Ave Saint Louis, MO | 2.0 | 1.0 | 1032 | $1,120 | $1.09 | 23d | 1 | 0.35mi |
| 5574 Era Ave Saint Louis, MO | 3.0 | 1.0 | 850 | $1,400 | $1.65 | 11d | 1 | 0.40mi |
| 5654 Acme Ave Saint Louis, MO | 2.0 | 1.0 | 968 | $325 | $0.34 | 21d | 1 | 0.42mi |
| 5546 Floy Ave Saint Louis, MO | 2.0 | 2.0 | 850 | $1,273 | $1.50 | 20d | 1 | 0.45mi |
| 1942 Damato Ct Saint Louis, MO | 2.0 | 1.0 | 905 | $1,100 | $1.22 | 43d | 1 | 0.46mi |
| 8502 Dianthus Ln Saint Louis, MO | 2.0 | 1.0 | 1072 | $1,175 | $1.10 | 23d | 1 | 0.51mi |
| 8527 Dianthus Ln Saint Louis, MO | 3.0 | 1.0 | 976 | $1,295 | $1.33 | 43d | 1 | 0.55mi |
| 5931 Emma Ave Saint Louis, MO | 2.0 | 1.0 | 880 | $1,200 | $1.36 | 43d | 1 | 0.56mi |
| 5635 Hodiamont Ave Saint Louis, MO | 2.0 | 1.0 | 580 | $899 | $1.55 | 20d | 1 | 0.60mi |
| 5637 Jennings Station Rd Saint Louis, MO | 3.0 | 1.0 | 1116 | $895 | $0.80 | 43d | 1 | 0.77mi |
| 5439 Hodiamont Ave Saint Louis, MO | 2.0 | 1.0 | 770 | $950 | $1.23 | 17d | 1 | 0.82mi |
| 5936 Theodore Ave Saint Louis, MO | 3.0 | 2.0 | 1008 | $1,350 | $1.34 | 43d | 1 | 0.82mi |
| 2056 Coleridge Dr Saint Louis, MO | 3.0 | 1.0 | 949 | $1,195 | $1.26 | 23d | 1 | 0.82mi |
| 5415 Hamilton Ave Unit Labs Jennings, MO | 2.0 | 1.0 | 864 | $1,100 | $1.27 | 23d | 1 | 0.83mi |
| 8612 Halls Ferry Rd Saint Louis, MO | 1.0–2.0 | 1.0 | 625 | $775 | $1.24 | 4d | 2 | 0.84mi |
| 5361 Wilborn Dr Saint Louis, MO | 3.0 | 1.0 | 900 | $1,420 | $1.58 | 17d | 1 | 0.88mi |
| 8817 Shady Grove Ave Saint Louis, MO | 2.0 | 1.0 | 1085 | $1,075 | $0.99 | 23d | 1 | 0.89mi |
| 7142 Lamont Dr Saint Louis, MO | 2.0 | 1.0 | 750 | $1,100 | $1.47 | 17d | 1 | 0.93mi |
| 8344 Eton Pl Saint Louis, MO | 2.0 | 1.0 | 750 | $895 | $1.19 | 3d | 1 | 0.95mi |
| 6150 Sherry Ave Saint Louis, MO | 2.0 | 1.0 | 1032 | $896 | $0.87 | 23d | 1 | 0.96mi |
| 7030 Emma Ave Saint Louis, MO | 2.0 | 1.0 | 801 | $1,350 | $1.69 | 43d | 1 | 0.97mi |
| 8347 Eton Pl Saint Louis, MO | 2.0 | 1.0 | 750 | $1,075 | $1.43 | 43d | 1 | 0.98mi |
| 6153 Laura Ave Saint Louis, MO | 2.0 | 1.0 | 834 | $1,000 | $1.20 | 23d | 1 | 0.99mi |
| 5347 Janet Ave Saint Louis, MO | 4.0 | 1.0 | 893 | $1,350 | $1.51 | 16d | 1 | 1.00mi |
| 5615 Beldon Dr Saint Louis, MO | 2.0 | 1.0 | 850 | $950 | $1.12 | 43d | 1 | 1.02mi |
| 7205 Calvin Ave Saint Louis, MO | 3.0 | 1.0 | 832 | $750 | $0.90 | 43d | 1 | 1.03mi |
| 8720 Akins Dr Saint Louis, MO | 2.0 | 1.0 | 1012 | $1,150 | $1.14 | 23d | 1 | 1.04mi |
| 7024 Idlewild Ave Saint Louis, MO | 2.0 | 1.0 | 588 | $995 | $1.69 | 43d | 1 | 1.04mi |
| 2415 Shirley Ave Saint Louis, MO | 3.0 | 1.0 | 990 | $1,450 | $1.46 | 23d | 1 | 1.04mi |
| 2427 Switzer Ave Saint Louis, MO | 3.0 | 1.0 | 1008 | $1,300 | $1.29 | 43d | 1 | 1.06mi |
| 5516 Fairridge Ct Saint Louis, MO | 2.0 | 1.0 | 1110 | $995 | $0.90 | 23d | 1 | 1.07mi |
| 7036 Garesche Ave Saint Louis, MO | 2.0 | 1.0 | 864 | $950 | $1.10 | 17d | 1 | 1.11mi |
| 7218 Albright Ave Saint Louis, MO | 2.0 | 1.0 | 1100 | $980 | $0.89 | 23d | 1 | 1.15mi |
| 7131 Garesche Ave Saint Louis, MO | 2.0 | 1.0 | 918 | $1,090 | $1.19 | 3d | 1 | 1.16mi |
| 2527 Switzer Ave Saint Louis, MO | 3.0 | 1.0 | 888 | $1,135 | $1.28 | 16d | 1 | 1.17mi |
Listing history 9 events
-
2026-06-18days on market $110,000 Active 6 DOM
-
2026-06-17days on market $110,000 Active 5 DOM
-
2026-06-16days on market $110,000 Active 4 DOM
-
2026-06-15days on market $110,000 Active 3 DOM
-
2026-06-13pricestatusdays on market $110,000 Active 1 DOM
-
2026-06-09days on market $128,600 Coming Soon 5 DOM
-
2026-06-08days on market $128,600 Coming Soon 4 DOM
-
2026-06-07days on market $128,600 Coming Soon 3 DOM
-
2026-06-05$128,600 Coming Soon 1 DOM
ⓘ Source: listings_history table (triggers on properties + properties_extension) + one-shot
backfill from property_details.listing_events for pre-trigger history.
Tax reassessment forecast MO · Resets to sale price
- Current annual tax
- $422 · $35/mo
- Projected year-2 tax
- $1,067 · $89/mo
- Expected delta
- +$645/yr (+$54/mo · 152.7%)
ⓘ Screening estimate from a state-policy table — verify with the county assessor before closing.
Climate risk First Street
- Flood 1/10 Low FEMA zone X (unshaded) · 0% chance over 30 yrs
- Wildfire 1/10 Low
- Heat 5/10 Major 7 d/yr ≥107°F today · 22 d/yr by 30 yrs out
- Wind 2/10 Low 100% chance of damaging wind over 30 yrs
- Air quality 4/10 Moderate 5 unhealthy d/yr today · 6 by 30 yrs out
Nearby sold comps map
Loading sold comps map…
Walkable amenities ~0.75 mi
Loading nearby amenities…
Taxation est. · year 1
- Rental income
- $14,220
- − Mortgage interest
- −$6,162
- − Property taxes
- −$422
- − Insurance
- −$550
- − Repairs & maintenance
- −$1,138
- − Management
- −$1,138
- − Depreciation
- −$3,200
- Taxable income
- $1,611
- Est. tax owed @ 24.0%
- −$387
- After-tax cash flow
- $2,953/yr
For passive investors: Depreciation is non-cash, so a rental often shows a tax loss while cash-flowing — sheltering income. Rental losses are passive: they offset passive income freely, and up to $25,000/yr can offset ordinary (W-2) income if you actively participate and your MAGI is under $100k (phasing out to $0 by $150k); unused losses carry forward. On sale, claimed depreciation is recaptured at up to 25%, and gains may owe capital-gains tax (a 1031 exchange can defer both). Figures are a year-1 estimate at your 24.0% rate — not tax advice; consult a CPA.
Schools (NCES district)
- District
- St. Louis City
- NCES district ID
- 2929280
- Math proficiency
- 10% ▼ -6.00%
- Reading proficiency
- 18% ▼ -3.00%
- Median HH income
- $35,685
- Composite
- 11.54/100
- National rank
- #9699
- State rank
- #312 of 324 in MO
Livability — St. Louis
No livability data for this city. (Only ~50 U.S. cities are tracked.)
Census & demographics
- Census place
- St. Louis, MO
- County
- Saint Louis City · 254,015 people
- City population
- 283,259
- Metro
- St. Louis, MO-IL
- Population (ZIP)
- 8,173
- Household income
- $41,182
- Rent vs Own
- Severe rent burden
- 418.0
Population outlook (St. Louis County) Hauer SSP2
- Today (2025)
- 315,737 people
- By 2030
- 313,865 · -0.6%
- By 2040
- 305,439 · -3.3%
- By 2050
- 296,529 · -6.1%
- By 2075
- 271,028 · -14.2%
- By 2100
- 255,359 · -19.1%
Race, ethnicity, and origin ACS 2023
- Neighborhood character
- Predominantly Black (92%)
- Race & ethnicity
- Black 92% White 5% Two or more races 2%
- Foreign-born
- 0%
- Languages at home
- 99% English-only · Spanish 1%
Political lean MEDSL · St. Louis
- 2024 margin
- Solid D (+64.7) · D 81.4% · R 16.7% · Other 2.0%
- 2008→2024 swing
- -3.5pp toward R · 2008: 68.2pp · 2024: 64.7pp
- All cycles
- 2024: D+64.7 2020: D+66.2 2016: D+63.7 2012: D+66.6 2008: D+68.2
Not yet ingested
- Civics
- —
Market trends
- HPI YoY
- ▼ -38.51%
- Current HPI
- 84.224
- Rent YoY
- —
- Metro
- St. Louis, MO-IL
- State GDP YoY
- ▲ 1.84%
- F500 in state
- 20
Industry mix (Fortune 500 HQ in MO)
| Industry | F500 HQs | Revenue |
|---|---|---|
| Healthcare | 1 | $163B |
|
||
| Insurance | 1 | $21B |
|
||
| Industrial Technology | 1 | $17B |
|
||
| Retail | 1 | $16B |
|
||
| Industrial Distribution | 1 | $10B |
|
||
| Utilities | 1 | $9B |
|
||
Price history
+262.0% since first listed12 events — show timeline
- 2026-06-04 Coming Soon $128,600 MARIS as Distributed by MLS Grid
- 2023-11-13 Sold (Public Records) $126,500 Public Records
- 2023-11-09 Sold (MLS) — MARIS as Distributed by MLS Grid
- 2023-10-12 Pending — MARIS as Distributed by MLS Grid
- 2023-09-11 Price Changed $128,500 MARIS as Distributed by MLS Grid
- 2023-08-03 Price Changed $134,900 MARIS as Distributed by MLS Grid
- 2023-08-03 Listed $129,900 MARIS as Distributed by MLS Grid
- 1999-05-19 Sold (Public Records) $72,000 Public Records
- 1998-11-03 Sold (Public Records) — Public Records
- 1998-04-03 Sold (Public Records) $32,000 Public Records
- 1997-02-11 Sold (Public Records) — Public Records
- 1994-08-05 Sold (Public Records) $35,524 Public Records
Property tax history
-3.4%/yrLatest (2024): $422 · +4.8% YoY. Source: county tax records.
Cash-flow waterfall
monthlySold comps — $/sqft
last 12 mo · ≤1 miLoading sold comps…