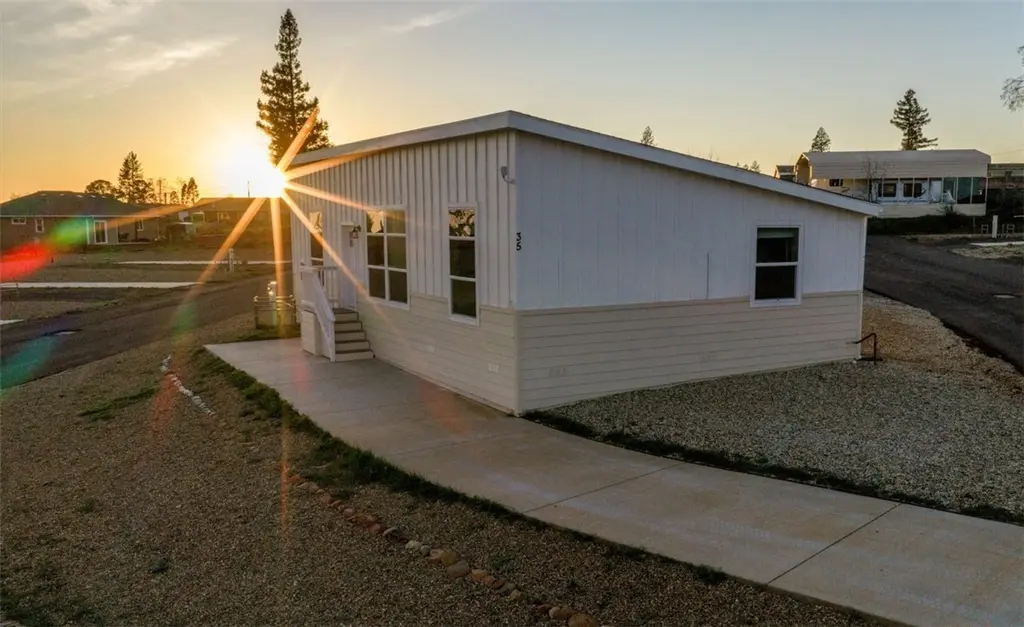
5393 Sawmill #35 · Paradise, CA
Flood risk 1/10 · Minimal
- FEMA flood zone
- X (unshaded)
- Chance of flooding over 30 yrs
- 0.0%
- Est. flood insurance / yr
- $507 – $1,088
Fire risk 7/10 · Major
- Est. fire insurance / yr
- $659 – $1,223
Heat risk 6/10 · Moderate
- Hot days now (above 100°F)
- 7 days/yr
- Hot days in 30 yrs
- 18 days/yr
Wind risk 1/10 · Minimal
- Chance of severe wind over 30 yrs
- —
Air-quality risk 10/10 · Severe
- Unhealthy air days now
- 37 days/yr
- Unhealthy air days in 30 yrs
- 40 days/yr
Risk factors via First Street. Map © Google.
Why this score? — see what drove the D- grade
The composite is a weighted blend of 9 inputs, each scored 0–100. Each bar is that input's sub-score; the figure is the points it added to the 100-point composite (weight × sub-score).
- ARV discount +15.0/15.0
- Schools +5.0/10.0
- 1% rule +4.2/10.0
- Rent growth +4.1/5.0
- Livability +3.1/5.0
- Condition / age +2.5/5.0
- Cash flow +1.3/30.0
- DSCR +0.0/10.0
- Appreciation +0.0/10.0
$139,000
🖨 Deal sheet (PDF) 📄 Offer letter ✓ Due diligence
Listing remarks
Opportunities like this don’t last—schedule your showing today and take advantage of the two months of free rent while it’s available! Move-In Ready 3-Bedroom Home with Views & Community Perks. Enjoy a tremendous in-town setting with this brand-new, move-in ready 3 bedroom, 2 bath home tucked away at the back of the park for added privacy, peace, and quiet. The location offers lovely views of the Sutter Buttes, creating a serene backdrop to everyday living. This welcoming community enhances your lifestyle with two months of free rent, space rent that includes high-speed internet, and thoughtfully designed amenities that encourage connection and comfort. Residents en
Key facts
- Serene backdrop
- Move in ready
- Horseshoe pit
Tags
Property features AI
Finance
- Other: Lot features: 0-1 unit/acre; Lot size source: Assessor's data; Living area source: Seller; Directions: E. on Pearson, S on Sawmill towards the end of the road; Latitude/Longitude: 39.74372, -121.589729
- Financial info: Rent includes sewer
- HOA & community: Part of Idlewild association; Association fee $600 monthly; Park: Idlewild Estates; Community features: Foothills; Land lease $600 monthly (seller source); land lease applies; manager approval required
Exterior
- Parking: Concrete driveway
- Security: Carbon monoxide detector(s); Smoke detector
- Utilities: Electricity on property; Septic tank; Water connected (see remarks)
- Home design: Single-story; Mobile home model: Stone Harbor; Mobile home remains on site; Entry level: 1; Has a view; Private paved road frontage
- Construction: Concrete and drywall construction; Year built: estimated; Mobile width 27 ft, length 45 ft
- Exterior features: Concrete construction; Drywall walls; No pool
Interior
- Kitchen: Microwave; Gas range; Kitchen open to family room
- Bedrooms: Primary bedroom (primary suite present)
- Flooring: Vinyl; Carpet
- Bathrooms: 2 full bathrooms; Shower
- Heating & cooling: Central furnace; Central cooling
- Interior features: Open floor plan; Carbon monoxide detector(s); Smoke detector; Double pane windows; Blinds; No interior steps
- Laundry & utility: Inside laundry; Washer hookup; Electric dryer hookup
Neighborhood map
What this means for you Summary
Snapshot
- This is a 2-bed/2.0-bath manufactured listed at $139k.
Deal economics
- At list price, monthly cash flow is $-555 ($-7k/yr) — negative.
- To cash-flow at today's rent, offer at most $59k (57.7% below list).
- To meet the 1% rule (rent ≥ 1% of price), the offer needs to be $127k (8.4% below list).
- Recommended offer: $59k (57.7% below list) — sets the bar for cash-flow.
- Cap rate 1.5% vs local median 2.6% in Paradise — below-typical yield; the buyer is paying a premium for something (appreciation thesis, condition, location) that the cap rate doesn't capture.
Location & tenants
- Location reads 61/100 on livability (#541 in CA) — a middle-class / working-renter tenant base. Strengths: housing B+, crime B; Watch: employment C-, amenities F, commute F.
- Zoned schools: Paradise Junior High (164 students, 70% FRL); Paradise Senior High (math 27% / reading 52%, grade F, #532 of 1,170 statewide, top 48%, 476 students, 50% FRL).
- Market conditions: Rents rising fast (+6.4%/yr); 488 active listings in the ZIP; 5 comparable units currently listed for rent nearby; rentals at typical pace (median 24d on market — plan ~3-4 weeks tenant-placement turnaround); 40% of comp listings sitting > 30 days — soft ceiling on asking rent; 946 units permitted in Butte County in 2024 (254 in 5+ unit buildings).
Forward outlook
- Local home prices are declining (-3.0%/yr); year-one equity from $961 of loan paydown is wiped out by about $4k of value loss. Plan a longer hold.
- Butte County population projected at +10% by 2050 — modest demand growth; plan on rents tracking national, not racing it.
Negotiation context
- It's been on market 58 days — a 3% lower offer ($135k) is reasonable based on typical stale-listing flexibility.
- 3 sale attempts since 21y ago with the ask held roughly flat each time — persistent listings suggest the price (not the market) is what's stuck; bring a comps-based counter.
Risks & watch-outs
- Watch-outs: HOA is 47% of rent.
- Climate carrying-cost: major wildfire risk; extreme-heat days projected 7→18/yr by 2055 (HVAC capex compounding) — expect insurance premiums to compound above CPI over the hold.
Questions for the listing agent
- What do current leases actually rent for vs. the listed asking? Can we see a recent rent roll and the last 12 months of T-12 income?
- It's been on market 58 days. Have you received any prior offers? Is the seller open to a 58% concession, seller financing, or rate buy-down credit?
- What does the HOA fee cover, when was the last increase, and are there any pending special assessments or reserve-fund shortfalls?
- Is there a deadline driving the sale (1031 exchange, divorce, estate, relocation)? That informs how much negotiation room exists.
- Schools are A-rated — typically a magnet for longer-tenancy family renters. What's the average tenant stay here, and is there a school-zone premium baked into asking?
- The area grade is low — what's the realistic commute time and amenity access for the typical tenant pool here? Any planned neighborhood developments (good or bad) we should know about?
- What's the average days-on-market for RENTAL listings here right now (not sales)? A rising rental-DOM trend means longer vacancies and softer asking-rent achievability than the comps imply.
- What's the recent tenant-quality profile in this submarket — average credit score on applications, eviction rate, late-payment / NSF rate, and stable-employment percentage? A property-management company in the area should have these aggregated.
- How much new for-sale + rental construction is in the pipeline within 1–3 miles? Heavy new supply typically softens prices + rents 12–24 months out; constrained supply supports both.
Investment metrics
- 1% rule
- 0.92% ✗
- Cap rate
- 1.51%
- Cash-on-cash
- -17.10%
- DSCR
- 0.24
- GRM
- 9.1
CMA / ARV
- ARV (median comp)
- $267,000
- List price
- $139,000
- Delta
- -47.94%
- Verdict
- UNDERPRICED
- Comps
- 11 within 1.0 mi
Show comp detail 4 sales within ~0.75 mi
| Address | Dist | Beds/Ba | Sqft | Sold | Price | $/sf | Match |
|---|---|---|---|---|---|---|---|
| 1446 Toni Dr | 0.18mi | 3/2.0 (+1) | 1,512 (+5%) | 11mo | $315,000 | $208 | 69 |
| 5352 Sawmill Rd | 0.12mi | 3/2.0 (+1) | 1,280 (-11%) | 3mo | $282,000 | $220 | 68 |
| 5195 Bennett Rd | 0.59mi | 3/2.0 (+1) | 1,248 (-13%) | 1mo | $300,000 | $240 | 45 |
| 5587 Bieberdorf Ln | 0.53mi | 2/2.0 | 1,280 (-11%) | 22mo | $271,600 | $212 | 38 |
Match score weights: distance 35% · size 25% · config 20% · recency 20%. Top-matched comps best support the ARV.
Projected returns pro-forma
-3.0% appreciation · 6.37% rent growth · sell at horizon
- IRR
- -42.0%
- Equity multiple
- -0.36×
- Total profit
- $-52,991
- Equity at exit
- $20,725
- IRR
- -33.1%
- Equity multiple
- -0.81×
- Total profit
- $-70,414
- Equity at exit
- $12,018
Cash invested: $38,920 (down + closing). Projections, not guarantees.
Landlord ↔ Tenant lean methodology
- Overall (STATE)
- 18 Strongly Tenant-Friendly
- State California
- 18 Strongly Tenant-Friendly · D+13
- County
- — inherits STATE
- City
- — inherits STATE
ZIP-level market 95969
- Rents YoY
- 6.4%
- Active inventory
- 488
- Price-to-rent
- 9.1×
Monthly cashflow live
- Estimated rent
- $1,273 high interval (Pro) →
- Mortgage (P&I)
- −$729
- Tax est. 1.5%
- −$174 /mo · $2,085/yr
- Insurance
- −$58
- HOA
- −$600
- Lot rent leased land?
- −$0
- Vacancy / Maint / Mgmt
- −$267
- Net cashflow
- $-555
Break-even live
Sensitivity live
| Price | -10% $-458 | -5% $-507 | +0% $-555 | +5% $-603 | +10% $-651 |
|---|---|---|---|---|---|
| Rent | -10% $-655 | -5% $-605 | +0% $-555 | +5% $-504 | +10% $-454 |
| Rate | -1.0pp $-485 | -0.5pp $-519 | base $-555 | +0.5pp $-591 | +1.0pp $-627 |
UW: 25.0% down · 7.5% · 30yr · 1.5% tax · 5.0% vac · 8.0% maint · 8.0% mgmt
Financing live
Cash to close
- Down payment
- $34,750
- Closing costs
- $4,170
- Reserves months
- —
- Total cash needed
- —
Loan-product check · same deal, 3 products live
Conventional
25% down · 7.5% · 30yr
- Down + closing
- —
- Monthly P&I
- —
- Monthly cashflow
- —
- DSCR
- —
- Eligible?
- —
Personal DTI + credit; lowest rate.
DSCR
20% down · 8.5% · 30yr
- Down + closing
- —
- Monthly P&I
- —
- Monthly cashflow
- —
- DSCR
- —
- Eligible?
- —
No personal income docs; deal must DSCR.
Hard money
10% down · 12.0% · 12mo
- Down + closing
- —
- Monthly P&I
- —
- Monthly cashflow
- —
- DSCR
- —
- Eligible?
- —
Short-term bridge; refi at stabilization.
Rent comps 5 comps
| Address | Beds | Baths | Sqft | Rent | $/sqft | DOM | Units | Dist |
|---|---|---|---|---|---|---|---|---|
| 1822 Arrowhead Dr Paradise, CA | 3.0 | 2.0 | 1576 | $1,825 | $1.16 | 15d | 1 | 0.75mi |
| 5589 Linrich Ln Paradise, CA | 2.0 | 2.0 | 1275 | $1,995 | $1.56 | 46d | 1 | 1.25mi |
| 5995 N Libby Rd Paradise, CA | 3.0 | 2.0 | 1749 | $2,300 | $1.32 | 46d | 1 | 1.38mi |
| 1561 Kay Ct Paradise, CA | 2.0 | 1.0 | 892 | $898 | $1.01 | 15d | 1 | 1.44mi |
| 1561 Kay Ct Unit D Paradise, CA | 2.0 | 1.0 | 892 | $898 | $1.01 | 23d | 1 | 1.45mi |
HOA detail
- Monthly dues
- $600 · $7,200/yr
- Likely covers
- internet
Listing history 23 events
-
2026-06-21days on market $139,000 Active 58 DOM
-
2026-06-19days on market $139,000 Active 56 DOM
-
2026-06-18days on market $139,000 Active 55 DOM
-
2026-06-17days on market $139,000 Active 54 DOM
-
2026-06-16days on market $139,000 Active 53 DOM
-
2026-06-15days on market $139,000 Active 52 DOM
-
2026-06-14days on market $139,000 Active 50 DOM
-
2026-06-13days on market $139,000 Active 49 DOM
-
2026-06-10days on market $139,000 Active 47 DOM
-
2026-06-09days on market $139,000 Active 46 DOM
-
2026-06-08days on market $139,000 Active 45 DOM
-
2026-06-07days on market $139,000 Active 44 DOM
-
2026-06-05pricedays on market $139,000 Active 41 DOM
-
2026-06-03days on market $145,000 Active 40 DOM
-
2026-06-02days on market $145,000 Active 39 DOM
-
2026-06-01days on market $145,000 Active 38 DOM
-
2026-05-31days on market $145,000 Active 37 DOM
-
2026-05-30days on market $145,000 Active 36 DOM
-
2026-04-24$145,000 Active 1252-char remark
-
2013-10-03historical
-
2013-07-11$15,000 Active
-
2005-11-08historical
-
2005-06-24$31,500
ⓘ Source: listings_history table (triggers on properties + properties_extension) + one-shot
backfill from property_details.listing_events for pre-trigger history.
Climate risk First Street
- Flood 1/10 Low FEMA zone X (unshaded) · 0% chance over 30 yrs
- Wildfire 7/10 Severe
- Heat 6/10 Major 7 d/yr ≥100°F today · 18 d/yr by 30 yrs out
- Wind 1/10 Low
- Air quality 10/10 Extreme 37 unhealthy d/yr today · 40 by 30 yrs out
Nearby sold comps map
Loading sold comps map…
Walkable amenities ~0.75 mi
Loading nearby amenities…
Taxation est. · year 1
- Rental income
- $15,282
- − Mortgage interest
- −$7,786
- − Property taxes
- −$2,085
- − Insurance
- −$695
- − Repairs & maintenance
- −$1,223
- − Management
- −$1,223
- − HOA
- −$7,200
- − Depreciation
- −$4,044
- Taxable loss
- −$8,973
- Est. tax savings @ 24.0%
- +$2,154
- After-tax cash flow
- $-4,501/yr
For passive investors: Depreciation is non-cash, so a rental often shows a tax loss while cash-flowing — sheltering income. Rental losses are passive: they offset passive income freely, and up to $25,000/yr can offset ordinary (W-2) income if you actively participate and your MAGI is under $100k (phasing out to $0 by $150k); unused losses carry forward. On sale, claimed depreciation is recaptured at up to 25%, and gains may owe capital-gains tax (a 1031 exchange can defer both). Figures are a year-1 estimate at your 24.0% rate — not tax advice; consult a CPA.
Schools (NCES district)
No district data.
Livability — Paradise
- Score
- 61/100
- State rank
- #541
- US rank
- #18039
Category grades
Schools grade is shown separately in the Schools card above.
Census & demographics
- Census place
- Paradise, CA
- County
- Butte County · 175,030 people
- City population
- 8,339
- Metro
- Chico, CA
- Population (ZIP)
- 8,339
- Household income
- $69,067
- Rent vs Own
- Severe rent burden
- 218.0
Population outlook (Butte County) Hauer SSP2
- Today (2025)
- 237,527 people
- By 2030
- 243,804 · +2.6%
- By 2040
- 253,899 · +6.9%
- By 2050
- 262,561 · +10.5%
- By 2075
- 283,709 · +19.4%
- By 2100
- 282,689 · +19.0%
Race, ethnicity, and origin ACS 2023
- Neighborhood character
- Predominantly White (82%)
- Race & ethnicity
- White 82% Two or more races 11% Hispanic / Latino 8% Asian 2% Native American 1%
- Hispanic origin (detail)
- Mexican 7%
- Common ancestry
- Iranian 7% Lithuanian 4% Italian 2%
- Foreign-born
- 3% · Canada, China
- Languages at home
- 94% English-only · Spanish 4% Chinese 1%
Political lean MEDSL · Butte
- 2024 margin
- Toss-up / Even · D 46.8% · R 49.9% · Other 3.3%
- 2008→2024 swing
- -5.5pp toward R · 2008: 2.4pp · 2024: -3.1pp
- All cycles
- 2024: R+3.1 2020: D+1.7 2016: R+4.0 2012: R+3.9 2008: D+2.4
Not yet ingested
- Civics
- —
Market trends
- HPI YoY
- ▼ -410.40%
- Current HPI
- 102.8367
- Rent YoY
- ▲ 6.37%
- Metro
- Chico, CA
- State GDP YoY
- ▲ 3.21%
- F500 in state
- 116
Industry mix (Fortune 500 HQ in CA)
| Industry | F500 HQs | Revenue |
|---|---|---|
| Technology | 27 | $1,492B |
|
||
| Financial Services | 3 | $174B |
|
||
| Retail | 3 | $44B |
|
||
| Insurance | 3 | $26B |
|
||
| Media / Entertainment | 2 | $115B |
|
||
| Pharmaceuticals / Biotech | 2 | $62B |
|
||
Price history
+341.3% since first listed6 events — show timeline
- 2026-06-04 Price Changed $139,000 CRMLS
- 2026-04-24 Listed $145,000 CRMLS
- 2013-10-03 Listing Removed — CRMLS
- 2013-07-11 Listed $15,000 CRMLS
- 2005-11-08 Listing Removed — CRMLS
- 2005-06-24 Listed $31,500 CRMLS
Property tax history
-7.2%/yrLatest (2018): $52 · -0.5% YoY. Source: county tax records.
Cash-flow waterfall
monthlySold comps — $/sqft
last 12 mo · ≤1 miLoading sold comps…