153 Windchime Ln · Orangeburg, SC
Flood risk 1/10 · Minimal
- FEMA flood zone
- X (unshaded)
- Chance of flooding over 30 yrs
- 0.0%
- Est. flood insurance / yr
- $507 – $1,088
Fire risk 6/10 · Moderate
- Est. fire insurance / yr
- $783 – $1,453
Heat risk 7/10 · Major
- Hot days now (above 108°F)
- 7 days/yr
- Hot days in 30 yrs
- 16 days/yr
Wind risk 8/10 · Major
- Chance of severe wind over 30 yrs
- 80.0%
Air-quality risk 3/10 · Minor
- Unhealthy air days now
- 3 days/yr
- Unhealthy air days in 30 yrs
- 3 days/yr
Risk factors via First Street. Map © Google.
Why this score? — see what drove the D grade
The composite is a weighted blend of 9 inputs, each scored 0–100. Each bar is that input's sub-score; the figure is the points it added to the 100-point composite (weight × sub-score).
- Cash flow +13.8/30.0
- ARV discount +7.5/15.0
- Schools +5.0/10.0
- DSCR +4.2/10.0
- 1% rule +3.7/10.0
- Livability +2.7/5.0
- Rent growth +2.5/5.0
- Condition / age +2.5/5.0
- Appreciation +0.0/10.0
$175,000
🖨 Deal sheet (PDF) 📄 Offer letter ✓ Due diligence
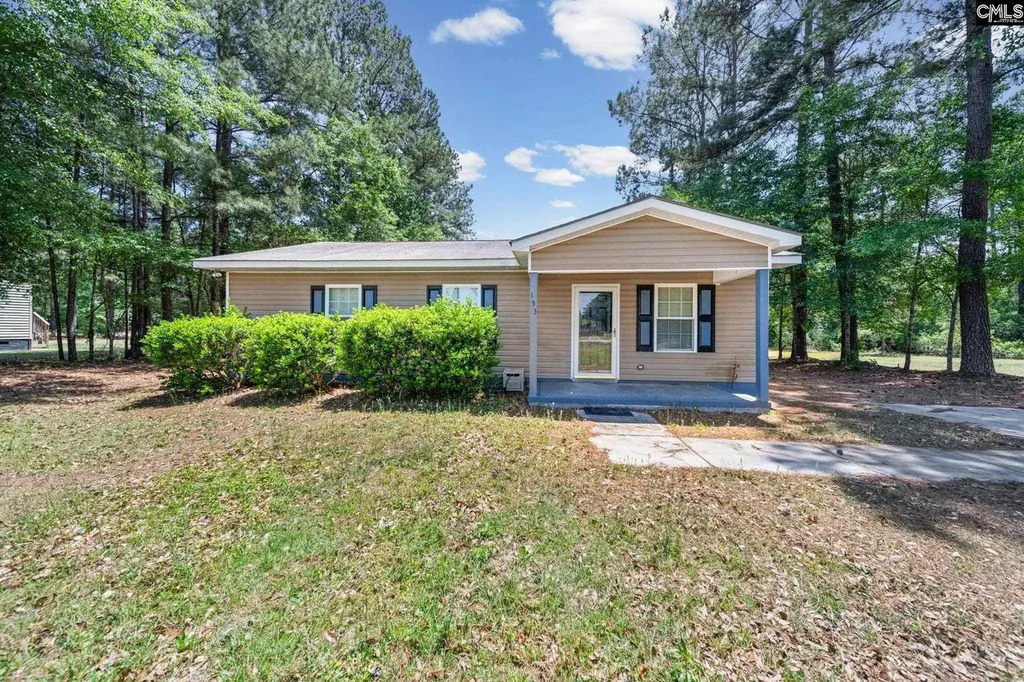
Listing remarks
Welcome to this charming ranch-style home situated on a spacious . 59-acre lot in a quiet Orangeburg neighborhood! Built in 2012, this 3-bedroom, 2-bath home offers comfortable one-level living with an inviting layout filled with natural light. The eat-in kitchen provides ample cabinet and counter space, while the adjoining living area creates a warm and functional space for everyday living and entertaining. The owner’s suite features a private bath and walk-in closet, with two additional bedrooms offering flexibility for guests, family, or a home office. Enjoy the large yard with plenty of room for outdoor activities, gardening, or future additions. Conveniently located near schools,
Key facts
- Private bath
- Walk-in closet
- Large yard
Tags
Property features AI
Exterior
- Utilities: Public water; Public sewer
- Home design: Single-story home; Vinyl exterior
- Construction: Slab foundation
- Exterior features: Yard shed; Paved road access
Interior
- Kitchen: Eat-in kitchen; Built-in microwave; Built-in self-cleaning range
- Bedrooms: Master bedroom on main level with private bath and carpeted floors; Bedroom 2 on main level with carpeted floors; Bedroom 3 on main level with carpeted floors
- Flooring: Carpet in living room and bedrooms
- Bathrooms: Two full bathrooms
- Heating & cooling: Central heating; Central air conditioning
- Interior features: Ceiling fans in living room and all bedrooms; Built-in microwave; Built-in, self-cleaning range; Eat-in kitchen
- Laundry & utility: Main-level utility room (laundry)
Neighborhood map
What this means for you Summary
Snapshot
- This is a 3-bed/1.0-bath single-family listed at $175k.
Deal economics
- At list price, monthly cash flow is $16 ($191/yr) — positive.
- The deal already cash-flows at list — no discount required.
- To meet the 1% rule (rent ≥ 1% of price), the offer needs to be $153k (12.7% below list).
- Recommended offer: $153k (12.7% below list) — sets the bar for 1% rule.
- Cap rate 6.4% vs local median 4.2% in Orangeburg — top-decile yield for the area; either an underpriced asset or a hidden risk that comps aren't pricing in. Stress-test before assuming the spread holds.
Location & tenants
- Location reads 54/100 on livability (#324 in SC) — a working-class tenant base; expect higher turnover. Strengths: cost of living A+, health & safety B; Watch: housing C-, crime F, amenities D-.
- Zoned schools: Sheridan Elementary (math 8%, 486 students, 100% FRL); Orangeburg Wilkinson High (math 22%, 1,073 students, 100% FRL).
- Market conditions: 164 active listings in the ZIP; 87 units permitted in Orangeburg County in 2024 (0 in 5+ unit buildings).
Forward outlook
- Local home prices are declining (-3.0%/yr); year-one equity from $1k of loan paydown is wiped out by about $5k of value loss. Plan a longer hold.
- Orangeburg County population projected at -27% by 2050 — secular population decline; favor cash flow + early exit over multi-decade hold.
Negotiation context
- It's been on market 36 days — a 3% lower offer ($170k) is reasonable based on typical stale-listing flexibility.
- 5 sale attempts since 7y ago with the ask held roughly flat each time — persistent listings suggest the price (not the market) is what's stuck; bring a comps-based counter.
Risks & watch-outs
- Climate carrying-cost: severe wind risk, 80% chance of damaging wind over 30y; major wildfire risk; extreme-heat days projected 7→16/yr by 2055 (HVAC capex compounding) — expect insurance premiums to compound above CPI over the hold.
Questions for the listing agent
- It's been on market 36 days. Have you received any prior offers? Is the seller open to a 13% concession, seller financing, or rate buy-down credit?
- Is there a deadline driving the sale (1031 exchange, divorce, estate, relocation)? That informs how much negotiation room exists.
- Schools are F-rated, which usually means shorter tenancies and higher turnover. Who's the typical renter profile here, and what's been the actual vacancy rate?
- Crime grade is F in this area — have there been break-ins, vandalism, or insurance claims at this property in the last 3 years? What carrier currently insures it and at what premium?
- The area grade is low — what's the realistic commute time and amenity access for the typical tenant pool here? Any planned neighborhood developments (good or bad) we should know about?
- What's the average days-on-market for RENTAL listings here right now (not sales)? A rising rental-DOM trend means longer vacancies and softer asking-rent achievability than the comps imply.
- What's the recent tenant-quality profile in this submarket — average credit score on applications, eviction rate, late-payment / NSF rate, and stable-employment percentage? A property-management company in the area should have these aggregated.
- How much new for-sale + rental construction is in the pipeline within 1–3 miles? Heavy new supply typically softens prices + rents 12–24 months out; constrained supply supports both.
Investment metrics
- 1% rule
- 0.87% ✗
- Cap rate
- 6.40%
- Cash-on-cash
- 0.39%
- DSCR
- 1.02
- GRM
- 9.5
CMA / ARV
No comps found within radius.
Projected returns pro-forma
-3.0% appreciation · 3.0% rent growth · sell at horizon
- IRR
- -15.7%
- Equity multiple
- 0.44×
- Total profit
- $-27,331
- Equity at exit
- $26,093
- IRR
- -7.2%
- Equity multiple
- 0.54×
- Total profit
- $-22,446
- Equity at exit
- $15,131
Cash invested: $49,000 (down + closing). Projections, not guarantees.
Landlord ↔ Tenant lean methodology
- Overall (STATE)
- 90 Strongly Landlord-Friendly
- State South Carolina
- 90 Strongly Landlord-Friendly · R+6
- County
- — inherits STATE
- City
- — inherits STATE
ZIP-level market 29118
- Home prices YoY
- -28.9%
- Active inventory
- 164
- Price-to-rent
- 9.5×
Monthly cashflow live
- Estimated rent
- $1,527 medium interval (Pro) →
- Mortgage (P&I)
- −$918
- Tax from tax record
- −$200 /mo · $2,398/yr
- Insurance
- −$73
- HOA
- −$0
- Vacancy / Maint / Mgmt
- −$321
- Net cashflow
- $16
Break-even live
Sensitivity live
| Price | -10% $115 | -5% $65 | +0% $16 | +5% $-34 | +10% $-83 |
|---|---|---|---|---|---|
| Rent | -10% $-105 | -5% $-44 | +0% $16 | +5% $76 | +10% $137 |
| Rate | -1.0pp $104 | -0.5pp $60 | base $16 | +0.5pp $-29 | +1.0pp $-76 |
UW: 25.0% down · 7.5% · 30yr · 1.5% tax · 5.0% vac · 8.0% maint · 8.0% mgmt
Financing live
Cash to close
- Down payment
- $43,750
- Closing costs
- $5,250
- Reserves months
- —
- Total cash needed
- —
Loan-product check · same deal, 3 products live
Conventional
25% down · 7.5% · 30yr
- Down + closing
- —
- Monthly P&I
- —
- Monthly cashflow
- —
- DSCR
- —
- Eligible?
- —
Personal DTI + credit; lowest rate.
DSCR
20% down · 8.5% · 30yr
- Down + closing
- —
- Monthly P&I
- —
- Monthly cashflow
- —
- DSCR
- —
- Eligible?
- —
No personal income docs; deal must DSCR.
Hard money
10% down · 12.0% · 12mo
- Down + closing
- —
- Monthly P&I
- —
- Monthly cashflow
- —
- DSCR
- —
- Eligible?
- —
Short-term bridge; refi at stabilization.
Listing history 27 events
-
2026-06-22days on market $175,000 Active 36 DOM
-
2026-06-19days on market $175,000 Active 33 DOM
-
2026-06-18days on market $175,000 Active 32 DOM
-
2026-06-17days on market $175,000 Active 31 DOM
-
2026-06-16days on market $175,000 Active 30 DOM
-
2026-06-15days on market $175,000 Active 29 DOM
-
2026-06-14days on market $175,000 Active 27 DOM
-
2026-06-12days on market $175,000 Active 26 DOM
-
2026-06-09days on market $175,000 Active 23 DOM
-
2026-06-08days on market $175,000 Active 22 DOM
-
2026-06-07days on market $175,000 Active 21 DOM
-
2026-06-07days on market $175,000 Active 20 DOM
-
2026-06-04days on market $175,000 Active 17 DOM
-
2026-06-02days on market $175,000 Active 16 DOM
-
2026-06-01days on market $175,000 Active 15 DOM
-
2026-05-31days on market $175,000 Active 14 DOM
-
2026-05-31days on market $175,000 Active 13 DOM
-
2026-05-17$175,000 Active
-
2026-05-12historical
-
2025-11-11$189,900 Active
-
2023-06-14soldstatus $162,000
-
2023-03-31$159,900 Active
-
2019-03-25historical
-
2019-03-25soldstatus $85,000 Closed
-
2019-02-04$88,500
-
2019-02-04$88,500
-
2017-05-09soldstatus $74,000
ⓘ Source: listings_history table (triggers on properties + properties_extension) + one-shot
backfill from property_details.listing_events for pre-trigger history.
Tax reassessment forecast SC · Resets to sale price
- Current annual tax
- $2,398 · $200/mo
- Projected year-2 tax
- $2,398 · $200/mo
- Expected delta
- $0/yr ($0/mo · 0.0%)
ⓘ Screening estimate from a state-policy table — verify with the county assessor before closing.
Climate risk First Street
- Flood 1/10 Low FEMA zone X (unshaded) · 0% chance over 30 yrs
- Wildfire 6/10 Major
- Heat 7/10 Severe 7 d/yr ≥108°F today · 16 d/yr by 30 yrs out
- Wind 8/10 Severe 80% chance of damaging wind over 30 yrs
- Air quality 3/10 Moderate 3 unhealthy d/yr today · 3 by 30 yrs out
Nearby sold comps map
Loading sold comps map…
Walkable amenities ~0.75 mi
Loading nearby amenities…
Taxation est. · year 1
- Rental income
- $18,325
- − Mortgage interest
- −$9,803
- − Property taxes
- −$2,398
- − Insurance
- −$875
- − Repairs & maintenance
- −$1,466
- − Management
- −$1,466
- − Depreciation
- −$5,091
- Taxable loss
- −$2,774
- Est. tax savings @ 24.0%
- +$666
- After-tax cash flow
- $857/yr
For passive investors: Depreciation is non-cash, so a rental often shows a tax loss while cash-flowing — sheltering income. Rental losses are passive: they offset passive income freely, and up to $25,000/yr can offset ordinary (W-2) income if you actively participate and your MAGI is under $100k (phasing out to $0 by $150k); unused losses carry forward. On sale, claimed depreciation is recaptured at up to 25%, and gains may owe capital-gains tax (a 1031 exchange can defer both). Figures are a year-1 estimate at your 24.0% rate — not tax advice; consult a CPA.
Schools (NCES district)
No district data.
Livability — Orangeburg
- Score
- 54/100
- State rank
- #324
- US rank
- #23942
Category grades
Schools grade is shown separately in the Schools card above.
Census & demographics
- County
- Orangeburg County · 15,135 people
- City population
- 15,135
- Metro
- Orangeburg, SC
- Population (ZIP)
- 15,135
- Household income
- $64,167
- Rent vs Own
- Severe rent burden
- 253.0
Population outlook (Orangeburg County) Hauer SSP2
- Today (2025)
- 82,698 people
- By 2030
- 78,615 · -4.9%
- By 2040
- 69,308 · -16.2%
- By 2050
- 60,629 · -26.7%
- By 2075
- 42,678 · -48.4%
- By 2100
- 28,136 · -66.0%
Race, ethnicity, and origin ACS 2023
- Neighborhood character
- Majority Black (63%)
- Race & ethnicity
- Black 63% White 28% Hispanic / Latino 5% Asian 2% Two or more races 2%
- Hispanic origin (detail)
- Mexican 3%
- Common ancestry
- Italian 1% Serbian 1% Lithuanian 1%
- Foreign-born
- 3% · Canada
- Languages at home
- 91% English-only · Spanish 6% French/Haitian/Cajun 1% Arabic 1%
Political lean MEDSL · Orangeburg
- 2024 margin
- Strong D (+24.6) · D 61.8% · R 37.2% · Other 1.1%
- 2008→2024 swing
- -13.5pp toward R · 2008: 38.1pp · 2024: 24.6pp
- All cycles
- 2024: D+24.6 2020: D+33.2 2016: D+37.0 2012: D+43.5 2008: D+38.1
Not yet ingested
- Civics
- —
Market trends
- HPI YoY
- ▼ -71.45%
- Current HPI
- 176.0101
- Rent YoY
- —
- Metro
- Orangeburg, SC
- State GDP YoY
- ▲ 4.51%
- F500 in state
- 2
Industry mix (Fortune 500 HQ in SC)
| Industry | F500 HQs | Revenue |
|---|---|---|
| Packaging | 1 | $7B |
|
||
Price history
+136.5% since first listed10 events — show timeline
- 2026-05-17 Listed $175,000 Consolidated MLS
- 2026-05-12 Listing Removed — Charleston Trident MLS
- 2025-11-11 Listed $189,900 Charleston Trident MLS
- 2023-06-14 Sold (Public Records) $162,000 Public Records
- 2023-03-31 Listed $159,900 Consolidated MLS
- 2019-03-25 Sold (MLS) $85,000 Charleston Trident MLS
- 2019-03-25 Listing Removed — Charleston Trident MLS
- 2019-02-04 Listed $88,500 Charleston Trident MLS
- 2019-02-04 Listed $88,500 Consolidated MLS
- 2017-05-09 Sold (Public Records) $74,000 Public Records
Property tax history
+26.0%/yrLatest (2024): $2,398 · +249.6% YoY. Source: county tax records.
Cash-flow waterfall
monthlySold comps — $/sqft
last 12 mo · ≤1 miLoading sold comps…