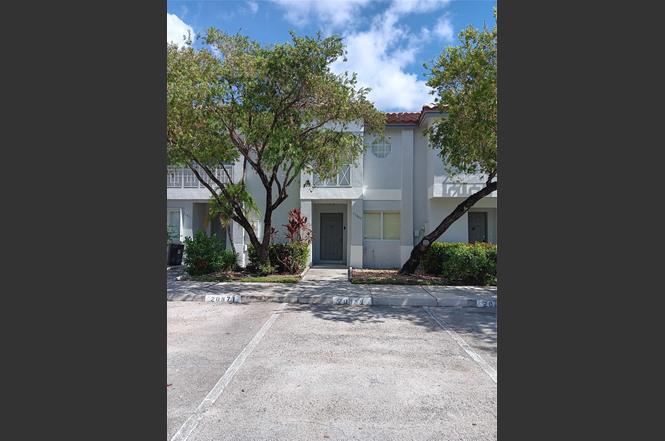
20869 NW 2nd St #1 · Pembroke Pines, FL
Flood risk 1/10 · Minimal
- FEMA flood zone
- X (shaded)
- Chance of flooding over 30 yrs
- 0.0%
- Est. flood insurance / yr
- $507 – $1,088
Fire risk 5/10 · Moderate
- Est. fire insurance / yr
- $947 – $1,759
Heat risk 9/10 · Severe
- Hot days now (above 107°F)
- 7 days/yr
- Hot days in 30 yrs
- 26 days/yr
Wind risk 10/10 · Severe
- Chance of severe wind over 30 yrs
- 99.0%
Air-quality risk 2/10 · Minimal
- Unhealthy air days now
- 1 days/yr
- Unhealthy air days in 30 yrs
- 2 days/yr
Risk factors via First Street. Map © Google.
Why this score? — see what drove the D+ grade
The composite is a weighted blend of 9 inputs, each scored 0–100. Each bar is that input's sub-score; the figure is the points it added to the 100-point composite (weight × sub-score).
- Cash flow +12.8/30.0
- ARV discount +12.0/15.0
- Livability +4.2/5.0
- 1% rule +4.1/10.0
- Schools +4.1/10.0
- DSCR +3.8/10.0
- Condition / age +2.5/5.0
- Rent growth +2.2/5.0
- Appreciation +0.0/10.0
$387,000
🖨 Deal sheet (PDF) 📄 Offer letter ✓ Due diligence
Listing remarks
Very well maintained townhome located at Malibu Bay, part of Chapel Trail and just off Pines Blvd and close to US27. Excellent schools. two parking spaces in front of property. Downstairs is tiled, containing kitchen, half bathroom, laundrya re and great room. Upstairs contains two master bedrooms with closets and private bathrooms. Laminate flooring.
Key facts
- Laminate flooring
- Private bathrooms
- Two parking spaces
Tags
Neighborhood map
What this means for you Summary
Snapshot
- This is a 2-bed/2.5-bath townhouse listed at $387k.
Deal economics
- At list price, monthly cash flow is $-35 ($-420/yr) — negative.
- To cash-flow at today's rent, offer at most $382k (1.3% below list).
- To meet the 1% rule (rent ≥ 1% of price), the offer needs to be $352k (9.0% below list).
- Recommended offer: $352k (9.0% below list) — sets the bar for 1% rule.
- Cap rate 6.2% vs local median 4.0% in Pembroke Pines — top-decile yield for the area; either an underpriced asset or a hidden risk that comps aren't pricing in. Stress-test before assuming the spread holds.
Location & tenants
- Location reads 83/100 on livability (#54 in FL, #933 nationally) — a professional / high-income tenant draw. Strengths: housing A+, health & safety A+, crime A-; Watch: amenities D+, cost of living D+.
- Broward (suburban): math 42% / reading 53% proficiency, ranked #46 of 73 in FL (top 63%) — families likely to look elsewhere, expect single-tenant / working-renter base with shorter leases.
- Zoned schools: Nova Blanche Forman Elementary (math 35% / reading 55%, grade D-, #1,271 of 2,144 statewide, top 60%, 769 students, 72% FRL); Nova Middle School (math 44% / reading 53%, grade C-, #274 of 571 statewide, top 50%, 1,284 students, 68% FRL); West Broward High School (math 46% / reading 69%, grade C, #125 of 667 statewide, top 19%, 2,586 students, 33% FRL).
- Market conditions: Rents soft (-1.2%/yr); 246 active listings in the ZIP; 19 comparable units currently listed for rent nearby; rentals at typical pace (median 26d on market — plan ~3-4 weeks tenant-placement turnaround); high-income renter base; 2,111 units permitted in Broward County in 2024 (1,265 in 5+ unit buildings).
Forward outlook
- Local home prices are declining (-3.0%/yr); year-one equity from $3k of loan paydown is wiped out by about $12k of value loss. Plan a longer hold.
- Broward County population projected at +34% by 2050 — long-run rental-demand tailwind backs the buy-and-hold thesis.
Negotiation context
- Only 12 days on market — expect competitive offers; lowballing is unlikely to land.
- 2 sale attempts with the ask held roughly flat each time — persistent listings suggest the price (not the market) is what's stuck; bring a comps-based counter.
Risks & watch-outs
- Climate carrying-cost: severe wind risk, 99% chance of damaging wind over 30y; moderate wildfire risk; extreme-heat days projected 7→26/yr by 2055 (HVAC capex compounding) — expect insurance premiums to compound above CPI over the hold.
Questions for the listing agent
- What do current leases actually rent for vs. the listed asking? Can we see a recent rent roll and the last 12 months of T-12 income?
- What does the HOA fee cover, when was the last increase, and are there any pending special assessments or reserve-fund shortfalls?
- Is there a deadline driving the sale (1031 exchange, divorce, estate, relocation)? That informs how much negotiation room exists.
- Schools are A-rated — typically a magnet for longer-tenancy family renters. What's the average tenant stay here, and is there a school-zone premium baked into asking?
- The area grade is low — what's the realistic commute time and amenity access for the typical tenant pool here? Any planned neighborhood developments (good or bad) we should know about?
- What's the average days-on-market for RENTAL listings here right now (not sales)? A rising rental-DOM trend means longer vacancies and softer asking-rent achievability than the comps imply.
- What's the recent tenant-quality profile in this submarket — average credit score on applications, eviction rate, late-payment / NSF rate, and stable-employment percentage? A property-management company in the area should have these aggregated.
- How much new for-sale + rental construction is in the pipeline within 1–3 miles? Heavy new supply typically softens prices + rents 12–24 months out; constrained supply supports both.
Investment metrics
- 1% rule
- 0.91% ✗
- Cap rate
- 6.18%
- Cash-on-cash
- -0.39%
- DSCR
- 0.98
- GRM
- 9.2
CMA / ARV
- ARV (on-the-fly)
- $430,076
- Comps found
- 2
Show comp detail 2 sales within ~0.75 mi
| Address | Dist | Beds/Ba | Sqft | Sold | Price | $/sf | Match |
|---|---|---|---|---|---|---|---|
| 756 NW 208th Way | 0.32mi | 3/2.5 (+1) | 1,361 (0%) | 20mo | $430,000 | $316 | 64 |
| 566 NW 208th Way #566 | 0.25mi | 3/2.5 (+1) | 1,468 (+8%) | 24mo | $450,000 | $307 | 50 |
Match score weights: distance 35% · size 25% · config 20% · recency 20%. Top-matched comps best support the ARV.
Projected returns pro-forma
-3.0% appreciation · 0.0% rent growth · sell at horizon
- IRR
- -20.5%
- Equity multiple
- 0.31×
- Total profit
- $-75,119
- Equity at exit
- $57,703
- IRR
- -22.9%
- Equity multiple
- 0.01×
- Total profit
- $-107,591
- Equity at exit
- $33,461
Cash invested: $108,360 (down + closing). Projections, not guarantees.
Landlord ↔ Tenant lean methodology
- Overall (STATE)
- 87 Strongly Landlord-Friendly
- State Florida
- 87 Strongly Landlord-Friendly · R+3
- County
- — inherits STATE
- City
- — inherits STATE
ZIP-level market 33029
- Home prices YoY
- -18.3%
- Rents YoY
- -1.2%
- Active inventory
- 246
- Price-to-rent
- 9.2×
Monthly cashflow live
- Estimated rent
- $3,521 high interval (Pro) →
- Mortgage (P&I)
- −$2,029
- Tax est. 1.5%
- −$484 /mo · $5,805/yr
- Insurance
- −$161
- HOA
- −$142
- Vacancy / Maint / Mgmt
- −$739
- Net cashflow
- $-35
Break-even live
Sensitivity live
| Price | -10% $232 | -5% $99 | +0% $-35 | +5% $-169 | +10% $-302 |
|---|---|---|---|---|---|
| Rent | -10% $-313 | -5% $-174 | +0% $-35 | +5% $104 | +10% $243 |
| Rate | -1.0pp $160 | -0.5pp $63 | base $-35 | +0.5pp $-135 | +1.0pp $-237 |
UW: 25.0% down · 7.5% · 30yr · 1.5% tax · 5.0% vac · 8.0% maint · 8.0% mgmt
Financing live
Cash to close
- Down payment
- $96,750
- Closing costs
- $11,610
- Reserves months
- —
- Total cash needed
- —
Loan-product check · same deal, 3 products live
Conventional
25% down · 7.5% · 30yr
- Down + closing
- —
- Monthly P&I
- —
- Monthly cashflow
- —
- DSCR
- —
- Eligible?
- —
Personal DTI + credit; lowest rate.
DSCR
20% down · 8.5% · 30yr
- Down + closing
- —
- Monthly P&I
- —
- Monthly cashflow
- —
- DSCR
- —
- Eligible?
- —
No personal income docs; deal must DSCR.
Hard money
10% down · 12.0% · 12mo
- Down + closing
- —
- Monthly P&I
- —
- Monthly cashflow
- —
- DSCR
- —
- Eligible?
- —
Short-term bridge; refi at stabilization.
Rent comps 19 comps
| Address | Beds | Baths | Sqft | Rent | $/sqft | DOM | Units | Dist |
|---|---|---|---|---|---|---|---|---|
| 20901 NW 1st Dr Unit 1 Pembroke Pines, FL | 3.0 | 2.5 | 1692 | $3,200 | $1.89 | 26d | 1 | 0.08mi |
| 20901 NW 1st Dr Pembroke Pines, FL | 3.0 | 2.5 | 1692 | $3,300 | $1.95 | 26d | 1 | 0.08mi |
| 20841 NW 1st St Pembroke Pines, FL | 3.0 | 2.0 | 1225 | $3,500 | $2.86 | 26d | 1 | 0.08mi |
| 20908 NW 1st Dr Pembroke Pines, FL | 3.0 | 2.5 | 1692 | $3,500 | $2.07 | 26d | 1 | 0.09mi |
| 20919 NW 1st Dr Pembroke Pines, FL | 3.0 | 2.5 | 1749 | $3,600 | $2.06 | 14d | 1 | 0.10mi |
| 20919 NW 1st Dr Pembroke Pines, FL | 3.0 | 2.5 | 1749 | $3,600 | $2.06 | 26d | 1 | 0.10mi |
| 20861 NW 4th St Pembroke Pines, FL | 3.0 | 2.5 | 1361 | $4,000 | $2.94 | 26d | 1 | 0.13mi |
| 20875 NW 4th St Pembroke Pines, FL | 2.0 | 2.5 | 1361 | $2,500 | $1.84 | 26d | 1 | 0.14mi |
| 20807 NW 1st St #20807 Pembroke Pines, FL | 2.0 | 2.5 | 1361 | $2,650 | $1.95 | 18d | 1 | 0.14mi |
| 210 NW 207th Way Pembroke Pines, FL | 3.0 | 2.0 | 1620 | $3,395 | $2.10 | 1d | 1 | 0.15mi |
| 20930 NW 1st St Pembroke Pines, FL | 3.0 | 3.0 | 1617 | $3,600 | $2.23 | 9d | 1 | 0.17mi |
| 20957 NW 1st Ct Unit 20957 Pembroke Pines, FL | 3.0 | 2.5 | 1749 | $2,900 | $1.66 | 26d | 1 | 0.19mi |
| 20975 NW 1st Ct Pembroke Pines, FL | 3.0 | 2.5 | 1692 | $3,600 | $2.13 | 26d | 1 | 0.20mi |
| 20541 SW 2nd St Pembroke Pines, FL | 3.0 | 3.0 | 1694 | $5,500 | $3.25 | 0d | 1 | 0.48mi |
| 387 SW 206th Ave Pembroke Pines, FL | 3.0 | 2.0 | 1453 | $3,500 | $2.41 | 18d | 1 | 0.54mi |
| 387 SW 206th Ave Pembroke Pines, FL | 3.0 | 2.0 | 1453 | $3,500 | $2.41 | 14d | 1 | 0.54mi |
| 21821 S Heritage Cir #1 Pembroke Pines, FL | 3.0 | 3.0 | 1475 | $2,550 | $1.73 | 26d | 1 | 0.69mi |
| 21821 S Heritage Cir #1 Pembroke Pines, FL | 3.0 | 3.0 | 1475 | $2,550 | $1.73 | 6d | 1 | 0.69mi |
| 18426 SW 2nd St Pembroke Pines, FL | 3.0 | 2.5 | 1536 | $3,950 | $2.57 | 17d | 1 | 1.35mi |
HOA detail
- Monthly dues
- $142 · $1,704/yr
Listing history 5 events
-
2026-03-23status Pending
-
2026-01-07$387,000 Active
-
2026-01-01historical $2,550
-
2025-12-04price $2,550
-
2025-10-09$2,650
ⓘ Source: listings_history table (triggers on properties + properties_extension) + one-shot
backfill from property_details.listing_events for pre-trigger history.
Climate risk First Street
- Flood 1/10 Low FEMA zone X (shaded) · 0% chance over 30 yrs
- Wildfire 5/10 Major
- Heat 9/10 Extreme 7 d/yr ≥107°F today · 26 d/yr by 30 yrs out
- Wind 10/10 Extreme 99% chance of damaging wind over 30 yrs
- Air quality 2/10 Low 1 unhealthy d/yr today · 2 by 30 yrs out
Nearby sold comps map
Loading sold comps map…
Walkable amenities ~0.75 mi
Loading nearby amenities…
Taxation est. · year 1
- Rental income
- $42,250
- − Mortgage interest
- −$21,678
- − Property taxes
- −$5,805
- − Insurance
- −$1,935
- − Repairs & maintenance
- −$3,380
- − Management
- −$3,380
- − HOA
- −$1,704
- − Depreciation
- −$11,258
- Taxable loss
- −$6,890
- Est. tax savings @ 24.0%
- +$1,654
- After-tax cash flow
- $1,233/yr
For passive investors: Depreciation is non-cash, so a rental often shows a tax loss while cash-flowing — sheltering income. Rental losses are passive: they offset passive income freely, and up to $25,000/yr can offset ordinary (W-2) income if you actively participate and your MAGI is under $100k (phasing out to $0 by $150k); unused losses carry forward. On sale, claimed depreciation is recaptured at up to 25%, and gains may owe capital-gains tax (a 1031 exchange can defer both). Figures are a year-1 estimate at your 24.0% rate — not tax advice; consult a CPA.
Schools (NCES district)
- District
- Broward
- NCES district ID
- 1200180
- Math proficiency
- 42% ▼ -18.00%
- Reading proficiency
- 53% ▼ -5.00%
- Median HH income
- $52,139
- Composite
- 40.88/100
- National rank
- #3621
- State rank
- #46 of 73 in FL
Livability — Pembroke Pines
- Score
- 83/100
- State rank
- #54
- US rank
- #933
Category grades
Schools grade is shown separately in the Schools card above.
Census & demographics
- Census place
- Pembroke Pines, FL
- County
- Broward County · 1,963,430 people
- City population
- 180,224
- Metro
- Miami-Fort Lauderdale-Pompano Beach, FL
- Population (ZIP)
- 44,070
- Household income
- $146,237
- Rent vs Own
- Severe rent burden
- 307.0
Population outlook (Broward County) Hauer SSP2
- Today (2025)
- 2,207,033 people
- By 2030
- 2,360,704 · +7.0%
- By 2040
- 2,661,208 · +20.6%
- By 2050
- 2,946,698 · +33.5%
- By 2075
- 3,602,273 · +63.2%
- By 2100
- 3,970,984 · +79.9%
Race, ethnicity, and origin ACS 2023
- Neighborhood character
- Highly diverse neighborhood (Simpson 0.70)
- Race & ethnicity
- Hispanic / Latino 43% Two or more races 29% White 27% Black 20% Asian 7%
- Hispanic origin (detail)
- Mexican 2% Puerto Rican 5% Cuban 14% Dominican 3%
- Common ancestry
- Hispanic 2% Russian 1% Estonian 1%
- Foreign-born
- 33% · Canada, Jamaica, China
- Languages at home
- 53% English-only · Spanish 38% Other Indo-European 4% French/Haitian/Cajun 2%
Political lean MEDSL · Broward
- 2024 margin
- D (+17.0) · D 58.0% · R 41.0%
- 2008→2024 swing
- -17.8pp toward R · 2008: 34.7pp · 2024: 17.0pp
- All cycles
- 2024: D+17.0 2020: D+29.8 2016: D+35.0 2012: D+34.9 2008: D+34.7
Not yet ingested
- Civics
- —
Market trends
- HPI YoY
- ▼ -83.68%
- Current HPI
- 373.7752
- Rent YoY
- ▼ -1.17%
- Metro
- Miami-Fort Lauderdale-Pompano Beach, FL
- State GDP YoY
- ▲ 3.28%
- F500 in state
- 36
Industry mix (Fortune 500 HQ in FL)
| Industry | F500 HQs | Revenue |
|---|---|---|
| Industrial Technology | 2 | $29B |
|
||
| Insurance | 2 | $17B |
|
||
| Retail | 1 | $60B |
|
||
| Technology Distribution | 1 | $58B |
|
||
| Homebuilding | 1 | $35B |
|
||
| Technology Manufacturing | 1 | $35B |
|
||
Price history
+14503.8% since first listed5 events — show timeline
- 2026-03-23 Pending — Beaches MLS
- 2026-01-07 Listed $387,000 Beaches MLS
- 2026-01-01 Rental Removed $2,550 GFLMLS
- 2025-12-04 Price Changed $2,550 GFLMLS
- 2025-10-09 Listed for Rent $2,650 GFLMLS
Cash-flow waterfall
monthlySold comps — $/sqft
last 12 mo · ≤1 miLoading sold comps…