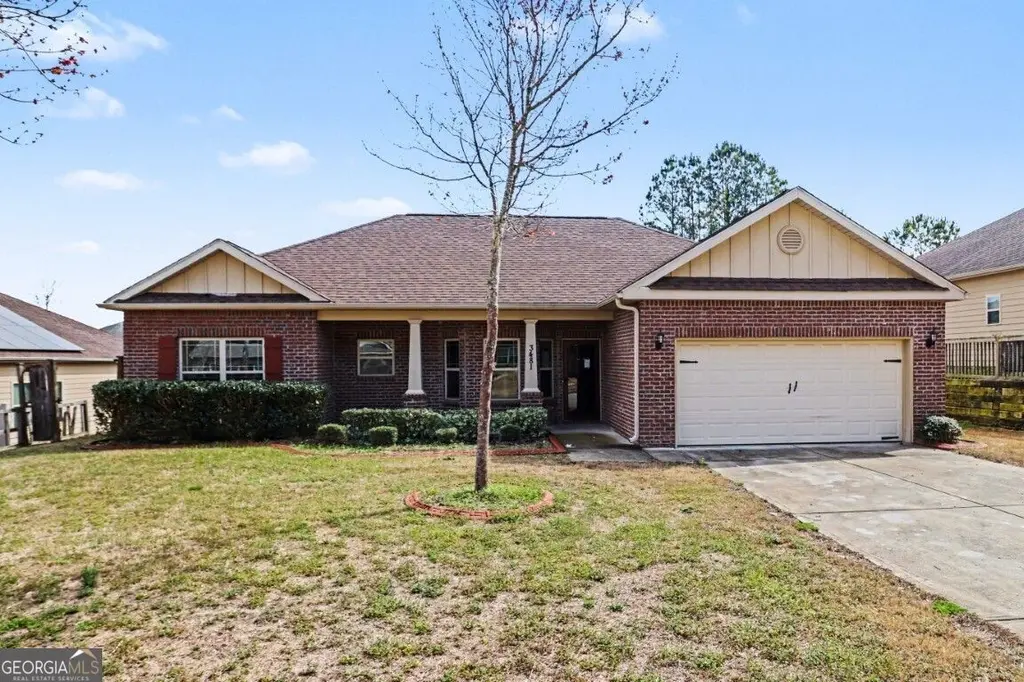
3481 Dacite Ct · South Fulton, GA
Flood risk 1/10 · Minimal
- FEMA flood zone
- X (unshaded)
- Chance of flooding over 30 yrs
- 0.0%
- Est. flood insurance / yr
- $507 – $1,088
Fire risk 4/10 · Minor
- Est. fire insurance / yr
- $963 – $1,789
Heat risk 6/10 · Moderate
- Hot days now (above 105°F)
- 7 days/yr
- Hot days in 30 yrs
- 19 days/yr
Wind risk 6/10 · Moderate
- Chance of severe wind over 30 yrs
- 27.0%
Air-quality risk 4/10 · Minor
- Unhealthy air days now
- 4 days/yr
- Unhealthy air days in 30 yrs
- 6 days/yr
Risk factors via First Street. Map © Google.
Why this score? — see what drove the C- grade
The composite is a weighted blend of 9 inputs, each scored 0–100. Each bar is that input's sub-score; the figure is the points it added to the 100-point composite (weight × sub-score).
- Cash flow +13.1/30.0
- ARV discount +10.9/15.0
- Appreciation +10.0/10.0
- Schools +4.5/10.0
- DSCR +3.9/10.0
- 1% rule +3.3/10.0
- Rent growth +2.7/5.0
- Livability +2.5/5.0
- Condition / age +2.5/5.0
$240,000
🖨 Deal sheet 📄 Offer letter ✓ Due diligence
Listing remarks
This 3-bedroom, 2-bath stepless ranch offers a comfortable layout with great flow and plenty of space. The large eat-in kitchen opens to an oversized family room, creating a central gathering area with high ceilings that add to the open feel of the home. The primary suite features trey ceilings, a spacious walk-in closet, and a private bath. Additional bedrooms provide flexibility for a variety of needs. Conveniently located with easy access to I-85 and I-285, and just minutes from Hartsfield-Jackson Airport and downtown Atlanta, this home is well positioned for commuting and everyday convenience. The home has been lived in and will benefit from some updates, but offers a solid layout and a
Key facts
- Walk-in closet
- Private bath
- Primary suite
Tags
Property features AI
Finance
- Other: Lot size approx. 0.255 acre; Located in Flat Shoals Estates subdivision
- Financial info: Listed as real estate owned (sold As-Is)
- HOA & community: Homeowners association with monthly fee (approximately $300); Association fee includes management and reserve fund; Community near public transportation
Exterior
- Parking: Attached garage with space for 2 vehicles; Kitchen-level parking access
- Utilities: Public water; Public sewer; 220-volt electric; Cable available; High-speed internet available; Underground utilities
- Home design: Single-family house; One story; Resale property
- Construction: Built in 2017; Brick and wood siding exterior; Composition roof; No basement
- Exterior features: Cul-de-sac lot; Level lot
Interior
- Kitchen: Dishwasher; Refrigerator; Stainless steel appliances
- Bedrooms: Three bedrooms on the main level
- Flooring: Carpet; Laminate; Vinyl
- Bathrooms: Two full bathrooms (both on the main level)
- Heating & cooling: Central electric heating; Central air conditioning; Ceiling fans
- Interior features: High ceilings; Tray ceilings; Roommate floor plan; Split bedroom plan; Double vanity; Walk-in closets; Factory-built fireplace in family room; No common walls
- Laundry & utility: Mud room; Laundry area
Neighborhood map
What this means for you Summary
Snapshot
- This is a 3-bed/2.0-bath single-family listed at $240k.
Deal economics
- At list price, monthly cash flow is $-10 ($-118/yr) — negative.
- To cash-flow at today's rent, offer at most $238k (0.7% below list).
- To meet the 1% rule (rent ≥ 1% of price), the offer needs to be $199k (17.0% below list).
- Recommended offer: $199k (17.0% below list) — sets the bar for 1% rule.
Location & tenants
- Location reads: area grade C — affects rentability + tenant quality, not the cash-flow math above.
- Fulton County (suburban): math 49% / reading 53% proficiency, ranked #12 of 174 in GA (top 7%) — acceptable for families but not a draw, mixed tenant base, ~2y average lease.
- Zoned schools: S. L. Lewis Elementary School (math 17% / reading 22%, grade F, #878 of 1,228 statewide, top 75%, 538 students, 100% FRL); Bear Creek Middle School (math 17% / reading 26%, grade F, #339 of 470 statewide, top 72%, 1,108 students, 100% FRL); Creekside High School (math 30% / reading 24%, grade F, #160 of 424 statewide, top 38%, 1,768 students, 100% FRL) — zoned schools average 100% FRL vs 41% district-wide (59 pts higher); higher-poverty schools than district average — tighter screening recommended.
- Zoned-school proficiency averages 23% at this address vs 51% district-wide (-28 pts) — the specific schools serving this property underperform the Fulton County average; the district grade overstates school quality for this exact location.
- Market conditions: Rents flat; 651 active listings in the ZIP; 40 comparable units currently listed for rent nearby; rentals at typical pace (median 22d on market — plan ~3-4 weeks tenant-placement turnaround); 11,565 units permitted in Fulton County in 2024 (8,159 in 5+ unit buildings).
Forward outlook
- In year one you build about $26k of equity ($2k loan paydown + $24k appreciation (10.0% local appreciation)).
- Fulton County population projected at +38% by 2050 — long-run rental-demand tailwind backs the buy-and-hold thesis.
- At projected returns (10.0% appreciation + 0.9% rent growth), your $67k cash investment doubles in ~3 years — after that, you're playing with house money.
- By year 2, paydown + projected appreciation supports a ~$41k cash-out refi (75% LTV) — recoverable capital for the next deal without selling this one.
Negotiation context
- It's been on market 15 days — a 2% lower offer ($236k) is reasonable based on typical stale-listing flexibility.
- 4 sale attempts since 9y ago with the ask held roughly flat each time — persistent listings suggest the price (not the market) is what's stuck; bring a comps-based counter.
- Current owner paid $181k; 33% above their basis — modest negotiation headroom, anchor on the comps not their cost.
Risks & watch-outs
- Climate carrying-cost: major wind risk, 27% chance of damaging wind over 30y; extreme-heat days projected 7→19/yr by 2055 (HVAC capex compounding) — expect insurance premiums to compound above CPI over the hold.
Questions for the listing agent
- What do current leases actually rent for vs. the listed asking? Can we see a recent rent roll and the last 12 months of T-12 income?
- What does the HOA fee cover, when was the last increase, and are there any pending special assessments or reserve-fund shortfalls?
- Is there a deadline driving the sale (1031 exchange, divorce, estate, relocation)? That informs how much negotiation room exists.
- What's the average days-on-market for RENTAL listings here right now (not sales)? A rising rental-DOM trend means longer vacancies and softer asking-rent achievability than the comps imply.
- What's the recent tenant-quality profile in this submarket — average credit score on applications, eviction rate, late-payment / NSF rate, and stable-employment percentage? A property-management company in the area should have these aggregated.
- How much new for-sale + rental construction is in the pipeline within 1–3 miles? Heavy new supply typically softens prices + rents 12–24 months out; constrained supply supports both.
Investment metrics
- 1% rule
- 0.83% ✗
- Cap rate
- 6.24%
- Cash-on-cash
- -0.18%
- DSCR
- 0.99
- GRM
- 10.0
CMA / ARV
- ARV (median comp)
- $259,373
- List price
- $240,000
- Delta
- -7.47%
- Verdict
- FAIR
- Comps
- 20 within 1.0 mi
Show comp detail 12 sales within ~0.75 mi
| Address | Dist | Beds/Ba | Sqft | Sold | Price | $/sf | Match |
|---|---|---|---|---|---|---|---|
| 155 Rockfort Ct | 0.25mi | 3/2.5 | 1,608 (-0%) | 16mo | $180,000 | $112 | 73 |
| 6215 Lamp Post Pl | 0.30mi | 3/2.0 | 1,562 (-3%) | 17mo | $200,000 | $128 | 67 |
| 6660 Hidden Brook Trl | 0.52mi | 4/2.0 (+1) | 1,624 (+1%) | 9mo | $289,000 | $178 | 62 |
| 3615 Leisure Ln | 0.67mi | 3/2.0 | 1,621 (+0%) | 15mo | $218,000 | $134 | 56 |
| 6630 Leisure Trl | 0.69mi | 3/2.0 | 1,579 (-2%) | 15mo | $220,000 | $139 | 52 |
| 3414 Bench Ave | 0.37mi | 4/2.5 (+1) | 1,784 (+10%) | 15mo | $283,000 | $159 | 46 |
| 3420 Leisure Ln | 0.50mi | 3/2.0 | 1,388 (-14%) | 11mo | $225,000 | $162 | 44 |
| 3401 Sumersbe Ct #1 | 0.52mi | 3/3.5 | 1,491 (-8%) | 18mo | $291,989 | $196 | 42 |
| 6675 Hidden Brook Trl | 0.49mi | 4/3.0 (+1) | 1,800 (+12%) | 8mo | $284,998 | $158 | 42 |
| 3459 Bench Ave | 0.37mi | 3/2.5 | 1,849 (+15%) | 20mo | $165,000 | $89 | 40 |
| 6086 Lamp Post Pl | 0.60mi | 4/3.0 (+1) | 1,726 (+7%) | 18mo | $269,000 | $156 | 36 |
| 6610 Leisure Trl | 0.72mi | 3/2.0 | 1,450 (-10%) | 19mo | $257,000 | $177 | 34 |
Match score weights: distance 35% · size 25% · config 20% · recency 20%. Top-matched comps best support the ARV.
Projected returns pro-forma
10.0% appreciation · 0.95% rent growth · sell at horizon
- IRR
- 23.5%
- Equity multiple
- 2.88×
- Total profit
- $126,042
- Equity at exit
- $216,211
- IRR
- 20.5%
- Equity multiple
- 6.42×
- Total profit
- $364,132
- Equity at exit
- $466,267
Cash invested: $67,200 (down + closing). Projections, not guarantees.
Landlord ↔ Tenant lean methodology
- Overall (STATE)
- 90 Strongly Landlord-Friendly
- State Georgia
- 90 Strongly Landlord-Friendly · R+3
- County
- — inherits STATE
- City
- — inherits STATE
ZIP-level market 30349
- Home prices YoY
- 4.6%
- Rents YoY
- 0.9%
- Active inventory
- 651
- Price-to-rent
- 10.0×
Monthly cashflow live
- Estimated rent
- $1,991 high interval (Pro) →
- Mortgage (P&I)
- −$1,259
- Tax from tax record
- −$199 /mo · $2,388/yr
- Insurance
- −$100
- HOA
- −$25
- Vacancy / Maint / Mgmt
- −$418
- Net cashflow
- $-10
Break-even live
UW: 25.0% down · 7.5% · 30yr · 1.5% tax · 5.0% vac · 8.0% maint · 8.0% mgmt
Financing live
Cash to close
- Down payment
- $60,000
- Closing costs
- $7,200
- Reserves months
- —
- Total cash needed
- —
Loan-product check · same deal, 3 products live
Conventional
25% down · 7.5% · 30yr
- Down + closing
- —
- Monthly P&I
- —
- Monthly cashflow
- —
- DSCR
- —
- Eligible?
- —
Personal DTI + credit; lowest rate.
DSCR
20% down · 8.5% · 30yr
- Down + closing
- —
- Monthly P&I
- —
- Monthly cashflow
- —
- DSCR
- —
- Eligible?
- —
No personal income docs; deal must DSCR.
Hard money
10% down · 12.0% · 12mo
- Down + closing
- —
- Monthly P&I
- —
- Monthly cashflow
- —
- DSCR
- —
- Eligible?
- —
Short-term bridge; refi at stabilization.
Rent comps 40 comps
| Address | Beds | Baths | Sqft | Rent | $/sqft | DOM | Units | Dist |
|---|---|---|---|---|---|---|---|---|
| 6415 El Caudillo Ct Atlanta, GA | 3.0 | 3.0 | 1498 | $2,800 | $1.87 | 4d | 1 | 0.37mi |
| 2560 Foxlair Trl Atlanta, GA | 4.0 | 2.0 | 1485 | $1,795 | $1.21 | 24d | 1 | 0.40mi |
| 3240 Devilla Trce South Fulton, GA | 4.0 | 2.0 | 1616 | $1,980 | $1.23 | 43d | 1 | 0.50mi |
| 3457 Sumersbe Ct Atlanta, GA | 3.0 | 2.5 | 1800 | $2,300 | $1.28 | 5d | 1 | 0.53mi |
| 325 Pointer Ct Atlanta, GA | 3.0 | 2.0 | 1474 | $1,620 | $1.10 | 5d | 1 | 0.58mi |
| 6575 Smoke Ridge Dr Atlanta, GA | 4.0 | 2.0 | 1808 | $1,815 | $1.00 | 43d | 1 | 0.68mi |
| 3760 Cedar Hurst Way Atlanta, GA | 4.0 | 2.5 | 1595 | $2,150 | $1.35 | 10d | 1 | 0.69mi |
| 6440 Connell Rd Atlanta, GA | 3.0 | 2.0 | 1391 | $1,695 | $1.22 | 24d | 1 | 0.70mi |
| 6445 Connell Rd Atlanta, GA | 3.0 | 2.0 | 1357 | $1,856 | $1.37 | 43d | 1 | 0.72mi |
| 3325 Valley Bend Rd Atlanta, GA | 4.0 | 2.0 | 2000 | $1,995 | $1.00 | 17d | 1 | 0.75mi |
| 3325 Valley Bend Rd Atlanta, GA | 4.0 | 2.0 | 2000 | $1,995 | $1.00 | 5d | 1 | 0.75mi |
| 3500 Keels Ln Atlanta, GA | 3.0 | 2.0 | 1272 | $1,755 | $1.38 | 2d | 1 | 0.75mi |
| 6500 Connell Rd Atlanta, GA | 3.0 | 2.0 | 1483 | $1,650 | $1.11 | 24d | 1 | 0.81mi |
| 3800 Leisure Ln Atlanta, GA | 3.0 | 2.0 | 1198 | $2,350 | $1.96 | 22d | 1 | 0.82mi |
| 4014 Carisbrook Dr Union City, GA | 4.0 | 2.5 | 1795 | $2,295 | $1.28 | 22d | 1 | 0.99mi |
| 4014 Carisbrook Dr Union City, GA | 4.0 | 2.5 | 1795 | $2,195 | $1.22 | 5d | 1 | 0.99mi |
| 4014 Carisbrook Dr Union City, GA | 4.0 | 2.5 | 1795 | $2,295 | $1.28 | 24d | 1 | 0.99mi |
| 6225 Shenfield Ln Union City, GA | 3.0 | 2.5 | 1821 | $2,000 | $1.10 | 43d | 1 | 1.01mi |
| 3859 Shenfield Dr Union City, GA | 4.0 | 2.5 | 1850 | $2,000 | $1.08 | 5d | 1 | 1.02mi |
| 6770 Buffington Rd Union City, GA | 1.0–3.0 | 1.0–2.0 | 950 | $1,699 | $1.79 | 2d | 24 | 1.03mi |
| 5885 Sable Chase Ln Atlanta, GA | 3.0 | 3.5 | 2160 | $2,100 | $0.97 | 20d | 1 | 1.03mi |
| 3855 Shenfield Dr Union City, GA | 3.0 | 2.5 | 1626 | $1,895 | $1.17 | 43d | 1 | 1.03mi |
| 420 Buffington Dr Union City, GA | 3.0 | 2.0 | 2118 | $2,050 | $0.97 | 20d | 1 | 1.04mi |
| 6345 Peppermill Ln Atlanta, GA | 3.0 | 2.5 | 1224 | $1,800 | $1.47 | 43d | 1 | 1.06mi |
| 6230 Cedar Wood Dr Atlanta, GA | 3.0 | 2.0 | 1238 | $1,694 | $1.37 | 43d | 1 | 1.07mi |
| 3477 Carriage Chase Rd Atlanta, GA | 4.0 | 3.0 | 1545 | $2,000 | $1.29 | 24d | 1 | 1.09mi |
| 4050 Morgan Rd Union City, GA | 1.0–3.0 | 1.0–2.0 | 988 | $1,750 | $1.77 | 5d | 21 | 1.12mi |
| 4128 Flat Trl Union City, GA | 3.0 | 2.5 | 1450 | $1,700 | $1.17 | 43d | 1 | 1.14mi |
| 5825 Vernier Dr Atlanta, GA | 3.0 | 2.0 | 1346 | $1,615 | $1.20 | 5d | 1 | 1.16mi |
| 5825 Vernier Dr Atlanta, GA | 3.0 | 2.0 | 1346 | $1,615 | $1.20 | 43d | 1 | 1.16mi |
| 5825 Vernier Dr Atlanta, GA | 3.0 | 2.0 | 1346 | $1,615 | $1.20 | 20d | 1 | 1.16mi |
| 5825 Vernier Dr Atlanta, GA | 3.0 | 2.0 | 1346 | $1,615 | $1.20 | 24d | 1 | 1.16mi |
| 6450 Peppermill Ln Atlanta, GA | 4.0 | 2.0 | 1188 | $1,531 | $1.29 | 24d | 1 | 1.17mi |
| 835 Buffington Ct Union City, GA | 4.0 | 2.5 | 1723 | $2,165 | $1.26 | 43d | 1 | 1.19mi |
| 5750 Buffington Rd Atlanta, GA | 1.0–3.0 | 1.0–2.0 | 1142 | $1,702 | $1.49 | 2d | 19 | 1.19mi |
| 3514 Devon Chase Rd Atlanta, GA | 3.0 | 2.0 | 1540 | $1,720 | $1.12 | 43d | 1 | 1.22mi |
| 3524 Devon Chase Rd Atlanta, GA | 3.0 | 2.5 | 1974 | $1,840 | $0.93 | 24d | 1 | 1.23mi |
| 3791 Shenfield Dr Union City, GA | 3.0 | 2.5 | 1784 | $2,086 | $1.17 | 10d | 1 | 1.23mi |
| 5740 Buffington Rd Atlanta, GA | 1.0–3.0 | 1.0–2.5 | 964 | $2,149 | $2.23 | 3d | 16 | 1.24mi |
| 3550 Morning Creek Dr Atlanta, GA | 4.0 | 2.0 | 1400 | $1,730 | $1.24 | 12d | 1 | 1.26mi |
HOA detail
- Monthly dues
- $25 · $300/yr
Listing history 11 events
-
2026-05-15status Under Contract 760-char remark
-
2026-05-12status Pending Offer Approval 760-char remark
-
2026-04-24$240,000 New 760-char remark
-
2024-07-22historical
-
2024-07-22historical
-
2024-07-02$315,000 New
-
2024-07-02$315,000 Active
-
2017-12-29soldstatus $181,100 Sold
-
2017-11-26status Under Contract
-
2017-11-08price $181,900
-
2017-09-19$178,900 New
ⓘ Source: listings_history table (triggers on properties + properties_extension) + one-shot
backfill from property_details.listing_events for pre-trigger history.
Tax reassessment forecast GA · Resets to sale price
- Current annual tax
- $2,388 · $199/mo
- Projected year-2 tax
- $2,388 · $199/mo
- Expected delta
- $0/yr ($0/mo · 0.0%)
ⓘ Screening estimate from a state-policy table — verify with the county assessor before closing.
Climate risk First Street
- Flood 1/10 Low FEMA zone X (unshaded) · 0% chance over 30 yrs
- Wildfire 4/10 Moderate
- Heat 6/10 Major 7 d/yr ≥105°F today · 19 d/yr by 30 yrs out
- Wind 6/10 Major 27% chance of damaging wind over 30 yrs
- Air quality 4/10 Moderate 4 unhealthy d/yr today · 6 by 30 yrs out
Nearby sold comps map
Loading sold comps map…
Walkable amenities ~0.75 mi
Loading nearby amenities…
Taxation est. · year 1
- Rental income
- $23,890
- − Mortgage interest
- −$13,444
- − Property taxes
- −$2,388
- − Insurance
- −$1,200
- − Repairs & maintenance
- −$1,911
- − Management
- −$1,911
- − HOA
- −$300
- − Depreciation
- −$6,982
- Taxable loss
- −$4,246
- Est. tax savings @ 24.0%
- +$1,019
- After-tax cash flow
- $901/yr
For passive investors: Depreciation is non-cash, so a rental often shows a tax loss while cash-flowing — sheltering income. Rental losses are passive: they offset passive income freely, and up to $25,000/yr can offset ordinary (W-2) income if you actively participate and your MAGI is under $100k (phasing out to $0 by $150k); unused losses carry forward. On sale, claimed depreciation is recaptured at up to 25%, and gains may owe capital-gains tax (a 1031 exchange can defer both). Figures are a year-1 estimate at your 24.0% rate — not tax advice; consult a CPA.
Schools (NCES district)
- District
- Fulton County
- NCES district ID
- 1302280
- Math proficiency
- 49% ▼ -2.00%
- Reading proficiency
- 53% ▬ 0.00%
- Median HH income
- $68,035
- Composite
- 45.33/100
- National rank
- #2640
- State rank
- #12 of 174 in GA
Livability — South Fulton
No livability data for this city. (Only ~50 U.S. cities are tracked.)
Census & demographics
- Census place
- South Fulton, GA
- County
- Fulton County · 1,094,430 people
- City population
- 127,674
- Metro
- Atlanta-Sandy Springs-Alpharetta, GA
- Population (ZIP)
- 79,872
- Household income
- $67,023
- Rent vs Own
- Severe rent burden
- 4258.0
Population outlook (Fulton County) Hauer SSP2
- Today (2025)
- 1,203,707 people
- By 2030
- 1,299,706 · +8.0%
- By 2040
- 1,488,256 · +23.6%
- By 2050
- 1,664,580 · +38.3%
- By 2075
- 2,036,072 · +69.2%
- By 2100
- 2,222,402 · +84.6%
Race, ethnicity, and origin ACS 2023
- Neighborhood character
- Predominantly Black (89%)
- Race & ethnicity
- Black 89% Hispanic / Latino 5% Two or more races 4% White 3%
- Foreign-born
- 9% · Canada
- Languages at home
- 88% English-only · Spanish 6% French/Haitian/Cajun 1%
Political lean MEDSL · Fulton
- 2024 margin
- Solid D (+44.9) · D 71.9% · R 27.0% · Other 1.1%
- 2008→2024 swing
- +9.8pp toward D · 2008: 35.0pp · 2024: 44.9pp
- All cycles
- 2024: D+44.9 2020: D+46.4 2016: D+42.1 2012: D+29.6 2008: D+35.0
Not yet ingested
- Civics
- —
Market trends
- HPI YoY
- ▲ 18.01%
- Current HPI
- 407.99
- Rent YoY
- ▲ 0.95%
- Metro
- Atlanta-Sandy Springs-Alpharetta, GA
- State GDP YoY
- ▲ 2.66%
- F500 in state
- 28
Industry mix (Fortune 500 HQ in GA)
| Industry | F500 HQs | Revenue |
|---|---|---|
| Paper / Packaging | 2 | $29B |
|
||
| Retail | 1 | $160B |
|
||
| Transportation / Logistics | 1 | $91B |
|
||
| Airlines | 1 | $62B |
|
||
| Consumer Goods | 1 | $47B |
|
||
| Utilities | 1 | $25B |
|
||
Price history
+34.2% since first listed11 events — show timeline
- 2026-05-15 Pending — GAMLS
- 2026-05-12 Pending — GAMLS
- 2026-04-24 Listed $240,000 GAMLS
- 2024-07-22 Listing Removed — FMLS
- 2024-07-22 Listing Removed — GAMLS
- 2024-07-02 Listed $315,000 FMLS
- 2024-07-02 Listed $315,000 GAMLS
- 2017-12-29 Sold (MLS) $181,100 GAMLS
- 2017-11-26 Pending — GAMLS
- 2017-11-08 Price Changed $181,900 GAMLS
- 2017-09-19 Listed $178,900 GAMLS
Property tax history
+9.1%/yrLatest (2025): $2,388 · +3.7% YoY. Source: county tax records.
Cash-flow waterfall
monthlySold comps — $/sqft
last 12 mo · ≤1 miLoading sold comps…