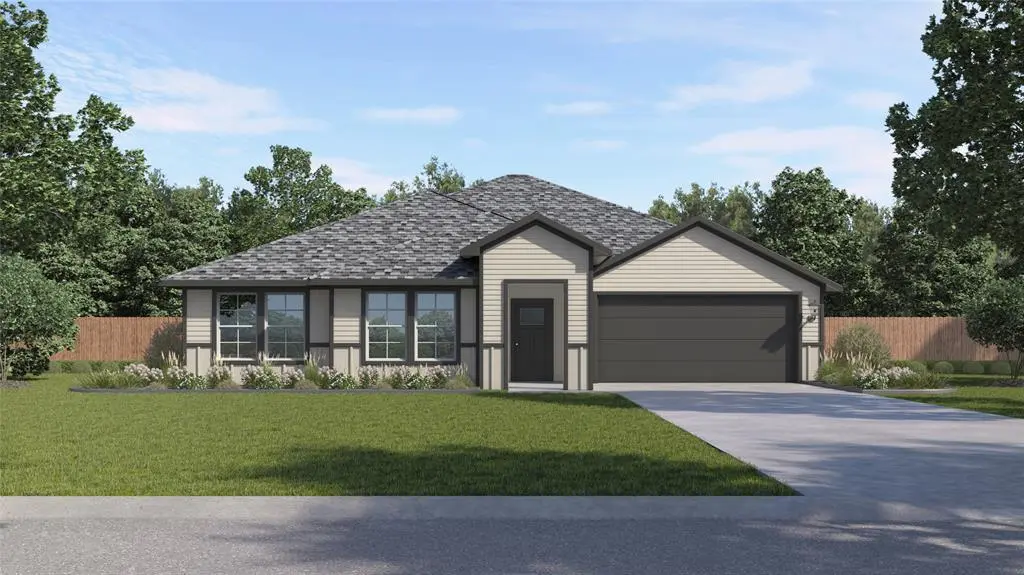
503 Northern Red Dr · Nevada, TX
Flood risk 7/10 · Major
- FEMA flood zone
- X (unshaded)
- Chance of flooding over 30 yrs
- 0.99%
- Est. flood insurance / yr
- $507 – $1,088
Fire risk 7/10 · Major
- Est. fire insurance / yr
- $1,222 – $2,270
Heat risk 7/10 · Major
- Hot days now (above 110°F)
- 7 days/yr
- Hot days in 30 yrs
- 23 days/yr
Wind risk 6/10 · Moderate
- Chance of severe wind over 30 yrs
- 27.0%
Air-quality risk 2/10 · Minimal
- Unhealthy air days now
- 2 days/yr
- Unhealthy air days in 30 yrs
- 2 days/yr
Risk factors via First Street. Map © Google.
Why this score? — see what drove the D grade
The composite is a weighted blend of 9 inputs, each scored 0–100. Each bar is that input's sub-score; the figure is the points it added to the 100-point composite (weight × sub-score).
- ARV discount +10.0/15.0
- Appreciation +10.0/10.0
- Cash flow +7.1/30.0
- Condition / age +4.8/5.0
- Schools +3.2/10.0
- Livability +3.2/5.0
- Rent growth +2.5/5.0
- 1% rule +2.1/10.0
- DSCR +1.3/10.0
$277,490
🖨 Deal sheet (PDF) 📄 Offer letter ✓ Due diligence
Listing remarks
Beautiful open concept 4 2 Farmhouse with 2 car garage. Split bedroom layout great for families and primary bedroom features a VERY large walk in closet. Come tour this home is won't last long!
Key facts
- 8,973 sq ft lot
- 2 garage spots
- Built 2026
Property features AI
Finance
- Other: Located in Collin County, United States
- Financial info: Treat as clear loan type; No second mortgage reported; Special listing condition: Builder
- HOA & community: Mandatory association; Semi-annual HOA fee ($275); HOA covers full use of facilities; HOA managed by Assured Management
Exterior
- Parking: Covered parking for 2 vehicles; Driveway; Attached 2-car garage (approx. 18' x 20')
- Utilities: MUD water; MUD sewer
- Home design: Single family residence; Residential property; One story; New construction (built 2026)
- Construction: Year built 2026; No smart home features listed
- Exterior features: Lot under 0.5 acre (approx. 0.206 acres); Subdivision: Waverly Estates
Interior
- Kitchen: Electric oven; Microwave; Dishwasher; Garbage disposal
- Bedrooms: 4 bedrooms (all on main level); Primary bedroom on main level, approx. 14 x 16; Three additional bedrooms on main level, each approx. 11 x 10
- Bathrooms: 2 full bathrooms
- Heating & cooling: Natural gas heating; Electric cooling
- Interior features: High speed internet available; 7 total rooms; One-level layout; 1 living area; 1 dining area
- Laundry & utility: No specific laundry equipment listed
Neighborhood map
What this means for you Summary
Snapshot
- This is a 4-bed/2.0-bath single-family listed at $277k. Condition is rated excellent.
Deal economics
- At list price, monthly cash flow is $-465 ($-6k/yr) — negative.
- To cash-flow at today's rent, offer at most $210k (24.3% below list).
- To meet the 1% rule (rent ≥ 1% of price), the offer needs to be $198k (28.6% below list).
- Recommended offer: $198k (28.6% below list) — sets the bar for 1% rule.
- Cap rate 4.6% vs local median 1.9% in Nevada — top-decile yield for the area; either an underpriced asset or a hidden risk that comps aren't pricing in. Stress-test before assuming the spread holds.
Location & tenants
- Location reads 63/100 on livability (#881 in TX) — a middle-class / working-renter tenant base. Strengths: employment A+, housing A+, crime A; Watch: amenities F, commute F, health & safety F.
- Community ISD (rural): math 30% / reading 38% proficiency, ranked #479 of 826 in TX (top 58%) — families likely to look elsewhere, expect single-tenant / working-renter base with shorter leases.
- Zoned schools: Leland E Edge Middle (math 25% / reading 35%, grade F, #1,056 of 1,662 statewide, top 65%, 931 students, 53% FRL) — zoned schools average 53% FRL vs 36% district-wide (18 pts higher); higher-poverty schools than district average — tighter screening recommended.
- Market conditions: 421 active listings in the ZIP; 5 comparable units currently listed for rent nearby; rentals at typical pace (median 27d on market — plan ~3-4 weeks tenant-placement turnaround); 40% of comp listings sitting > 30 days — soft ceiling on asking rent; 19,194 units permitted in Collin County in 2024 (3,988 in 5+ unit buildings).
Forward outlook
- In year one you build about $30k of equity ($2k loan paydown + $28k appreciation (10.0% local appreciation)).
- Collin County population projected at +60% by 2050 — long-run rental-demand tailwind backs the buy-and-hold thesis.
- By year 2, paydown + projected appreciation supports a ~$48k cash-out refi (75% LTV) — recoverable capital for the next deal without selling this one.
Negotiation context
- Only 12 days on market — expect competitive offers; lowballing is unlikely to land.
Risks & watch-outs
- Watch-outs: flood insurance adds $66/mo.
- Climate carrying-cost: major flood risk; major wind risk, 27% chance of damaging wind over 30y; major wildfire risk; extreme-heat days projected 7→23/yr by 2055 (HVAC capex compounding) — expect insurance premiums to compound above CPI over the hold.
Questions for the listing agent
- What do current leases actually rent for vs. the listed asking? Can we see a recent rent roll and the last 12 months of T-12 income?
- What's the actual annual flood-insurance premium (NFIP or private), and is the property in a SFHA with mandatory coverage?
- What does the HOA fee cover, when was the last increase, and are there any pending special assessments or reserve-fund shortfalls?
- Is there a deadline driving the sale (1031 exchange, divorce, estate, relocation)? That informs how much negotiation room exists.
- The area grade is low — what's the realistic commute time and amenity access for the typical tenant pool here? Any planned neighborhood developments (good or bad) we should know about?
- What's the average days-on-market for RENTAL listings here right now (not sales)? A rising rental-DOM trend means longer vacancies and softer asking-rent achievability than the comps imply.
- What's the recent tenant-quality profile in this submarket — average credit score on applications, eviction rate, late-payment / NSF rate, and stable-employment percentage? A property-management company in the area should have these aggregated.
- How much new for-sale + rental construction is in the pipeline within 1–3 miles? Heavy new supply typically softens prices + rents 12–24 months out; constrained supply supports both.
Investment metrics
- 1% rule
- 0.71% ✗
- Cap rate
- 4.57%
- Cash-on-cash
- -6.16%
- DSCR
- 0.73
- GRM
- 11.7
CMA / ARV
- ARV (median comp)
- $294,060
- List price
- $277,490
- Delta
- -5.63%
- Verdict
- FAIR
- Comps
- 20 within 1.0 mi
Show comp detail 12 sales within ~0.75 mi
| Address | Dist | Beds/Ba | Sqft | Sold | Price | $/sf | Match |
|---|---|---|---|---|---|---|---|
| 504 Gooseberry Dr | 0.12mi | 4/2.0 | 1,801 (-6%) | 4mo | $259,990 | $144 | 81 |
| 502 Gooseberry Dr | 0.12mi | 4/2.0 | 2,024 (+6%) | 5mo | $295,990 | $146 | 81 |
| 507 Saddle Blanket Dr | 0.12mi | 4/2.0 | 2,024 (+6%) | 5mo | $320,990 | $159 | 81 |
| 509 Silver Birch Dr | 0.12mi | 4/2.0 | 2,024 (+6%) | 6mo | $299,990 | $148 | 80 |
| 511 Silver Birch Dr | 0.12mi | 4/2.0 | 1,801 (-6%) | 7mo | $310,490 | $172 | 79 |
| 510 Silver Birch Dr | 0.12mi | 4/3.0 | 2,034 (+6%) | 3mo | $285,990 | $141 | 78 |
| 410 Silver Birch Dr | 0.12mi | 4/2.0 | 1,801 (-6%) | 9mo | $303,990 | $169 | 77 |
| 503 Silver Birch Dr | 0.12mi | 4/3.0 | 2,034 (+6%) | 8mo | $297,490 | $146 | 74 |
| 1213 Bristlecone Dr | 0.12mi | 4/2.0 | 1,655 (-14%) | 2mo | $263,990 | $160 | 70 |
| 508 Gooseberry Dr | 0.12mi | 4/2.0 | 1,655 (-14%) | 6mo | $296,990 | $179 | 67 |
| 510 English Oak Dr | 0.12mi | 4/2.0 | 1,655 (-14%) | 8mo | $280,490 | $169 | 66 |
| 515 Hubbard Cir | 0.48mi | 3/2.0 (-1) | 1,820 (-5%) | 0mo | $425,000 | $234 | 64 |
Match score weights: distance 35% · size 25% · config 20% · recency 20%. Top-matched comps best support the ARV.
Projected returns pro-forma
10.0% appreciation · 3.0% rent growth · sell at horizon
- IRR
- 19.2%
- Equity multiple
- 2.57×
- Total profit
- $121,608
- Equity at exit
- $249,985
- IRR
- 17.7%
- Equity multiple
- 5.91×
- Total profit
- $381,606
- Equity at exit
- $539,102
Cash invested: $77,697 (down + closing). Projections, not guarantees.
Landlord ↔ Tenant lean methodology
- Overall (STATE)
- 87 Strongly Landlord-Friendly
- State Texas
- 87 Strongly Landlord-Friendly · R+5
- County
- — inherits STATE
- City
- — inherits STATE
ZIP-level market 75173
- Home prices YoY
- 3.1%
- Active inventory
- 421
- Price-to-rent
- 11.7×
Monthly cashflow live
- Estimated rent
- $1,981 high interval (Pro) →
- Mortgage (P&I)
- −$1,455
- Tax est. 1.5%
- −$347 /mo · $4,162/yr
- Insurance
- −$116
- Flood insurance flood zone
- −$66 /mo · $798/yr
- HOA
- −$46
- Vacancy / Maint / Mgmt
- −$416
- Net cashflow
- $-465
Break-even live
Sensitivity live
| Price | -10% $-273 | -5% $-369 | +0% $-465 | +5% $-561 | +10% $-657 |
|---|---|---|---|---|---|
| Rent | -10% $-622 | -5% $-543 | +0% $-465 | +5% $-387 | +10% $-309 |
| Rate | -1.0pp $-325 | -0.5pp $-394 | base $-465 | +0.5pp $-537 | +1.0pp $-610 |
UW: 25.0% down · 7.5% · 30yr · 1.5% tax · 5.0% vac · 8.0% maint · 8.0% mgmt
Financing live
Cash to close
- Down payment
- $69,372
- Closing costs
- $8,325
- Reserves months
- —
- Total cash needed
- —
Loan-product check · same deal, 3 products live
Conventional
25% down · 7.5% · 30yr
- Down + closing
- —
- Monthly P&I
- —
- Monthly cashflow
- —
- DSCR
- —
- Eligible?
- —
Personal DTI + credit; lowest rate.
DSCR
20% down · 8.5% · 30yr
- Down + closing
- —
- Monthly P&I
- —
- Monthly cashflow
- —
- DSCR
- —
- Eligible?
- —
No personal income docs; deal must DSCR.
Hard money
10% down · 12.0% · 12mo
- Down + closing
- —
- Monthly P&I
- —
- Monthly cashflow
- —
- DSCR
- —
- Eligible?
- —
Short-term bridge; refi at stabilization.
Rent comps 5 comps
| Address | Beds | Baths | Sqft | Rent | $/sqft | DOM | Units | Dist |
|---|---|---|---|---|---|---|---|---|
| 1213 Bristlecone DR Josephine, TX | 4.0 | 2.0 | 1649 | $1,900 | $1.15 | 8d | 1 | 0.09mi |
| 831 Lexington Ln Nevada, TX | 4.0 | 2.5 | 2089 | $2,095 | $1.00 | 14d | 1 | 1.01mi |
| 6425 Mirage St Nevada, TX | 3.0 | 2.0 | 1344 | $2,050 | $1.53 | 26d | 1 | 1.06mi |
| 422 E FM 6 Nevada, TX | 5.0 | 2.0 | 1942 | $2,700 | $1.39 | 45d | 1 | 1.32mi |
| 450 Collin St Nevada, TX | 3.0 | 2.0 | 1572 | $2,000 | $1.27 | 45d | 1 | 1.47mi |
HOA detail
- Monthly dues
- $46 · $552/yr
Listing history 2 events
-
2026-05-04status Pending 194-char remark
-
2026-04-22$277,490 Active 194-char remark
ⓘ Source: listings_history table (triggers on properties + properties_extension) + one-shot
backfill from property_details.listing_events for pre-trigger history.
Climate risk First Street
- Flood 7/10 Severe FEMA zone X (unshaded) · 99% chance over 30 yrs
- Wildfire 7/10 Severe
- Heat 7/10 Severe 7 d/yr ≥110°F today · 23 d/yr by 30 yrs out
- Wind 6/10 Major 27% chance of damaging wind over 30 yrs
- Air quality 2/10 Low 2 unhealthy d/yr today · 2 by 30 yrs out
Nearby sold comps map
Loading sold comps map…
Walkable amenities ~0.75 mi
Loading nearby amenities…
Taxation est. · year 1
- Rental income
- $23,773
- − Mortgage interest
- −$15,544
- − Property taxes
- −$4,162
- − Insurance
- −$2,185
- − Repairs & maintenance
- −$1,902
- − Management
- −$1,902
- − HOA
- −$552
- − Depreciation
- −$8,072
- Taxable loss
- −$10,546
- Est. tax savings @ 24.0%
- +$2,531
- After-tax cash flow
- $-3,050/yr
For passive investors: Depreciation is non-cash, so a rental often shows a tax loss while cash-flowing — sheltering income. Rental losses are passive: they offset passive income freely, and up to $25,000/yr can offset ordinary (W-2) income if you actively participate and your MAGI is under $100k (phasing out to $0 by $150k); unused losses carry forward. On sale, claimed depreciation is recaptured at up to 25%, and gains may owe capital-gains tax (a 1031 exchange can defer both). Figures are a year-1 estimate at your 24.0% rate — not tax advice; consult a CPA.
Condition & rehab AI · 3 photos
This single-family home is in excellent condition with no visible repairs needed. It offers a beautiful open-concept layout and is move-in ready.
Value-add opportunities
- Both Painting interior walls — Fresh paint can enhance curb appeal and interior aesthetics.
- Both Landscaping improvements — Enhanced landscaping can increase curb appeal and property value.
- Resale Kitchen appliances — Modern appliances can attract more buyers and renters.
- Resale Bathroom fixtures — Upgraded fixtures can make bathrooms more appealing to potential buyers and renters.
Renovation cost estimate screening
Value-add ROI direction
- Both Painting interior walls — Fresh paint can enhance curb appeal and interior aesthetics. ↑
- Both Landscaping improvements — Enhanced landscaping can increase curb appeal and property value. ↑
- Resale Kitchen appliances — Modern appliances can attract more buyers and renters. ↑
- Resale Bathroom fixtures — Upgraded fixtures can make bathrooms more appealing to potential buyers and renters. ↑
ⓘ Cost ranges are severity-bucket heuristics (US national rule-of-thumb). Get contractor quotes + a written scope before underwriting a rehab budget.
Schools (NCES district)
- District
- Community ISD
- NCES district ID
- 4814850
- Math proficiency
- 30% ▼ -23.00%
- Reading proficiency
- 38% ▼ -11.00%
- Median HH income
- $71,841
- Composite
- 31.58/100
- National rank
- #5951
- State rank
- #479 of 826 in TX
Livability — Nevada
- Score
- 63/100
- State rank
- #881
- US rank
- #15880
Category grades
Schools grade is shown separately in the Schools card above.
Census & demographics
- Population (ZIP)
- 9,284
Population outlook (Collin County) Hauer SSP2
- Today (2025)
- 1,210,074 people
- By 2030
- 1,358,201 · +12.2%
- By 2040
- 1,654,061 · +36.7%
- By 2050
- 1,937,359 · +60.1%
- By 2075
- 2,567,039 · +112.1%
- By 2100
- 2,952,048 · +144.0%
Race, ethnicity, and origin ACS 2023
- Neighborhood character
- Majority White (65%)
- Race & ethnicity
- White 65% Hispanic / Latino 28% Two or more races 15% Black 2% Native American 1%
- Hispanic origin (detail)
- Mexican 26%
- Common ancestry
- Slovak 2% Serbian 1% Iranian 1%
- Foreign-born
- 17% · Canada, Jamaica
- Languages at home
- 74% English-only · Spanish 24% Arabic 1%
Political lean MEDSL · Collin
- 2024 margin
- R (+11.1) · D 43.1% · R 54.3% · Other 2.6%
- 2008→2024 swing
- +14.4pp toward D · 2008: -25.6pp · 2024: -11.1pp
- All cycles
- 2024: R+11.1 2020: R+4.3 2016: R+17.0 2012: R+31.6 2008: R+25.6
Not yet ingested
- Civics
- —
Market trends
- HPI YoY
- ▲ 10.09%
- Current HPI
- 331.12
- Rent YoY
- —
- Metro
- —
- State GDP YoY
- ▲ 3.95%
- F500 in state
- 110
Industry mix (Fortune 500 HQ in TX)
| Industry | F500 HQs | Revenue |
|---|---|---|
| Energy | 16 | $1,198B |
|
||
| Technology | 5 | $198B |
|
||
| Engineering / Construction | 4 | $72B |
|
||
| Energy Services | 3 | $60B |
|
||
| Utilities | 3 | $41B |
|
||
| Healthcare | 2 | $330B |
|
||
Price history
2 events — show timeline
- 2026-05-04 Pending — NTREIS
- 2026-04-22 Listed $277,490 NTREIS
Cash-flow waterfall
monthlySold comps — $/sqft
last 12 mo · ≤1 miLoading sold comps…