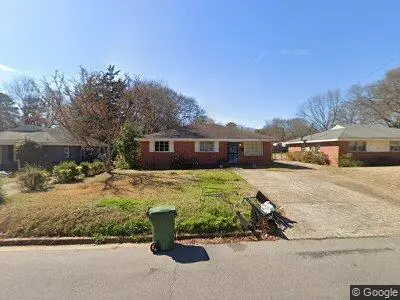
45 Marlborough St · Montgomery, AL
Flood risk 1/10 · Minimal
- FEMA flood zone
- X (unshaded)
- Chance of flooding over 30 yrs
- 0.0%
- Est. flood insurance / yr
- $507 – $1,088
Fire risk 1/10 · Minimal
- Est. fire insurance / yr
- $916 – $1,700
Heat risk 8/10 · Major
- Hot days now (above 107°F)
- 7 days/yr
- Hot days in 30 yrs
- 20 days/yr
Wind risk 8/10 · Major
- Chance of severe wind over 30 yrs
- 80.0%
Air-quality risk 3/10 · Minor
- Unhealthy air days now
- 4 days/yr
- Unhealthy air days in 30 yrs
- 4 days/yr
Risk factors via First Street. Map © Google.
Why this score? — see what drove the C grade
The composite is a weighted blend of 9 inputs, each scored 0–100. Each bar is that input's sub-score; the figure is the points it added to the 100-point composite (weight × sub-score).
- Cash flow +26.9/30.0
- DSCR +9.3/10.0
- 1% rule +6.1/10.0
- ARV discount +3.2/15.0
- Rent growth +3.2/5.0
- Livability +3.2/5.0
- Condition / age +2.5/5.0
- Schools +1.7/10.0
- Appreciation +0.0/10.0
$115,000
🖨 Deal sheet 📄 Offer letter ✓ Due diligence
Listing remarks MLS
Wonderful cozy home in desirable Montgomery Terrace. Easy care exterior with vinyl fascia. Great backyard area with beautiful Magnolia tree and lots of shade. Really nice kitchen overlooking pretty back yard, super large linen closet in hall, Gaslight post outside, and probably hardwoods under wall to wall carpeting. Outside storage in patio area is air conditioned and could be workout room also. Back storage at back of yard.
Key facts
- New floors
- New water heater
- Privacy fence
Tags
Neighborhood map
What this means for you Summary
Snapshot
- This is a 3-bed/2.0-bath single-family listed at $115k.
Deal economics
- At list price, monthly cash flow is $320 ($4k/yr) — positive.
- The deal already cash-flows at list — no discount required.
- Meets the 1% rule at list price ($1k rent vs $115k).
- Cap rate 9.6% vs local median 6.0% in Montgomery — top-decile yield for the area; either an underpriced asset or a hidden risk that comps aren't pricing in. Stress-test before assuming the spread holds.
Location & tenants
- Location reads 65/100 on livability (#138 in AL) — a middle-class / working-renter tenant base. Strengths: cost of living A+, housing A+; Watch: schools C-, employment D, crime F.
- Montgomery County (urban): math 9% / reading 31% proficiency, ranked #106 of 129 in AL (top 82%) — low school quality limits family demand, transient renter base, plan for 1-2y turnover; 70% free/reduced lunch — lower-income household profile, screen leases tightly.
- Market conditions: Rents rising (+2.6%/yr); 207 active listings in the ZIP; 40 comparable units currently listed for rent nearby; rentals at typical pace (median 21d on market — plan ~3-4 weeks tenant-placement turnaround); 42% of comp listings sitting > 30 days — soft ceiling on asking rent; 460 units permitted in Montgomery County in 2024 (37 in 5+ unit buildings).
Forward outlook
- Local home prices are declining (-3.0%/yr); year-one equity from $795 of loan paydown is wiped out by about $3k of value loss. Plan a longer hold.
- Montgomery County population projected to shrink 8% by 2050 — rents likely to lag national; underwrite the cash flow, not the appreciation.
- At projected returns (-3.0% appreciation + 2.6% rent growth), your $32k cash investment doubles in ~10 years — after that, you're playing with house money.
Negotiation context
- Only 1 days on market — expect competitive offers; lowballing is unlikely to land.
- 3 sale attempts since 26y ago with the ask held roughly flat each time — persistent listings suggest the price (not the market) is what's stuck; bring a comps-based counter.
- Current owner paid $90k; 28% above their basis — modest negotiation headroom, anchor on the comps not their cost.
Risks & watch-outs
- Watch-outs: built in 1955 — expect roof / HVAC / electrical / plumbing capex.
- Climate carrying-cost: severe wind risk, 80% chance of damaging wind over 30y; extreme-heat days projected 7→20/yr by 2055 (HVAC capex compounding) — expect insurance premiums to compound above CPI over the hold.
Questions for the listing agent
- Built in 1955 — when were the roof, HVAC, electrical panel, plumbing, and water heater last replaced?
- Is there a deadline driving the sale (1031 exchange, divorce, estate, relocation)? That informs how much negotiation room exists.
- Crime grade is F in this area — have there been break-ins, vandalism, or insurance claims at this property in the last 3 years? What carrier currently insures it and at what premium?
- What's the average days-on-market for RENTAL listings here right now (not sales)? A rising rental-DOM trend means longer vacancies and softer asking-rent achievability than the comps imply.
- What's the recent tenant-quality profile in this submarket — average credit score on applications, eviction rate, late-payment / NSF rate, and stable-employment percentage? A property-management company in the area should have these aggregated.
- How much new for-sale + rental construction is in the pipeline within 1–3 miles? Heavy new supply typically softens prices + rents 12–24 months out; constrained supply supports both.
Investment metrics
- 1% rule
- 1.11% ✓
- Cap rate
- 9.63%
- Cash-on-cash
- 11.92%
- DSCR
- 1.53
- GRM
- 7.5
CMA / ARV
- ARV (on-the-fly)
- $104,960
- Comps found
- 12
Show comp detail 12 sales within ~0.75 mi
| Address | Dist | Beds/Ba | Sqft | Sold | Price | $/sf | Match |
|---|---|---|---|---|---|---|---|
| 3 Kent St | 0.07mi | 3/2.0 | 1,305 (-0%) | 1mo | $102,750 | $79 | 95 |
| 45 Kent St | 0.07mi | 3/1.0 | 1,338 (+2%) | 3mo | $94,000 | $70 | 87 |
| 47 Salem Dr | 0.06mi | 3/2.0 | 1,419 (+8%) | 3mo | $162,500 | $115 | 81 |
| 127 Salem Dr | 0.13mi | 3/1.0 | 1,391 (+6%) | 1mo | $118,000 | $85 | 79 |
| 508 Forest Hills Dr | 0.46mi | 3/2.0 | 1,267 (-3%) | 1mo | $55,500 | $44 | 72 |
| 3518 N Wareingwood Dr | 0.55mi | 3/1.0 | 1,269 (-3%) | 3mo | $119,500 | $94 | 63 |
| 238 Easthaven Rd | 0.51mi | 3/2.0 | 1,188 (-10%) | 5mo | $77,900 | $66 | 56 |
| 3556 N Wareingwood Dr | 0.66mi | 3/1.0 | 1,215 (-7%) | 3mo | $71,500 | $59 | 50 |
| 137 Oak Forest Dr | 0.57mi | 2/1.0 (-1) | 1,183 (-10%) | 0mo | $47,000 | $40 | 48 |
| 3515 Pelzer Ave | 0.56mi | 2/1.0 (-1) | 1,194 (-9%) | 4mo | $110,000 | $92 | 46 |
| 3558 S Georgetown Dr | 0.70mi | 3/2.0 | 1,507 (+15%) | 1mo | $142,000 | $94 | 42 |
| 2318 Winona Ave | 0.63mi | 2/1.0 (-1) | 1,118 (-15%) | 2mo | $89,000 | $80 | 35 |
Match score weights: distance 35% · size 25% · config 20% · recency 20%. Top-matched comps best support the ARV.
Projected returns pro-forma
-3.0% appreciation · 2.65% rent growth · sell at horizon
- IRR
- 1.0%
- Equity multiple
- 1.04×
- Total profit
- $1,239
- Equity at exit
- $17,147
- IRR
- 10.3%
- Equity multiple
- 1.79×
- Total profit
- $25,295
- Equity at exit
- $9,943
Cash invested: $32,200 (down + closing). Projections, not guarantees.
Landlord ↔ Tenant lean methodology
- Overall (STATE)
- 90 Strongly Landlord-Friendly
- State Alabama
- 90 Strongly Landlord-Friendly · R+15
- County
- — inherits STATE
- City
- — inherits STATE
ZIP-level market 36109
- Home prices YoY
- -20.1%
- Rents YoY
- 2.6%
- Active inventory
- 207
- Price-to-rent
- 7.5×
Monthly cashflow live
- Estimated rent
- $1,278 high interval (Pro) →
- Mortgage (P&I)
- −$603
- Tax from tax record
- −$39 /mo · $463/yr
- Insurance
- −$48
- HOA
- −$0
- Vacancy / Maint / Mgmt
- −$268
- Net cashflow
- $320
Break-even live
UW: 25.0% down · 7.5% · 30yr · 1.5% tax · 5.0% vac · 8.0% maint · 8.0% mgmt
Financing live
Cash to close
- Down payment
- $28,750
- Closing costs
- $3,450
- Reserves months
- —
- Total cash needed
- —
Loan-product check · same deal, 3 products live
Conventional
25% down · 7.5% · 30yr
- Down + closing
- —
- Monthly P&I
- —
- Monthly cashflow
- —
- DSCR
- —
- Eligible?
- —
Personal DTI + credit; lowest rate.
DSCR
20% down · 8.5% · 30yr
- Down + closing
- —
- Monthly P&I
- —
- Monthly cashflow
- —
- DSCR
- —
- Eligible?
- —
No personal income docs; deal must DSCR.
Hard money
10% down · 12.0% · 12mo
- Down + closing
- —
- Monthly P&I
- —
- Monthly cashflow
- —
- DSCR
- —
- Eligible?
- —
Short-term bridge; refi at stabilization.
Rent comps 40 comps
| Address | Beds | Baths | Sqft | Rent | $/sqft | DOM | Units | Dist |
|---|---|---|---|---|---|---|---|---|
| 167 E Salem Dr Montgomery, AL | 3.0 | 2.0 | 1700 | $1,050 | $0.62 | 43d | 1 | 0.20mi |
| 200 Eton Rd Montgomery, AL | 3.0 | 1.5 | 1500 | $895 | $0.60 | 13d | 1 | 0.21mi |
| 108 Calhoun Rd Unit 108B Montgomery, AL | 2.0 | 1.0 | 1350 | $750 | $0.56 | 43d | 1 | 0.21mi |
| 67 Holliday Dr Montgomery, AL | 3.0 | 1.0 | 1156 | $1,200 | $1.04 | 43d | 1 | 0.22mi |
| 186 E Salem Dr Montgomery, AL | 3.0 | 1.0 | 1040 | $1,195 | $1.15 | 21d | 1 | 0.24mi |
| 7 Calhoun Rd Unit B Montgomery, AL | 2.0 | 1.0 | 961 | $850 | $0.88 | 43d | 1 | 0.29mi |
| 3105 Pelzer Ave Montgomery, AL | 4.0 | 2.0 | 1605 | $1,425 | $0.89 | 43d | 1 | 0.30mi |
| 3319 Willow Lane Dr Montgomery, AL | 3.0 | 2.0 | 1032 | $1,200 | $1.16 | 43d | 1 | 0.36mi |
| 18 Oak Forest Dr Montgomery, AL | 3.0 | 2.0 | 1580 | $1,050 | $0.66 | 21d | 1 | 0.42mi |
| 7 Bradley Dr Montgomery, AL | 3.0 | 2.0 | 1529 | $1,500 | $0.98 | 13d | 1 | 0.43mi |
| 2769 Pelzer Ave Montgomery, AL | 3.0 | 2.0 | 1608 | $1,325 | $0.82 | 43d | 1 | 0.43mi |
| 2814 Ashley Ave Montgomery, AL | 3.0 | 2.0 | 1683 | $1,350 | $0.80 | 13d | 1 | 0.44mi |
| 3329 Vermont Dr Montgomery, AL | 3.0 | 1.5 | 1465 | $1,395 | $0.95 | 13d | 1 | 0.45mi |
| 15 Bradley Dr Montgomery, AL | 3.0 | 2.0 | 1365 | $1,500 | $1.10 | 21d | 1 | 0.45mi |
| 3334 Cottonwood Dr Montgomery, AL | 3.0 | 2.0 | 1025 | $1,295 | $1.26 | 13d | 1 | 0.45mi |
| 239 Forest Hills Dr Montgomery, AL | 4.0 | 1.5 | 1500 | $1,450 | $0.97 | 21d | 1 | 0.46mi |
| 3515 Cottonwood Dr Montgomery, AL | 3.0 | 1.5 | 1246 | $1,350 | $1.08 | 43d | 1 | 0.55mi |
| 401 Ridgewood Ln Montgomery, AL | 3.0 | 2.0 | 1513 | $1,195 | $0.79 | 21d | 1 | 0.56mi |
| 2822 Sumter Ave Montgomery, AL | 3.0 | 2.5 | 1617 | $1,300 | $0.80 | 21d | 1 | 0.56mi |
| 122 Oak Forest Dr Montgomery, AL | 3.0 | 1.0 | 1092 | $975 | $0.89 | 21d | 1 | 0.58mi |
| 3233 Hillcrest Ln Montgomery, AL | 3.0 | 2.0 | 1278 | $1,395 | $1.09 | 21d | 1 | 0.64mi |
| 2310 Yancey Ave Montgomery, AL | 3.0 | 1.0 | 1212 | $1,250 | $1.03 | 43d | 1 | 0.66mi |
| 2243 Winona Ave Montgomery, AL | 3.0 | 1.0 | 1492 | $1,225 | $0.82 | 21d | 1 | 0.71mi |
| 3462 Biltmore Ave Montgomery, AL | 3.0 | 2.0 | 1685 | $1,225 | $0.73 | 21d | 1 | 0.73mi |
| 118 Nottingham Ct Montgomery, AL | 3.0 | 2.0 | 1344 | $1,275 | $0.95 | 43d | 1 | 0.75mi |
| 700 Coliseum Blvd Unit 700D Montgomery, AL | 2.0 | 1.0 | 911 | $895 | $0.98 | 43d | 1 | 0.77mi |
| 311 Bradley Dr Montgomery, AL | 3.0 | 1.0 | 1104 | $825 | $0.75 | 43d | 1 | 0.77mi |
| 2229 Madison Ave Montgomery, AL | 2.0 | 1.0 | 1100 | $625 | $0.57 | 43d | 1 | 0.79mi |
| 3309 Hillcrest Ln Unit 1043908P Montgomery, AL | 4.0 | 2.0 | 1625 | $2,885 | $1.78 | 21d | 1 | 0.80mi |
| 2122 Windsor Ave Montgomery, AL | 2.0 | 1.0 | 1052 | $725 | $0.69 | 43d | 1 | 0.82mi |
| 3602 Little John Dr Montgomery, AL | 4.0 | 1.0 | 1286 | $1,400 | $1.09 | 21d | 1 | 0.90mi |
| 740 Coliseum Blvd Unit 740A Montgomery, AL | 2.0 | 1.0 | 1100 | $895 | $0.81 | 13d | 1 | 0.91mi |
| 610 S Georgetown Dr Unit 1386555P Montgomery, AL | 3.0 | 1.0 | 1474 | $3,635 | $2.47 | 13d | 1 | 0.91mi |
| 2023 Windsor Ave Montgomery, AL | 2.0 | 1.0 | 889 | $895 | $1.01 | 43d | 1 | 0.93mi |
| 1324 Federal Dr Montgomery, AL | 2.0 | 1.0 | 1000 | $1,100 | $1.10 | 43d | 1 | 0.93mi |
| 107 Dalraida Rd Unit A Montgomery, AL | 3.0 | 2.0 | 1237 | $1,200 | $0.97 | 43d | 1 | 0.95mi |
| 2009 Yancey Ave Montgomery, AL | 3.0 | 1.0 | 1140 | $1,080 | $0.95 | 21d | 1 | 0.96mi |
| 942 Parkwood Ct Montgomery, AL | 4.0 | 2.0 | 1752 | $1,299 | $0.74 | 13d | 1 | 0.98mi |
| 804 Hillman St Montgomery, AL | 3.0 | 2.0 | 1370 | $1,295 | $0.95 | 13d | 1 | 0.99mi |
| 804 Hillman St Montgomery, AL | 3.0 | 2.0 | 1356 | $1,295 | $0.96 | 21d | 1 | 0.99mi |
Listing history 7 events
-
2026-05-26$115,000 Active
-
2021-07-14soldstatus $90,000
-
2006-08-16soldstatus $87,584
-
2006-08-04soldstatus $83,500 429-char remark
Show marketing remark (429 chars)
Wonderful cozy home in desirable Montgomery Terrace. Easy care exterior with vinyl fascia. Great backyard area with beautiful Magnolia tree and lots of shade. Really nice kitchen overlooking pretty back yard, super large linen closet in hall, Gaslight post outside, and probably hardwoods under wall to wall carpeting. Outside storage in patio area is air conditioned and could be workout room also. Back storage at back of yard.
-
2006-07-17$85,900 429-char remark
Show marketing remark (429 chars)
Wonderful cozy home in desirable Montgomery Terrace. Easy care exterior with vinyl fascia. Great backyard area with beautiful Magnolia tree and lots of shade. Really nice kitchen overlooking pretty back yard, super large linen closet in hall, Gaslight post outside, and probably hardwoods under wall to wall carpeting. Outside storage in patio area is air conditioned and could be workout room also. Back storage at back of yard.
-
2000-07-31soldstatus $76,000 143-char remark
Show marketing remark (143 chars)
ONE SOURCE LISTING! THIS IS A DOLL HOUSE. 3 BED, 2 BATH. NICE EAT IN KITCHEN. BIG COVERED PATIO. YARD IS LIKE GARDEN. YOU HAVE TO SEE THIS ONE
-
2000-05-19$79,900 143-char remark
Show marketing remark (143 chars)
ONE SOURCE LISTING! THIS IS A DOLL HOUSE. 3 BED, 2 BATH. NICE EAT IN KITCHEN. BIG COVERED PATIO. YARD IS LIKE GARDEN. YOU HAVE TO SEE THIS ONE
ⓘ Source: listings_history table (triggers on properties + properties_extension) + one-shot
backfill from property_details.listing_events for pre-trigger history.
Tax reassessment forecast AL · Resets to sale price
- Current annual tax
- $463 · $39/mo
- Projected year-2 tax
- $472 · $39/mo
- Expected delta
- +$8/yr (+$1/mo · 1.7%)
ⓘ Screening estimate from a state-policy table — verify with the county assessor before closing.
Climate risk First Street
- Flood 1/10 Low FEMA zone X (unshaded) · 0% chance over 30 yrs
- Wildfire 1/10 Low
- Heat 8/10 Severe 7 d/yr ≥107°F today · 20 d/yr by 30 yrs out
- Wind 8/10 Severe 80% chance of damaging wind over 30 yrs
- Air quality 3/10 Moderate 4 unhealthy d/yr today · 4 by 30 yrs out
Nearby sold comps map
Loading sold comps map…
Walkable amenities ~0.75 mi
Loading nearby amenities…
Taxation est. · year 1
- Rental income
- $15,333
- − Mortgage interest
- −$6,442
- − Property taxes
- −$463
- − Insurance
- −$575
- − Repairs & maintenance
- −$1,227
- − Management
- −$1,227
- − Depreciation
- −$3,345
- Taxable income
- $2,054
- Est. tax owed @ 24.0%
- −$493
- After-tax cash flow
- $3,345/yr
For passive investors: Depreciation is non-cash, so a rental often shows a tax loss while cash-flowing — sheltering income. Rental losses are passive: they offset passive income freely, and up to $25,000/yr can offset ordinary (W-2) income if you actively participate and your MAGI is under $100k (phasing out to $0 by $150k); unused losses carry forward. On sale, claimed depreciation is recaptured at up to 25%, and gains may owe capital-gains tax (a 1031 exchange can defer both). Figures are a year-1 estimate at your 24.0% rate — not tax advice; consult a CPA.
Schools (NCES district)
- District
- Montgomery County
- NCES district ID
- 0102430
- Math proficiency
- 9% ▼ -21.00%
- Reading proficiency
- 31% ▼ -1.00%
- Median HH income
- $43,902
- Composite
- 17.24/100
- National rank
- #9093
- State rank
- #106 of 129 in AL
Livability — Montgomery
- Score
- 65/100
- State rank
- #138
- US rank
- #13416
Category grades
Schools grade is shown separately in the Schools card above.
Census & demographics
- Census place
- Montgomery, AL
- County
- Montgomery County · 190,016 people
- City population
- 175,913
- Metro
- Montgomery, AL
- Population (ZIP)
- 23,581
- Household income
- $59,193
- Rent vs Own
- Severe rent burden
- 1039.0
Population outlook (Montgomery County) Hauer SSP2
- Today (2025)
- 224,008 people
- By 2030
- 221,460 · -1.1%
- By 2040
- 214,179 · -4.4%
- By 2050
- 204,912 · -8.5%
- By 2075
- 177,821 · -20.6%
- By 2100
- 145,134 · -35.2%
Race, ethnicity, and origin ACS 2023
- Neighborhood character
- Diverse neighborhood (Simpson 0.60)
- Race & ethnicity
- White 49% Black 39% Hispanic / Latino 8% Two or more races 4%
- Hispanic origin (detail)
- Mexican 4%
- Common ancestry
- Slovak 2% Lithuanian 1% Serbian 1%
- Foreign-born
- 4% · Canada, South Korea
- Languages at home
- 94% English-only · Spanish 5%
Political lean MEDSL · Montgomery
- 2024 margin
- Solid D (+30.7) · D 64.8% · R 34.1% · Other 1.1%
- 2008→2024 swing
- +11.5pp toward D · 2008: 19.2pp · 2024: 30.7pp
- All cycles
- 2024: D+30.7 2020: D+31.5 2016: D+26.2 2012: D+24.3 2008: D+19.2
Not yet ingested
- Civics
- —
Market trends
- HPI YoY
- ▼ -37.64%
- Current HPI
- 149.3867
- Rent YoY
- ▲ 2.65%
- Metro
- Montgomery, AL
- State GDP YoY
- ▲ 2.94%
- F500 in state
- 4
Industry mix (Fortune 500 HQ in AL)
| Industry | F500 HQs | Revenue |
|---|---|---|
| Financial Services | 1 | $8B |
|
||
| Healthcare | 1 | $5B |
|
||
Price history
+43.9% since first listed7 events — show timeline
- 2026-05-26 Listed $115,000 FSBO.com
- 2021-07-14 Sold (Public Records) $90,000 Public Records
- 2006-08-16 Sold (Public Records) $87,584 Public Records
- 2006-08-04 Sold (MLS) $83,500 MAAR
- 2006-07-17 Listed $85,900 MAAR
- 2000-07-31 Sold (MLS) $76,000 MAAR
- 2000-05-19 Listed $79,900 MAAR
Property tax history
+5.8%/yrLatest (2025): $463 · +4.4% YoY. Source: county tax records.
Cash-flow waterfall
monthlySold comps — $/sqft
last 12 mo · ≤1 miLoading sold comps…