8689 Larkspur Dr · Harrisburg, OH
Flood risk 1/10 · Minimal
- FEMA flood zone
- X (unshaded)
- Chance of flooding over 30 yrs
- 0.0%
- Est. flood insurance / yr
- $507 – $1,088
Fire risk 1/10 · Minimal
- Est. fire insurance / yr
- $713 – $1,323
Heat risk 3/10 · Minor
- Hot days now (above 100°F)
- 7 days/yr
- Hot days in 30 yrs
- 16 days/yr
Wind risk 2/10 · Minimal
- Chance of severe wind over 30 yrs
- 1.0%
Air-quality risk 2/10 · Minimal
- Unhealthy air days now
- 1 days/yr
- Unhealthy air days in 30 yrs
- 3 days/yr
Risk factors via First Street. Map © Google.
Why this score? — see what drove the B grade
The composite is a weighted blend of 9 inputs, each scored 0–100. Each bar is that input's sub-score; the figure is the points it added to the 100-point composite (weight × sub-score).
- Cash flow +28.0/30.0
- 1% rule +10.0/10.0
- DSCR +10.0/10.0
- ARV discount +7.5/15.0
- Schools +5.0/10.0
- Condition / age +5.0/5.0
- Livability +3.1/5.0
- Rent growth +2.5/5.0
- Appreciation +0.0/10.0
$105,000
🖨 Deal sheet (PDF) 📄 Offer letter ✓ Due diligence
Listing remarks
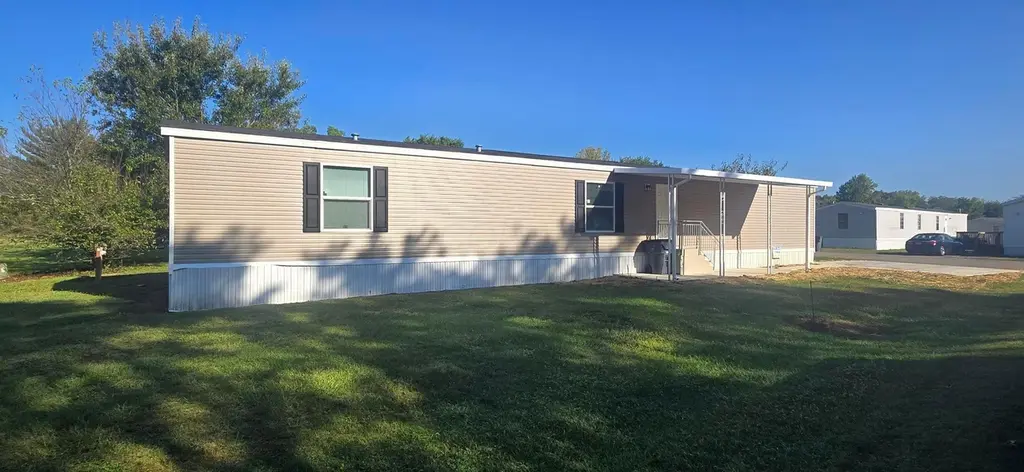
Brand-New Single-Wide Home in Foxlair Farms - 15 Minutes from Downtown Columbus! Enjoy modern, low-maintenance living in this brand-new single-wide manufactured home, located in the highly desirable Foxlair Farms Mobile Home Park in Orient, Ohio. Just 15 minutes south of downtown Columbus, this home offers the perfect blend of peaceful rural charm with convenient access to city amenities. 🏡 Home Features: Brand-new construction with contemporary finishes 5-year warranty included for added peace of mind Covered patio awning - perfect for relaxing or entertaining outdoors Low-maintenance lifestyle in a well-maintained community Whether you're downsizing, buying your first home, or looking for
Key facts
- New construction
- Foxlair farms
- Covered patio awning
Tags
Property features AI
Finance
- Other: Subdivision: Fox Lair Farms; Township: Darby
- HOA & community: Homeowners association with a $475 monthly fee
Exterior
- Utilities: Public water; Private sewer
- Home design: One-story residence; New construction (2024); Other residential without deeded land; No shared/common walls
- Construction: Built in 2024; Building area listed as 1,153 (source: floor plan)
- Exterior features: Other foundation details
Interior
- Bedrooms: Three main-level bedrooms
- Bathrooms: Two full bathrooms
- Interior features: Floor plan-based living area of 1,153
Neighborhood map
What this means for you Summary
Snapshot
- This is a 3-bed/2.0-bath single-family listed at $105k. Condition is rated excellent.
Deal economics
- At list price, monthly cash flow is $328 ($4k/yr) — positive.
- The deal already cash-flows at list — no discount required.
- Meets the 1% rule at list price ($2k rent vs $105k).
- Recommended offer: $102k (3.0% below list) — sets the bar for market timing.
Location & tenants
- Location reads 61/100 on livability (#942 in OH) — a middle-class / working-renter tenant base. Strengths: cost of living A+, housing A+, employment A-; Watch: amenities F, commute F, health & safety F.
- Westfall Local (rural): math 49% / reading 66% proficiency, ranked #304 of 656 in OH (top 46%) — acceptable for families but not a draw, mixed tenant base, ~2y average lease.
- Zoned schools: Westfall Elementary School (math 48% / reading 67%, grade C+, #721 of 1,584 statewide, top 46%, 648 students, 46% FRL); Westfall Middle School (math 55% / reading 63%, grade B, #280 of 654 statewide, top 44%, 340 students, 43% FRL); Westfall High School (math 37% / reading 67%, grade D+, #343 of 781 statewide, top 47%, 424 students, 36% FRL) — zoned schools at 42% FRL track the district average.
- Market conditions: 27 active listings in the ZIP; 312 units permitted in Pickaway County in 2024 (0 in 5+ unit buildings).
- This rent runs 31% of the median local income ($74k/yr) — at the standard rent-burdened threshold; future hikes will face affordability resistance.
Forward outlook
- Local home prices are declining (-3.0%/yr); year-one equity from $726 of loan paydown is wiped out by about $3k of value loss. Plan a longer hold.
- Pickaway County population projected at +3% by 2050 — modest demand growth; plan on rents tracking national, not racing it.
- At projected returns (-3.0% appreciation + 3.0% rent growth), your $29k cash investment doubles in ~9 years — after that, you're playing with house money.
Negotiation context
- It's been on market 54 days — a 3% lower offer ($102k) is reasonable based on typical stale-listing flexibility.
- 3 sale attempts with the ask held roughly flat each time — persistent listings suggest the price (not the market) is what's stuck; bring a comps-based counter.
Risks & watch-outs
- Watch-outs: HOA is 25% of rent.
Questions for the listing agent
- It's been on market 54 days. Have you received any prior offers? Is the seller open to a 3% concession, seller financing, or rate buy-down credit?
- What does the HOA fee cover, when was the last increase, and are there any pending special assessments or reserve-fund shortfalls?
- Is there a deadline driving the sale (1031 exchange, divorce, estate, relocation)? That informs how much negotiation room exists.
- Schools are F-rated, which usually means shorter tenancies and higher turnover. Who's the typical renter profile here, and what's been the actual vacancy rate?
- What's the average days-on-market for RENTAL listings here right now (not sales)? A rising rental-DOM trend means longer vacancies and softer asking-rent achievability than the comps imply.
- What's the recent tenant-quality profile in this submarket — average credit score on applications, eviction rate, late-payment / NSF rate, and stable-employment percentage? A property-management company in the area should have these aggregated.
- How much new for-sale + rental construction is in the pipeline within 1–3 miles? Heavy new supply typically softens prices + rents 12–24 months out; constrained supply supports both.
Investment metrics
- 1% rule
- 1.84% ✓
- Cap rate
- 10.04%
- Cash-on-cash
- 13.39%
- DSCR
- 1.60
- GRM
- 4.5
CMA / ARV
- ARV (median comp)
- $249,687
- List price
- $105,000
- Delta
- -57.95%
- Verdict
- UNDERPRICED
- Comps
- 11 within 1.0 mi
Show comp detail 1 sale within ~0.75 mi
| Address | Dist | Beds/Ba | Sqft | Sold | Price | $/sf | Match |
|---|---|---|---|---|---|---|---|
| 8660 Kanawha Dr | 0.08mi | 3/2.0 | 1,152 (-0%) | 18mo | $119,900 | $104 | 81 |
Match score weights: distance 35% · size 25% · config 20% · recency 20%. Top-matched comps best support the ARV.
Projected returns pro-forma
-3.0% appreciation · 3.0% rent growth · sell at horizon
- IRR
- 3.7%
- Equity multiple
- 1.14×
- Total profit
- $4,194
- Equity at exit
- $15,656
- IRR
- 13.4%
- Equity multiple
- 2.08×
- Total profit
- $31,852
- Equity at exit
- $9,078
Cash invested: $29,400 (down + closing). Projections, not guarantees.
Landlord ↔ Tenant lean methodology
- Overall (STATE)
- 73 Landlord-Friendly
- State Ohio
- 73 Landlord-Friendly · R+6
- County
- — inherits STATE
- City
- — inherits STATE
ZIP-level market 43146
- Home prices YoY
- -26.8%
- Active inventory
- 27
- Price-to-rent
- 4.5×
Monthly cashflow live
- Estimated rent
- $1,935 medium interval (Pro) →
- Mortgage (P&I)
- −$551
- Tax est. 1.5%
- −$131 /mo · $1,575/yr
- Insurance
- −$44
- HOA
- −$475
- Vacancy / Maint / Mgmt
- −$406
- Net cashflow
- $328
Break-even live
Sensitivity live
| Price | -10% $401 | -5% $364 | +0% $328 | +5% $292 | +10% $255 |
|---|---|---|---|---|---|
| Rent | -10% $175 | -5% $252 | +0% $328 | +5% $404 | +10% $481 |
| Rate | -1.0pp $381 | -0.5pp $355 | base $328 | +0.5pp $301 | +1.0pp $273 |
UW: 25.0% down · 7.5% · 30yr · 1.5% tax · 5.0% vac · 8.0% maint · 8.0% mgmt
Financing live
Cash to close
- Down payment
- $26,250
- Closing costs
- $3,150
- Reserves months
- —
- Total cash needed
- —
Loan-product check · same deal, 3 products live
Conventional
25% down · 7.5% · 30yr
- Down + closing
- —
- Monthly P&I
- —
- Monthly cashflow
- —
- DSCR
- —
- Eligible?
- —
Personal DTI + credit; lowest rate.
DSCR
20% down · 8.5% · 30yr
- Down + closing
- —
- Monthly P&I
- —
- Monthly cashflow
- —
- DSCR
- —
- Eligible?
- —
No personal income docs; deal must DSCR.
Hard money
10% down · 12.0% · 12mo
- Down + closing
- —
- Monthly P&I
- —
- Monthly cashflow
- —
- DSCR
- —
- Eligible?
- —
Short-term bridge; refi at stabilization.
HOA detail
- Monthly dues
- $475 · $5,700/yr
Listing history 24 events
-
2026-06-21days on market $105,000 Active 54 DOM
-
2026-06-21days on market $105,000 Active 53 DOM
-
2026-06-18days on market $105,000 Active 51 DOM
-
2026-06-17days on market $105,000 Active 50 DOM
-
2026-06-16days on market $105,000 Active 49 DOM
-
2026-06-15days on market $105,000 Active 48 DOM
-
2026-06-13days on market $105,000 Active 46 DOM
-
2026-06-12days on market $105,000 Active 45 DOM
-
2026-06-09days on market $105,000 Active 42 DOM
-
2026-06-08days on market $105,000 Active 41 DOM
-
2026-06-08days on market $105,000 Active 40 DOM
-
2026-06-05days on market $105,000 Active 38 DOM
-
2026-06-04days on market $105,000 Active 36 DOM
-
2026-06-02days on market $105,000 Active 35 DOM
-
2026-06-01days on market $105,000 Active 34 DOM
-
2026-05-31days on market $105,000 Active 33 DOM
-
2026-04-27$105,000 Active 861-char remark
-
2026-03-26historical
-
2026-02-09price $107,000
-
2026-01-15price $107,500
-
2025-09-25$108,000 Active
-
2025-07-03historical
-
2025-04-10price $121,900
-
2025-01-02$124,900 Active
ⓘ Source: listings_history table (triggers on properties + properties_extension) + one-shot
backfill from property_details.listing_events for pre-trigger history.
Climate risk First Street
- Flood 1/10 Low FEMA zone X (unshaded) · 0% chance over 30 yrs
- Wildfire 1/10 Low
- Heat 3/10 Moderate 7 d/yr ≥100°F today · 16 d/yr by 30 yrs out
- Wind 2/10 Low 100% chance of damaging wind over 30 yrs
- Air quality 2/10 Low 1 unhealthy d/yr today · 3 by 30 yrs out
Nearby sold comps map
Loading sold comps map…
Walkable amenities ~0.75 mi
Loading nearby amenities…
Taxation est. · year 1
- Rental income
- $23,219
- − Mortgage interest
- −$5,882
- − Property taxes
- −$1,575
- − Insurance
- −$525
- − Repairs & maintenance
- −$1,858
- − Management
- −$1,858
- − HOA
- −$5,700
- − Depreciation
- −$3,055
- Taxable income
- $2,768
- Est. tax owed @ 24.0%
- −$664
- After-tax cash flow
- $3,271/yr
For passive investors: Depreciation is non-cash, so a rental often shows a tax loss while cash-flowing — sheltering income. Rental losses are passive: they offset passive income freely, and up to $25,000/yr can offset ordinary (W-2) income if you actively participate and your MAGI is under $100k (phasing out to $0 by $150k); unused losses carry forward. On sale, claimed depreciation is recaptured at up to 25%, and gains may owe capital-gains tax (a 1031 exchange can defer both). Figures are a year-1 estimate at your 24.0% rate — not tax advice; consult a CPA.
Condition & rehab AI · 12 photos
This brand-new single-wide manufactured home in Foxlair Farms is move-in ready with excellent condition and no visible repairs needed. It offers a modern, low-maintenance lifestyle in a well-maintained community.
Value-add opportunities
- Both Landscaping improvements — Enhances curb appeal and adds value for both resale and rental.
- Both Painting exterior and interior walls — Fresh paint can make the home look more appealing and increase its value.
- Resale Upgrading appliances — Modern appliances can attract more buyers and renters.
- Both Adding smart home features — Smart home features can increase both resale and rental value by making the home more convenient and energy-efficient.
Renovation cost estimate screening
Value-add ROI direction
- Both Landscaping improvements — Enhances curb appeal and adds value for both resale and rental. ↑
- Both Painting exterior and interior walls — Fresh paint can make the home look more appealing and increase its value. ↑
- Resale Upgrading appliances — Modern appliances can attract more buyers and renters. ↑
- Both Adding smart home features — Smart home features can increase both resale and rental value by making the home more convenient and energy-efficient. ↑
ⓘ Cost ranges are severity-bucket heuristics (US national rule-of-thumb). Get contractor quotes + a written scope before underwriting a rehab budget.
Schools (NCES district)
- District
- Westfall Local
- NCES district ID
- 3904910
- Math proficiency
- 49% ▼ -15.00%
- Reading proficiency
- 66% ▬ 0.00%
- Median HH income
- $63,733
- Composite
- 50.25/100
- National rank
- #1891
- State rank
- #304 of 656 in OH
Livability — Harrisburg
- Score
- 61/100
- State rank
- #942
- US rank
- #18192
Category grades
Schools grade is shown separately in the Schools card above.
Census & demographics
- County
- Pickaway · 57,589 people
- City population
- 360
- Metro
- Columbus, OH
- Population (ZIP)
- 13,325
- Household income
- $73,904
- Rent vs Own
Population outlook (Pickaway County) Hauer SSP2
- Today (2025)
- 59,488 people
- By 2030
- 60,400 · +1.5%
- By 2040
- 61,498 · +3.4%
- By 2050
- 61,478 · +3.3%
- By 2075
- 59,696 · +0.3%
- By 2100
- 51,458 · -13.5%
Race, ethnicity, and origin ACS 2023
- Neighborhood character
- Predominantly White (80%)
- Race & ethnicity
- White 80% Black 11% Two or more races 6% Hispanic / Latino 3%
- Common ancestry
- Iranian 2% Slovak 1% Romanian 1%
- Foreign-born
- 2% · Canada
- Languages at home
- 97% English-only · Spanish 1% Other Indo-European 1%
Political lean MEDSL · Pickaway
- 2024 margin
- Solid R (+48.5) · D 25.3% · R 73.8%
- 2008→2024 swing
- -26.8pp toward R · 2008: -21.7pp · 2024: -48.5pp
- All cycles
- 2024: R+48.5 2020: R+47.0 2016: R+42.6 2012: R+18.7 2008: R+21.7
Not yet ingested
- Civics
- —
Market trends
- HPI YoY
- ▼ -99.05%
- Current HPI
- 271.1768
- Rent YoY
- —
- Metro
- —
- State GDP YoY
- ▲ 1.98%
- F500 in state
- 48
Industry mix (Fortune 500 HQ in OH)
| Industry | F500 HQs | Revenue |
|---|---|---|
| Insurance | 3 | $145B |
|
||
| Industrial Machinery | 3 | $49B |
|
||
| Financial Services | 3 | $24B |
|
||
| Consumer Goods | 2 | $93B |
|
||
| Aerospace / Defense | 2 | $47B |
|
||
| Utilities | 2 | $33B |
|
||
Price history
-15.9% since first listed8 events — show timeline
- 2026-04-27 Listed $105,000 CBRMLS
- 2026-03-26 Listing Removed — CBRMLS
- 2026-02-09 Price Changed $107,000 CBRMLS
- 2026-01-15 Price Changed $107,500 CBRMLS
- 2025-09-25 Listed $108,000 CBRMLS
- 2025-07-03 Listing Removed — CBRMLS
- 2025-04-10 Price Changed $121,900 CBRMLS
- 2025-01-02 Listed $124,900 CBRMLS
Cash-flow waterfall
monthlySold comps — $/sqft
last 12 mo · ≤1 miLoading sold comps…