 Triplex
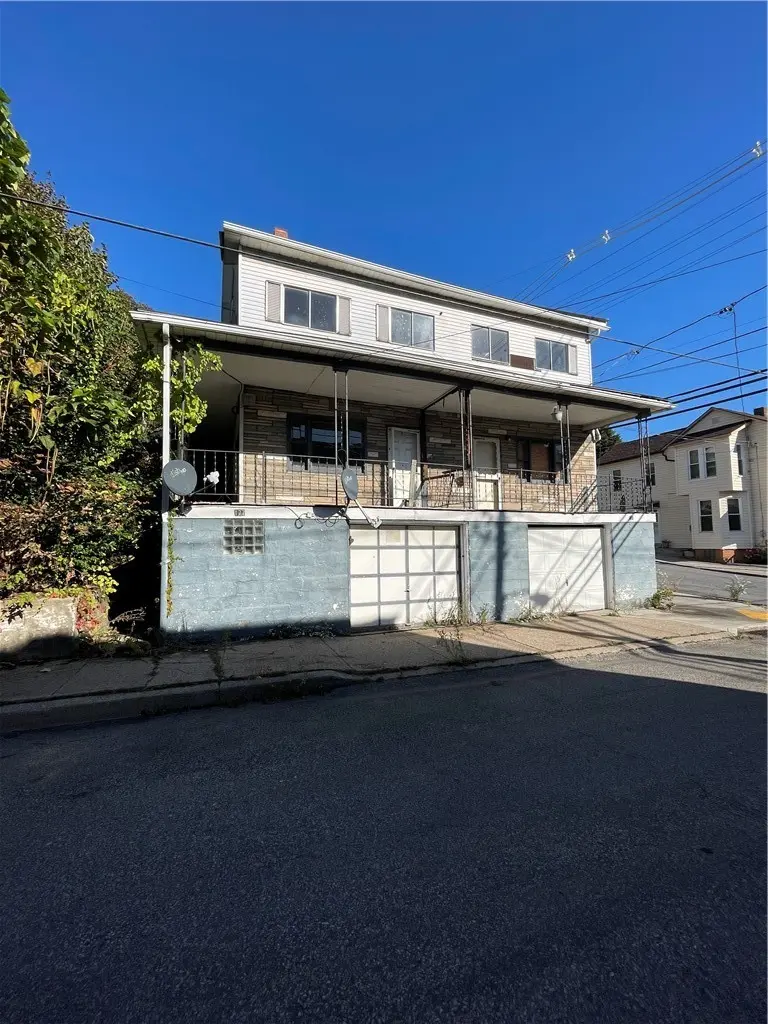
177-179 Pine St · Johnstown, PA
Flood risk 9/10 · Severe
- FEMA flood zone
- X (shaded)
- Chance of flooding over 30 yrs
- 0.99%
- Est. flood insurance / yr
- $473 – $860
Fire risk 1/10 · Minimal
- Est. fire insurance / yr
- $511 – $949
Heat risk 3/10 · Minor
- Hot days now (above 94°F)
- 7 days/yr
- Hot days in 30 yrs
- 18 days/yr
Wind risk 2/10 · Minimal
- Chance of severe wind over 30 yrs
- —
Air-quality risk 2/10 · Minimal
- Unhealthy air days now
- 1 days/yr
- Unhealthy air days in 30 yrs
- 2 days/yr
Risk factors via First Street. Map © Google.
Why this score? — see what drove the D grade
The composite is a weighted blend of 9 inputs, each scored 0–100. Each bar is that input's sub-score; the figure is the points it added to the 100-point composite (weight × sub-score).
- Cash flow +15.0/30.0
- ARV discount +7.5/15.0
- 1% rule +5.0/10.0
- DSCR +5.0/10.0
- Livability +3.9/5.0
- Rent growth +2.5/5.0
- Condition / age +2.5/5.0
- Schools +1.3/10.0
- Appreciation +0.0/10.0
$24,900
🖨 Deal sheet (PDF) 📄 Offer letter ✓ Due diligence
Multi-family units
County records classify this as Multi-Family (2-4 Unit). Listing-text estimate: 3 units. confirmed
Listing remarks MLS
Investor Alert!! Great Triplex/Quad with covered front porch, 2 attached garages. Fix it up and have a great income generating property. Needs some TLC. Sold in as-is condition.
Key facts
- Covered front porch
- Attached garages
- 4,356 sq ft lot
Tags
Neighborhood map
What this means for you Summary
Snapshot
- This is a 3 × 5-bed/3.0-bath units multifamily listed at $25k.
Deal economics
- At list price, monthly cash flow is $3k ($37k/yr) — positive. Per door: $1k/mo.
- The deal already cash-flows at list — no discount required.
- Meets the 1% rule at list price ($4k rent vs $25k).
- Recommended offer: $23k (6.0% below list) — sets the bar for market timing.
- Cap rate 159.4% vs local median 15.0% in Johnstown — top-decile yield for the area; either an underpriced asset or a hidden risk that comps aren't pricing in. Stress-test before assuming the spread holds.
Location & tenants
- Location reads 77/100 on livability (#363 in PA, #3,168 nationally) — a middle-class / working-renter tenant base. Strengths: amenities A+, commute A+, cost of living A+; Watch: crime F, employment F.
- Greater Johnstown SD (urban): math 9% / reading 25% proficiency, ranked #509 of 539 in PA (top 94%) — low school quality limits family demand, transient renter base, plan for 1-2y turnover; 80% free/reduced lunch — lower-income household profile, screen leases tightly.
- Zoned schools: Greater Johnstown El Sch (math 14% / reading 21%, grade F, #1,291 of 1,518 statewide, top 85%, 1,269 students, 100% FRL); Greater Johnstown Ms (math 6% / reading 24%, grade F, #471 of 512 statewide, top 93%, 660 students, 100% FRL); Greater Johnstown Shs (math 8% / reading 32%, grade F, #387 of 437 statewide, top 89%, 894 students, 98% FRL) — zoned schools average 100% FRL vs 80% district-wide (20 pts higher); higher-poverty schools than district average — tighter screening recommended.
- Market conditions: 64 active listings in the ZIP; lower-income renter base — watch delinquency; 64 units permitted in Cambria County in 2024 (0 in 5+ unit buildings).
Forward outlook
- Local home prices are declining (-3.0%/yr); year-one equity from $172 of loan paydown is wiped out by about $747 of value loss. Plan a longer hold.
- Cambria County population projected at -28% by 2050 — secular population decline; favor cash flow + early exit over multi-decade hold.
- At projected returns (-3.0% appreciation + 3.0% rent growth), your $7k cash investment doubles in ~1 year — after that, you're playing with house money.
Negotiation context
- It's been on market 88 days — a 6% lower offer ($23k) is reasonable based on typical stale-listing flexibility.
- 8 sale attempts since 4y ago; this cycle's ask has dropped $5k (17%) from the opening price — seller is motivated, your offer sets the floor, not the list.
- Current owner paid $17k; 46% above their basis — modest negotiation headroom, anchor on the comps not their cost.
Risks & watch-outs
- Watch-outs: flood insurance adds $56/mo; built in 1900 — expect roof / HVAC / electrical / plumbing capex.
- Climate carrying-cost: severe flood risk — expect insurance premiums to compound above CPI over the hold.
Questions for the listing agent
- It's been on market 88 days. Have you received any prior offers? Is the seller open to a 6% concession, seller financing, or rate buy-down credit?
- Can we see the unit-by-unit rent roll, current vacancy, and any below-market leases? What's the average tenancy length?
- What capital expenditures (roof, boiler, parking lot, exteriors) have been made in the last 5 years, and what's planned in the next 2?
- Built in 1900 — when were the roof, HVAC, electrical panel, plumbing, and water heater last replaced?
- What's the actual annual flood-insurance premium (NFIP or private), and is the property in a SFHA with mandatory coverage?
- Why hasn't it sold? Are there any deal-killer items the seller is aware of (foundation, flood, title, zoning, code violations)?
- Is there a deadline driving the sale (1031 exchange, divorce, estate, relocation)? That informs how much negotiation room exists.
- Schools are D-rated, which usually means shorter tenancies and higher turnover. Who's the typical renter profile here, and what's been the actual vacancy rate?
- Crime grade is F in this area — have there been break-ins, vandalism, or insurance claims at this property in the last 3 years? What carrier currently insures it and at what premium?
- The area grade is low — what's the realistic commute time and amenity access for the typical tenant pool here? Any planned neighborhood developments (good or bad) we should know about?
- What's the average days-on-market for RENTAL listings here right now (not sales)? A rising rental-DOM trend means longer vacancies and softer asking-rent achievability than the comps imply.
- What's the recent tenant-quality profile in this submarket — average credit score on applications, eviction rate, late-payment / NSF rate, and stable-employment percentage? A property-management company in the area should have these aggregated.
- How much new apartment / multifamily construction is in the pipeline within 1–3 miles? Heavy new supply (>2% of stock underway) typically softens rents 12–24 months out; light construction supports rent growth.
Investment metrics
- 1% rule
- 17.02% ✓
- Cap rate
- 159.39%
- Cash-on-cash
- 546.77%
- DSCR
- 25.33
- GRM
- 0.5
CMA / ARV
- ARV (median comp)
- $51,397
- List price
- $24,900
- Delta
- -51.55%
- Verdict
- UNDERPRICED
- Comps
- 20 within 1.0 mi
Projected returns pro-forma
-3.0% appreciation · 3.0% rent growth · sell at horizon
- IRR
- —
- Equity multiple
- 28.95×
- Total profit
- $194,853
- Equity at exit
- $3,713
- IRR
- —
- Equity multiple
- 62.11×
- Total profit
- $426,048
- Equity at exit
- $2,153
Cash invested: $6,972 (down + closing). Projections, not guarantees.
Landlord ↔ Tenant lean methodology
- Overall (STATE)
- 62 Landlord-Friendly
- State Pennsylvania
- 62 Landlord-Friendly · EVEN
- County
- — inherits STATE
- City
- — inherits STATE
ZIP-level market 15902
- Home prices YoY
- -28.8%
- Active inventory
- 64
- Price-to-rent
- 1.5×
Monthly cashflow live
- Estimated rent
- $4,239 medium interval (Pro) →
- Mortgage (P&I)
- −$131
- Tax est. 1.5%
- −$31 /mo · $374/yr
- Insurance
- −$10
- Flood insurance flood zone
- −$56 /mo · $666/yr
- HOA
- −$0
- Vacancy / Maint / Mgmt
- −$890
- Net cashflow
- $3,121
Break-even live
Sensitivity live
| Price | -10% $3,138 | -5% $3,130 | +0% $3,121 | +5% $3,113 | +10% $3,104 |
|---|---|---|---|---|---|
| Rent | -10% $2,786 | -5% $2,954 | +0% $3,121 | +5% $3,289 | +10% $3,456 |
| Rate | -1.0pp $3,134 | -0.5pp $3,128 | base $3,121 | +0.5pp $3,115 | +1.0pp $3,108 |
3-unit breakdown (identical units grouped — click to expand)
| Units | Beds | Baths | Est. rent |
|---|---|---|---|
| 3× units | 5 | 3 | $4,239 |
| #1 | 5 | 3 | $1,413 |
| #2 | 5 | 3 | $1,413 |
| #3 | 5 | 3 | $1,413 |
| Total (3 units) | $4,239 | ||
UW: 25.0% down · 7.5% · 30yr · 1.5% tax · 5.0% vac · 8.0% maint · 8.0% mgmt
Financing live
Cash to close
- Down payment
- $6,225
- Closing costs
- $747
- Reserves months
- —
- Total cash needed
- —
Loan-product check · same deal, 3 products live
Conventional
25% down · 7.5% · 30yr
- Down + closing
- —
- Monthly P&I
- —
- Monthly cashflow
- —
- DSCR
- —
- Eligible?
- —
Personal DTI + credit; lowest rate.
DSCR
20% down · 8.5% · 30yr
- Down + closing
- —
- Monthly P&I
- —
- Monthly cashflow
- —
- DSCR
- —
- Eligible?
- —
No personal income docs; deal must DSCR.
Hard money
10% down · 12.0% · 12mo
- Down + closing
- —
- Monthly P&I
- —
- Monthly cashflow
- —
- DSCR
- —
- Eligible?
- —
Short-term bridge; refi at stabilization.
Listing history 30 events
-
2026-06-19days on market $24,900 Active 88 DOM
-
2026-06-18days on market $24,900 Active 87 DOM
-
2026-06-17days on market $24,900 Active 86 DOM
-
2026-06-16days on market $24,900 Active 85 DOM
-
2026-06-15days on market $24,900 Active 84 DOM
-
2026-06-14days on market $24,900 Active 82 DOM
-
2026-06-12days on market $24,900 Active 81 DOM
-
2026-06-09days on market $24,900 Active 78 DOM
-
2026-06-08days on market $24,900 Active 77 DOM
-
2026-06-07days on market $24,900 Active 76 DOM
-
2026-06-05pricedays on market $24,900 Active 73 DOM
-
2026-06-02days on market $27,900 Active 71 DOM
-
2026-06-01days on market $27,900 Active 70 DOM
-
2026-05-31days on market $27,900 Active 69 DOM
-
2026-05-30days on market $27,900 Active 68 DOM
-
2026-05-08price $27,900 177-char remark
Show marketing remark (177 chars)
Investor Alert!! Great Triplex/Quad with covered front porch, 2 attached garages. Fix it up and have a great income generating property. Needs some TLC. Sold in as-is condition.
-
2026-04-02price $28,900 177-char remark
Show marketing remark (177 chars)
Investor Alert!! Great Triplex/Quad with covered front porch, 2 attached garages. Fix it up and have a great income generating property. Needs some TLC. Sold in as-is condition.
-
2026-03-23$29,900 Active 177-char remark
Show marketing remark (177 chars)
Investor Alert!! Great Triplex/Quad with covered front porch, 2 attached garages. Fix it up and have a great income generating property. Needs some TLC. Sold in as-is condition.
-
2023-06-16soldstatus $17,000 Closed 52-char remark
Show marketing remark (52 chars)
4 Unit fixer upper opportunity located in Johnstown!
-
2023-05-23status Pending 52-char remark
Show marketing remark (52 chars)
4 Unit fixer upper opportunity located in Johnstown!
-
2023-05-05$29,000 Active 52-char remark
Show marketing remark (52 chars)
4 Unit fixer upper opportunity located in Johnstown!
-
2023-04-27price $29,000
-
2023-03-25price $32,900
-
2023-03-05status Active
-
2023-02-22$45,000 Active
-
2023-02-13status Active
-
2022-12-04price $40,000
-
2022-09-20$48,000 Active
-
2022-05-12$50,000
-
2022-04-22$59,900
ⓘ Source: listings_history table (triggers on properties + properties_extension) + one-shot
backfill from property_details.listing_events for pre-trigger history.
Climate risk First Street
- Flood 9/10 Extreme FEMA zone X (shaded) · 99% chance over 30 yrs
- Wildfire 1/10 Low
- Heat 3/10 Moderate 7 d/yr ≥94°F today · 18 d/yr by 30 yrs out
- Wind 2/10 Low
- Air quality 2/10 Low 1 unhealthy d/yr today · 2 by 30 yrs out
Nearby sold comps map
Loading sold comps map…
Walkable amenities ~0.75 mi
Loading nearby amenities…
Taxation est. · year 1
- Rental income
- $50,868
- − Mortgage interest
- −$1,395
- − Property taxes
- −$374
- − Insurance
- −$791
- − Repairs & maintenance
- −$4,069
- − Management
- −$4,069
- − Depreciation
- −$724
- Taxable income
- $39,445
- Est. tax owed @ 24.0%
- −$9,467
- After-tax cash flow
- $27,987/yr
For passive investors: Depreciation is non-cash, so a rental often shows a tax loss while cash-flowing — sheltering income. Rental losses are passive: they offset passive income freely, and up to $25,000/yr can offset ordinary (W-2) income if you actively participate and your MAGI is under $100k (phasing out to $0 by $150k); unused losses carry forward. On sale, claimed depreciation is recaptured at up to 25%, and gains may owe capital-gains tax (a 1031 exchange can defer both). Figures are a year-1 estimate at your 24.0% rate — not tax advice; consult a CPA.
Schools (NCES district)
- District
- Greater Johnstown SD
- NCES district ID
- 4210950
- Math proficiency
- 9% ▼ -6.00%
- Reading proficiency
- 25% ▼ -6.00%
- Median HH income
- $27,890
- Composite
- 13.25/100
- National rank
- #9550
- State rank
- #509 of 539 in PA
Livability — Johnstown
- Score
- 77/100
- State rank
- #363
- US rank
- #3168
Category grades
Schools grade is shown separately in the Schools card above.
Census & demographics
- Census place
- Johnstown, PA
- County
- Cambria County · 30,791 people
- City population
- 30,791
- Metro
- Johnstown, PA
- Population (ZIP)
- 11,462
- Household income
- $44,215
- Rent vs Own
- Severe rent burden
- 266.0
Population outlook (Cambria County) Hauer SSP2
- Today (2025)
- 122,754 people
- By 2030
- 115,827 · -5.6%
- By 2040
- 101,309 · -17.5%
- By 2050
- 88,379 · -28.0%
- By 2075
- 65,237 · -46.9%
- By 2100
- 46,909 · -61.8%
Race, ethnicity, and origin ACS 2023
- Neighborhood character
- Predominantly White (75%)
- Race & ethnicity
- White 75% Two or more races 14% Black 8% Hispanic / Latino 3%
- Common ancestry
- Romanian 7% Slovak 2% Hungarian 2%
- Foreign-born
- 2% · Canada
- Languages at home
- 97% English-only · Spanish 2%
Political lean MEDSL · Cambria
- 2024 margin
- Solid R (+39.7) · D 29.8% · R 69.5%
- 2008→2024 swing
- -40.4pp toward R · 2008: 0.7pp · 2024: -39.7pp
- All cycles
- 2024: R+39.7 2020: R+37.3 2016: R+37.8 2012: R+17.8 2008: D+0.7
Not yet ingested
- Civics
- —
Market trends
- HPI YoY
- ▼ -43.86%
- Current HPI
- 108.2198
- Rent YoY
- —
- Metro
- Johnstown, PA
- State GDP YoY
- ▲ 1.68%
- F500 in state
- 34
Industry mix (Fortune 500 HQ in PA)
| Industry | F500 HQs | Revenue |
|---|---|---|
| Healthcare | 2 | $309B |
|
||
| Insurance | 2 | $27B |
|
||
| Telecommunications / Media | 1 | $124B |
|
||
| Industrial Distribution | 1 | $22B |
|
||
| Financial Services | 1 | $20B |
|
||
| Chemicals / Materials | 1 | $18B |
|
||
Price history
-53.4% since first listed15 events — show timeline
- 2026-05-08 Price Changed $27,900 West Penn MLS
- 2026-04-02 Price Changed $28,900 West Penn MLS
- 2026-03-23 Listed $29,900 West Penn MLS
- 2023-06-16 Sold (MLS) $17,000 West Penn MLS
- 2023-05-23 Pending — West Penn MLS
- 2023-05-05 Listed $29,000 West Penn MLS
- 2023-04-27 Price Changed $29,000 CSMLS
- 2023-03-25 Price Changed $32,900 CSMLS
- 2023-03-05 Relisted — CSMLS
- 2023-02-22 Listed $45,000 CSMLS
- 2023-02-13 Relisted — CSMLS
- 2022-12-04 Price Changed $40,000 CSMLS
- 2022-09-20 Listed $48,000 CSMLS
- 2022-05-12 Listed $50,000 CSMLS
- 2022-04-22 Listed $59,900 West Penn MLS
Cash-flow waterfall
monthlySold comps — $/sqft
last 12 mo · ≤1 miLoading sold comps…