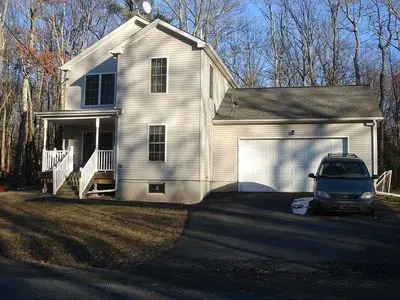
113 Oak Dr · Barryville, NY
Flood risk 1/10 · Minimal
- FEMA flood zone
- X (unshaded)
- Chance of flooding over 30 yrs
- 0.0%
- Est. flood insurance / yr
- $473 – $860
Fire risk 3/10 · Minor
- Est. fire insurance / yr
- $511 – $949
Heat risk 2/10 · Minimal
- Hot days now (above 92°F)
- 7 days/yr
- Hot days in 30 yrs
- 15 days/yr
Wind risk 3/10 · Minor
- Chance of severe wind over 30 yrs
- 5.0%
Air-quality risk 2/10 · Minimal
- Unhealthy air days now
- 1 days/yr
- Unhealthy air days in 30 yrs
- 2 days/yr
Risk factors via First Street. Map © Google.
Why this score? — see what drove the C grade
The composite is a weighted blend of 9 inputs, each scored 0–100. Each bar is that input's sub-score; the figure is the points it added to the 100-point composite (weight × sub-score).
- Cash flow +14.2/30.0
- ARV discount +12.6/15.0
- Appreciation +10.0/10.0
- Schools +4.7/10.0
- DSCR +4.3/10.0
- 1% rule +3.9/10.0
- Rent growth +2.5/5.0
- Livability +2.5/5.0
- Condition / age +2.5/5.0
$281,500
🖨 Deal sheet 📄 Offer letter ✓ Due diligence
Listing remarks
Interior Bedrooms: 3 Primary Bedroom Dimensions: 12.9 X 12.5 Bedroom 2 Dimensions: 11.3 X 9.3 Bedroom 3 Dimensions: 10.5 X 11.3 Other Rooms Total Rooms: 6 Bathroom 2, Primary Bathroom, Primary Bedroom, Living Room, Laundry, Kitchen, Dining Room, Bedroom 3, Bedroom 2 Primary Bathroom: 12 X 6 Living Room Dimensions: 14 X 18 Bathrooms Total Bathrooms: 3 Full Bathrooms: 2 1/2 Bathrooms: 1 Bathroom 2 Dimensions: 6 X 12 Appliances Dishwasher Refrigerator Range Oven Heating: Propane hot water Fireplace Features: Gas Heating Features: Propane baseboard Number Of Fireplaces: 1 Kitchen and Dining Dining Room Dimensions: 11 X 12 Kitchen Dimensions: 12 X 14 Interior Features
Key facts
- Built 2006
- Listed 35 days
Neighborhood map
What this means for you Summary
Snapshot
- This is a 3-bed/2.0-bath single-family listed at $282k.
Deal economics
- At list price, monthly cash flow is $46 ($549/yr) — positive.
- The deal already cash-flows at list — no discount required.
- To meet the 1% rule (rent ≥ 1% of price), the offer needs to be $250k (11.4% below list).
- Recommended offer: $250k (11.4% below list) — sets the bar for 1% rule.
- Cap rate 6.5% vs local median 2.3% in Barryville — top-decile yield for the area; either an underpriced asset or a hidden risk that comps aren't pricing in. Stress-test before assuming the spread holds.
Location & tenants
- Location reads: area grade C — affects rentability + tenant quality, not the cash-flow math above.
- Delaware Valley SD (rural): math 41% / reading 66% proficiency, ranked #121 of 539 in PA (top 22%) — acceptable for families but not a draw, mixed tenant base, ~2y average lease.
- Market conditions: 1 comparable units currently listed for rent nearby; 213 units permitted in Pike County in 2024 (0 in 5+ unit buildings).
Forward outlook
- In year one you build about $30k of equity ($2k loan paydown + $28k appreciation (10.0% local appreciation)).
- Pike County population projected at -25% by 2050 — secular population decline; favor cash flow + early exit over multi-decade hold.
- At projected returns (10.0% appreciation + 3.0% rent growth), your $79k cash investment doubles in ~3 years — after that, you're playing with house money.
- By year 2, paydown + projected appreciation supports a ~$48k cash-out refi (75% LTV) — recoverable capital for the next deal without selling this one.
Negotiation context
- It's been on market 35 days — a 3% lower offer ($273k) is reasonable based on typical stale-listing flexibility.
- 3 sale attempts with the ask held roughly flat each time — persistent listings suggest the price (not the market) is what's stuck; bring a comps-based counter.
- Current owner paid $196k; 44% above their basis — modest negotiation headroom, anchor on the comps not their cost.
Questions for the listing agent
- It's been on market 35 days. Have you received any prior offers? Is the seller open to a 11% concession, seller financing, or rate buy-down credit?
- Is there a deadline driving the sale (1031 exchange, divorce, estate, relocation)? That informs how much negotiation room exists.
- What's the average days-on-market for RENTAL listings here right now (not sales)? A rising rental-DOM trend means longer vacancies and softer asking-rent achievability than the comps imply.
- What's the recent tenant-quality profile in this submarket — average credit score on applications, eviction rate, late-payment / NSF rate, and stable-employment percentage? A property-management company in the area should have these aggregated.
- How much new for-sale + rental construction is in the pipeline within 1–3 miles? Heavy new supply typically softens prices + rents 12–24 months out; constrained supply supports both.
Investment metrics
- 1% rule
- 0.89% ✗
- Cap rate
- 6.49%
- Cash-on-cash
- 0.70%
- DSCR
- 1.03
- GRM
- 9.4
CMA / ARV
- ARV (on-the-fly)
- $317,376
- Comps found
- 11
Show comp detail 11 sales within ~0.75 mi
| Address | Dist | Beds/Ba | Sqft | Sold | Price | $/sf | Match |
|---|---|---|---|---|---|---|---|
| 136 Iroquois Rd | 0.24mi | 3/2.0 | 1,344 (-2%) | 5mo | $315,000 | $234 | 81 |
| 146 Mohawk Rd | 0.27mi | 3/2.0 | 1,400 (+2%) | 13mo | $315,000 | $225 | 73 |
| 141 Cahoonzie Rd | 0.32mi | 3/2.0 | 1,491 (+9%) | 6mo | $339,000 | $227 | 65 |
| 150 Cree Rd | 0.66mi | 3/2.0 | 1,344 (-2%) | 2mo | $355,000 | $264 | 65 |
| 142 Onandaga Rd | 0.64mi | 3/2.0 | 1,344 (-2%) | 16mo | $309,900 | $231 | 54 |
| 115 Lake Shore Rd | 0.35mi | 3/2.0 | 1,210 (-12%) | 17mo | $299,900 | $248 | 50 |
| 136 Maple Dr | 0.27mi | 2/1.0 (-1) | 1,200 (-12%) | 13mo | $324,000 | $270 | 48 |
| 136 Cree Rd | 0.63mi | 3/2.5 | 1,568 (+15%) | 0mo | $364,000 | $232 | 44 |
| 144 Onandaga Rd | 0.60mi | 3/2.0 | 1,526 (+12%) | 11mo | $342,500 | $224 | 44 |
| 163 Erie Rd | 0.72mi | 3/2.0 | 1,550 (+13%) | 7mo | $425,000 | $274 | 38 |
| 654 Twin Lakes Rd | 0.59mi | 3/1.0 | 1,512 (+10%) | 16mo | $330,000 | $218 | 38 |
Match score weights: distance 35% · size 25% · config 20% · recency 20%. Top-matched comps best support the ARV.
Projected returns pro-forma
10.0% appreciation · 3.0% rent growth · sell at horizon
- IRR
- 24.8%
- Equity multiple
- 2.98×
- Total profit
- $156,249
- Equity at exit
- $253,598
- IRR
- 21.9%
- Equity multiple
- 6.81×
- Total profit
- $457,888
- Equity at exit
- $546,893
Cash invested: $78,820 (down + closing). Projections, not guarantees.
Landlord ↔ Tenant lean methodology
- Overall (STATE)
- 15 Strongly Tenant-Friendly
- State New York
- 15 Strongly Tenant-Friendly · D+10
- County
- — inherits STATE
- City
- — inherits STATE
ZIP-level market 18458
- Home prices YoY
- 13.2%
- Price-to-rent
- 9.4×
Monthly cashflow live
- Estimated rent
- $2,495 medium interval (Pro) →
- Mortgage (P&I)
- −$1,476
- Tax from tax record
- −$332 /mo · $3,982/yr
- Insurance
- −$117
- HOA
- −$0
- Vacancy / Maint / Mgmt
- −$524
- Net cashflow
- $46
Break-even live
UW: 25.0% down · 7.5% · 30yr · 1.5% tax · 5.0% vac · 8.0% maint · 8.0% mgmt
Financing live
Cash to close
- Down payment
- $70,375
- Closing costs
- $8,445
- Reserves months
- —
- Total cash needed
- —
Loan-product check · same deal, 3 products live
Conventional
25% down · 7.5% · 30yr
- Down + closing
- —
- Monthly P&I
- —
- Monthly cashflow
- —
- DSCR
- —
- Eligible?
- —
Personal DTI + credit; lowest rate.
DSCR
20% down · 8.5% · 30yr
- Down + closing
- —
- Monthly P&I
- —
- Monthly cashflow
- —
- DSCR
- —
- Eligible?
- —
No personal income docs; deal must DSCR.
Hard money
10% down · 12.0% · 12mo
- Down + closing
- —
- Monthly P&I
- —
- Monthly cashflow
- —
- DSCR
- —
- Eligible?
- —
Short-term bridge; refi at stabilization.
Rent comps 1 comps
| Address | Beds | Baths | Sqft | Rent | $/sqft | DOM | Units | Dist |
|---|---|---|---|---|---|---|---|---|
| 150 Cree Rd Shohola, PA | 3.0 | 2.0 | 1344 | $2,495 | $1.86 | 1d | 1 | 0.68mi |
Listing history 23 events
-
2026-06-17status $281,500 Under Contract 35 DOM
-
2026-06-16days on market $281,500 Active 35 DOM
-
2026-06-15days on market $281,500 Active 34 DOM
-
2026-06-13days on market $281,500 Active 32 DOM
-
2026-06-13days on market $281,500 Active 31 DOM
-
2026-06-09days on market $281,500 Active 28 DOM
-
2026-06-08days on market $281,500 Active 27 DOM
-
2026-06-07days on market $281,500 Active 26 DOM
-
2026-06-04days on market $281,500 Active 23 DOM
-
2026-06-03days on market $281,500 Active 22 DOM
-
2026-06-02days on market $281,500 Active 21 DOM
-
2026-06-01days on market $281,500 Active 20 DOM
-
2026-05-31days on market $281,500 Active 19 DOM
-
2026-05-13price $281,500 1669-char remark
-
2026-05-12$290,000 Active 1669-char remark
-
2025-08-27price $269,000
-
2025-08-26status Active
-
2025-08-15status Pending
-
2025-08-01price $274,000
-
2025-07-22price $284,000
-
2025-07-09$299,000 Active
-
2011-05-09soldstatus $195,600
-
2006-12-05soldstatus $22,000
ⓘ Source: listings_history table (triggers on properties + properties_extension) + one-shot
backfill from property_details.listing_events for pre-trigger history.
Tax reassessment forecast NY · Partial reset (capped growth)
- Current annual tax
- $3,982 · $332/mo
- Projected year-2 tax
- $4,370 · $364/mo
- Expected delta
- +$388/yr (+$32/mo · 9.7%)
ⓘ Screening estimate from a state-policy table — verify with the county assessor before closing.
Climate risk First Street
- Flood 1/10 Low FEMA zone X (unshaded) · 0% chance over 30 yrs
- Wildfire 3/10 Moderate
- Heat 2/10 Low 7 d/yr ≥92°F today · 15 d/yr by 30 yrs out
- Wind 3/10 Moderate 5% chance of damaging wind over 30 yrs
- Air quality 2/10 Low 1 unhealthy d/yr today · 2 by 30 yrs out
Nearby sold comps map
Loading sold comps map…
Walkable amenities ~0.75 mi
Loading nearby amenities…
Taxation est. · year 1
- Rental income
- $29,940
- − Mortgage interest
- −$15,768
- − Property taxes
- −$3,982
- − Insurance
- −$1,408
- − Repairs & maintenance
- −$2,395
- − Management
- −$2,395
- − Depreciation
- −$8,189
- Taxable loss
- −$4,197
- Est. tax savings @ 24.0%
- +$1,007
- After-tax cash flow
- $1,556/yr
For passive investors: Depreciation is non-cash, so a rental often shows a tax loss while cash-flowing — sheltering income. Rental losses are passive: they offset passive income freely, and up to $25,000/yr can offset ordinary (W-2) income if you actively participate and your MAGI is under $100k (phasing out to $0 by $150k); unused losses carry forward. On sale, claimed depreciation is recaptured at up to 25%, and gains may owe capital-gains tax (a 1031 exchange can defer both). Figures are a year-1 estimate at your 24.0% rate — not tax advice; consult a CPA.
Schools (NCES district)
- District
- Delaware Valley SD
- NCES district ID
- 4207530
- Math proficiency
- 41% ▼ -12.00%
- Reading proficiency
- 66% ▼ -9.00%
- Median HH income
- $64,202
- Composite
- 46.95/100
- National rank
- #2359
- State rank
- #121 of 539 in PA
Livability — Barryville
No livability data for this city. (Only ~50 U.S. cities are tracked.)
Census & demographics
- Population (ZIP)
- 3,576
Population outlook (Pike County) Hauer SSP2
- Today (2025)
- 53,548 people
- By 2030
- 51,622 · -3.6%
- By 2040
- 46,490 · -13.2%
- By 2050
- 40,372 · -24.6%
- By 2075
- 31,951 · -40.3%
- By 2100
- 26,821 · -49.9%
Race, ethnicity, and origin ACS 2023
- Neighborhood character
- Predominantly White (93%)
- Race & ethnicity
- White 93% Two or more races 4% Hispanic / Latino 3% Asian 1%
- Common ancestry
- Romanian 7% Lithuanian 2% Serbian 1%
- Foreign-born
- 3% · Canada
- Languages at home
- 95% English-only · German/W. Germanic 2% Spanish 2% Other Indo-European 1%
Political lean MEDSL · Pike
- 2024 margin
- Strong R (+24.1) · D 37.6% · R 61.6%
- 2008→2024 swing
- -19.8pp toward R · 2008: -4.2pp · 2024: -24.1pp
- All cycles
- 2024: R+24.1 2020: R+19.0 2016: R+26.0 2012: R+11.0 2008: R+4.2
Not yet ingested
- Civics
- —
Market trends
- HPI YoY
- ▲ 31.80%
- Current HPI
- 272.6294
- Rent YoY
- —
- Metro
- —
- State GDP YoY
- ▲ 2.60%
- F500 in state
- 92
Industry mix (Fortune 500 HQ in NY)
| Industry | F500 HQs | Revenue |
|---|---|---|
| Financial Services | 10 | $950B |
|
||
| Consumer Goods | 9 | $162B |
|
||
| Insurance | 4 | $225B |
|
||
| Telecommunications | 2 | $144B |
|
||
| Pharmaceuticals | 2 | $112B |
|
||
| Media / Entertainment | 2 | $69B |
|
||
Price history
+1179.5% since first listed11 events — show timeline
- 2026-06-16 Pending — FSBO.com
- 2026-05-13 Price Changed $281,500 FSBO.com
- 2026-05-12 Listed $290,000 FSBO.com
- 2025-08-27 Price Changed $269,000 PWMLS
- 2025-08-26 Relisted — PWMLS
- 2025-08-15 Pending — PWMLS
- 2025-08-01 Price Changed $274,000 PWMLS
- 2025-07-22 Price Changed $284,000 PWMLS
- 2025-07-09 Listed $299,000 PWMLS
- 2011-05-09 Sold (Public Records) $195,600 Public Records
- 2006-12-05 Sold (Public Records) $22,000 Public Records
Property tax history
+1.8%/yrLatest (2026): $3,982 · +1.5% YoY. Source: county tax records.
Cash-flow waterfall
monthlySold comps — $/sqft
last 12 mo · ≤1 miLoading sold comps…