20 N Gate Ct S · Lake, PA
Flood risk 1/10 · Minimal
- FEMA flood zone
- X (unshaded)
- Chance of flooding over 30 yrs
- 0.0%
- Est. flood insurance / yr
- $473 – $860
Fire risk 1/10 · Minimal
- Est. fire insurance / yr
- $511 – $949
Heat risk 2/10 · Minimal
- Hot days now (above 90°F)
- 7 days/yr
- Hot days in 30 yrs
- 16 days/yr
Wind risk 2/10 · Minimal
- Chance of severe wind over 30 yrs
- 3.0%
Air-quality risk 2/10 · Minimal
- Unhealthy air days now
- 1 days/yr
- Unhealthy air days in 30 yrs
- 2 days/yr
Risk factors via First Street. Map © Google.
Why this score? — see what drove the D+ grade
The composite is a weighted blend of 9 inputs, each scored 0–100. Each bar is that input's sub-score; the figure is the points it added to the 100-point composite (weight × sub-score).
- ARV discount +11.9/15.0
- Appreciation +10.0/10.0
- Cash flow +8.0/30.0
- Schools +4.4/10.0
- 1% rule +2.9/10.0
- Rent growth +2.5/5.0
- Livability +2.5/5.0
- Condition / age +2.5/5.0
- DSCR +2.0/10.0
$299,000
🖨 Deal sheet (PDF) 📄 Offer letter ✓ Due diligence
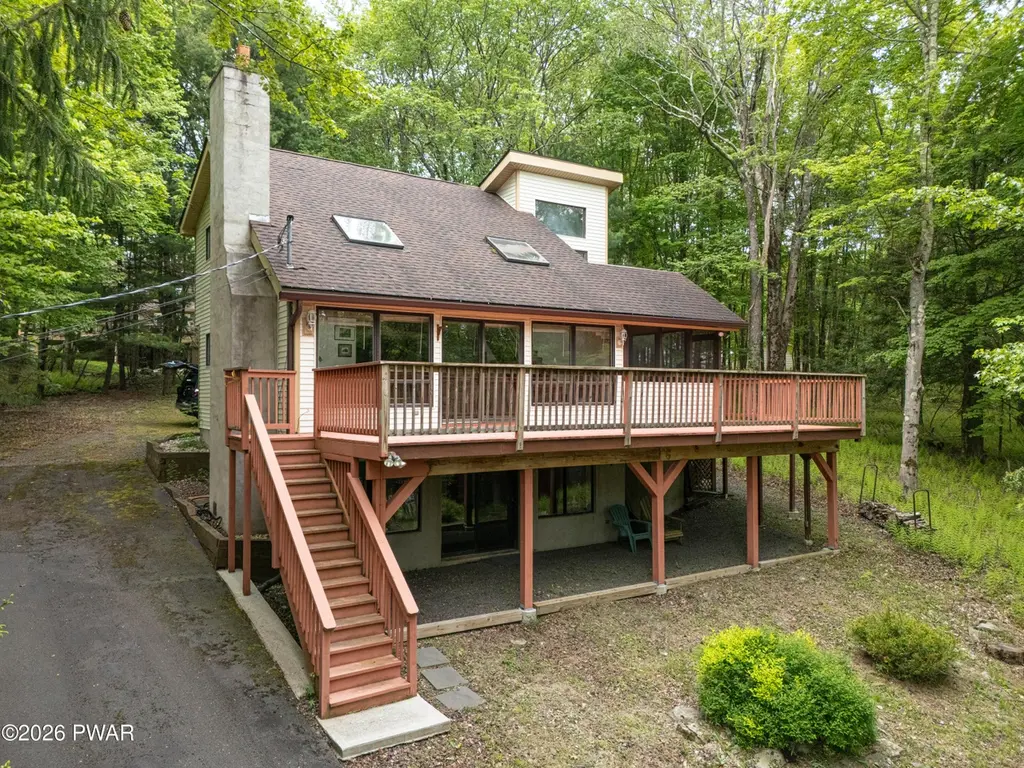
Listing remarks
Step into the Poconos and discover this spacious contemporary home offering a bright, open floor plan designed for comfortable living and easy entertaining. Sun-filled living spaces create a warm and inviting atmosphere with plenty of room to gather with family and friends. The location is hard to beat--just a short walk to North Beach for days spent by the water and enjoying all that community living has to offer. Located in the amenity-rich gated recreational community of The Hideout, you'll enjoy access to lakes, pools, beaches, golf course, ski hill, bar, restaurant, fitness center, and a tiki bar. Whether you're searching for a full-time residence, vacation retreat, or investment oppor
Key facts
- Access to lakes
- Open floor plan
- Access to pools
Tags
Property features AI
Finance
- Other: Located in The Hideout community
- HOA & community: Homeowners association with annual fee; Annual association fee of $2,270 (also lists a one-time fee of $2,160); Association amenities include clubhouse, pool, tennis and basketball courts, fitness center, playground, park, lake and marina access, golf, trails, recreation/game rooms, picnic area, dog park, beach rights/access, and security (gated); Association fee includes trash service
Exterior
- Parking: Driveway (paved)
- Security: Located in a gated community
- Utilities: Public sewer
- Home design: Single family residence; Residential property; Three or more levels
- Construction: Asphalt roof
- Exterior features: Deck; Porch (screened); Wooded lot; View of Roamingwood Lake; Private maintained paved road; Private road frontage
Interior
- Kitchen: Dishwasher; Refrigerator; Microwave; Electric oven
- Flooring: Carpet; Tile; Linoleum
- Bathrooms: Three full bathrooms
- Heating & cooling: Baseboard heating; Propane heating; Wood stove; Electric heating; Ceiling fan(s)
- Interior features: High ceilings; Open floorplan; Finished walk-out full basement
- Laundry & utility: Washer; Dryer; Laundry located in bathroom on lower level
Neighborhood map
What this means for you Summary
Snapshot
- This is a 4-bed/2.5-bath single-family listed at $299k.
Deal economics
- At list price, monthly cash flow is $-312 ($-4k/yr) — negative.
- To cash-flow at today's rent, offer at most $244k (18.4% below list).
- To meet the 1% rule (rent ≥ 1% of price), the offer needs to be $235k (21.3% below list).
- Recommended offer: $235k (21.3% below list) — sets the bar for 1% rule.
Location & tenants
- Location reads: area grade D — affects rentability + tenant quality, not the cash-flow math above.
- Western Wayne SD (rural): math 39% / reading 63% proficiency, ranked #165 of 539 in PA (top 31%) — acceptable for families but not a draw, mixed tenant base, ~2y average lease.
- Market conditions: 337 active listings in the ZIP; 177 units permitted in Wayne County in 2024 (0 in 5+ unit buildings).
Forward outlook
- In year one you build about $32k of equity ($2k loan paydown + $30k appreciation (10.0% local appreciation)).
- Wayne County population projected at -17% by 2050 — secular population decline; favor cash flow + early exit over multi-decade hold.
- By year 2, paydown + projected appreciation supports a ~$51k cash-out refi (75% LTV) — recoverable capital for the next deal without selling this one.
Negotiation context
- It's been on market 27 days — a 2% lower offer ($295k) is reasonable based on typical stale-listing flexibility.
- Current owner paid $149k; list at $299k implies a 101% gain — meaningful room to come down on a strong offer.
Questions for the listing agent
- What do current leases actually rent for vs. the listed asking? Can we see a recent rent roll and the last 12 months of T-12 income?
- What does the HOA fee cover, when was the last increase, and are there any pending special assessments or reserve-fund shortfalls?
- Is there a deadline driving the sale (1031 exchange, divorce, estate, relocation)? That informs how much negotiation room exists.
- The area grade is low — what's the realistic commute time and amenity access for the typical tenant pool here? Any planned neighborhood developments (good or bad) we should know about?
- What's the average days-on-market for RENTAL listings here right now (not sales)? A rising rental-DOM trend means longer vacancies and softer asking-rent achievability than the comps imply.
- What's the recent tenant-quality profile in this submarket — average credit score on applications, eviction rate, late-payment / NSF rate, and stable-employment percentage? A property-management company in the area should have these aggregated.
- How much new for-sale + rental construction is in the pipeline within 1–3 miles? Heavy new supply typically softens prices + rents 12–24 months out; constrained supply supports both.
Investment metrics
- 1% rule
- 0.79% ✗
- Cap rate
- 5.04%
- Cash-on-cash
- -4.47%
- DSCR
- 0.80
- GRM
- 10.6
CMA / ARV
- ARV (on-the-fly)
- $331,664
- Comps found
- 12
Show comp detail 12 sales within ~0.75 mi
| Address | Dist | Beds/Ba | Sqft | Sold | Price | $/sf | Match |
|---|---|---|---|---|---|---|---|
| 11 Boulder Ct | 0.43mi | 4/3.0 | 2,112 (-3%) | 4mo | $240,000 | $114 | 69 |
| 28 Woodcrest Ln Ln | 0.57mi | 5/3.0 (+1) | 2,200 (+1%) | 2mo | $335,000 | $152 | 64 |
| 57 Glenwood Ln | 0.21mi | 4/3.0 | 2,496 (+14%) | 1mo | $370,000 | $148 | 63 |
| 46 Roamingwood Rd | 0.54mi | 4/2.0 | 2,124 (-3%) | 8mo | $282,900 | $133 | 62 |
| 50 Woodhill Ln | 0.64mi | 4/3.0 | 2,184 (+0%) | 10mo | $355,000 | $163 | 60 |
| 411 Lakeview Dr W | 0.54mi | 3/3.0 (-1) | 2,059 (-6%) | 10mo | $299,000 | $145 | 50 |
| 1244 Woodhill Ln | 0.69mi | 3/2.5 (-1) | 2,290 (+5%) | 6mo | $405,000 | $177 | 49 |
| 10 Crestwood Ct | 0.56mi | 4/3.0 | 2,474 (+13%) | 2mo | $355,000 | $143 | 48 |
| 34 Roamingwood Rd | 0.59mi | 3/3.0 (-1) | 2,012 (-8%) | 8mo | $310,000 | $154 | 46 |
| 1618 Ridgeview Dr | 0.66mi | 3/2.0 (-1) | 2,318 (+6%) | 10mo | $240,000 | $104 | 44 |
| 1208 Lakeview Dr W #368 | 0.69mi | 4/3.0 | 1,955 (-10%) | 8mo | $995,000 | $509 | 42 |
| 59 Woodhill Ln | 0.63mi | 3/3.0 (-1) | 2,421 (+11%) | 8mo | $475,000 | $196 | 38 |
Match score weights: distance 35% · size 25% · config 20% · recency 20%. Top-matched comps best support the ARV.
Projected returns pro-forma
10.0% appreciation · 3.0% rent growth · sell at horizon
- IRR
- 21.1%
- Equity multiple
- 2.71×
- Total profit
- $143,101
- Equity at exit
- $269,363
- IRR
- 19.1%
- Equity multiple
- 6.22×
- Total profit
- $437,208
- Equity at exit
- $580,891
Cash invested: $83,720 (down + closing). Projections, not guarantees.
Landlord ↔ Tenant lean methodology
- Overall (STATE)
- 62 Landlord-Friendly
- State Pennsylvania
- 62 Landlord-Friendly · EVEN
- County
- — inherits STATE
- City
- — inherits STATE
ZIP-level market 18436
- Home prices YoY
- 16.9%
- Active inventory
- 337
- Price-to-rent
- 10.6×
Monthly cashflow live
- Estimated rent
- $2,352 medium interval (Pro) →
- Mortgage (P&I)
- −$1,568
- Tax from tax record
- −$288 /mo · $3,455/yr
- Insurance
- −$125
- HOA
- −$189
- Vacancy / Maint / Mgmt
- −$494
- Net cashflow
- $-312
Break-even live
Sensitivity live
| Price | -10% $-142 | -5% $-227 | +0% $-312 | +5% $-396 | +10% $-481 |
|---|---|---|---|---|---|
| Rent | -10% $-497 | -5% $-404 | +0% $-312 | +5% $-219 | +10% $-126 |
| Rate | -1.0pp $-161 | -0.5pp $-235 | base $-312 | +0.5pp $-389 | +1.0pp $-468 |
UW: 25.0% down · 7.5% · 30yr · 1.5% tax · 5.0% vac · 8.0% maint · 8.0% mgmt
Financing live
Cash to close
- Down payment
- $74,750
- Closing costs
- $8,970
- Reserves months
- —
- Total cash needed
- —
Loan-product check · same deal, 3 products live
Conventional
25% down · 7.5% · 30yr
- Down + closing
- —
- Monthly P&I
- —
- Monthly cashflow
- —
- DSCR
- —
- Eligible?
- —
Personal DTI + credit; lowest rate.
DSCR
20% down · 8.5% · 30yr
- Down + closing
- —
- Monthly P&I
- —
- Monthly cashflow
- —
- DSCR
- —
- Eligible?
- —
No personal income docs; deal must DSCR.
Hard money
10% down · 12.0% · 12mo
- Down + closing
- —
- Monthly P&I
- —
- Monthly cashflow
- —
- DSCR
- —
- Eligible?
- —
Short-term bridge; refi at stabilization.
HOA detail
- Monthly dues
- $189 · $2,268/yr
- Likely covers
- waterpoolgymsecurity
Listing history 18 events
-
2026-06-18days on market $299,000 Active 27 DOM
-
2026-06-17days on market $299,000 Active 26 DOM
-
2026-06-16days on market $299,000 Active 25 DOM
-
2026-06-15days on market $299,000 Active 24 DOM
-
2026-06-14days on market $299,000 Active 22 DOM
-
2026-06-13days on market $299,000 Active 21 DOM
-
2026-06-10days on market $299,000 Active 19 DOM
-
2026-06-09days on market $299,000 Active 18 DOM
-
2026-06-08days on market $299,000 Active 17 DOM
-
2026-06-07days on market $299,000 Active 16 DOM
-
2026-06-03days on market $299,000 Active 12 DOM
-
2026-06-02days on market $299,000 Active 11 DOM
-
2026-06-01days on market $299,000 Active 10 DOM
-
2026-05-31days on market $299,000 Active 9 DOM
-
2026-05-30days on market $299,000 Active 8 DOM
-
2026-05-21$299,000 Active
-
2003-12-26soldstatus $149,000
-
1996-09-12soldstatus $110,000
ⓘ Source: listings_history table (triggers on properties + properties_extension) + one-shot
backfill from property_details.listing_events for pre-trigger history.
Tax reassessment forecast PA · Partial reset (capped growth)
- Current annual tax
- $3,455 · $288/mo
- Projected year-2 tax
- $4,090 · $341/mo
- Expected delta
- +$635/yr (+$53/mo · 18.4%)
ⓘ Screening estimate from a state-policy table — verify with the county assessor before closing.
Climate risk First Street
- Flood 1/10 Low FEMA zone X (unshaded) · 0% chance over 30 yrs
- Wildfire 1/10 Low
- Heat 2/10 Low 7 d/yr ≥90°F today · 16 d/yr by 30 yrs out
- Wind 2/10 Low 3% chance of damaging wind over 30 yrs
- Air quality 2/10 Low 1 unhealthy d/yr today · 2 by 30 yrs out
Nearby sold comps map
Loading sold comps map…
Walkable amenities ~0.75 mi
Loading nearby amenities…
Taxation est. · year 1
- Rental income
- $28,222
- − Mortgage interest
- −$16,749
- − Property taxes
- −$3,455
- − Insurance
- −$1,495
- − Repairs & maintenance
- −$2,258
- − Management
- −$2,258
- − HOA
- −$2,268
- − Depreciation
- −$8,698
- Taxable loss
- −$8,958
- Est. tax savings @ 24.0%
- +$2,150
- After-tax cash flow
- $-1,588/yr
For passive investors: Depreciation is non-cash, so a rental often shows a tax loss while cash-flowing — sheltering income. Rental losses are passive: they offset passive income freely, and up to $25,000/yr can offset ordinary (W-2) income if you actively participate and your MAGI is under $100k (phasing out to $0 by $150k); unused losses carry forward. On sale, claimed depreciation is recaptured at up to 25%, and gains may owe capital-gains tax (a 1031 exchange can defer both). Figures are a year-1 estimate at your 24.0% rate — not tax advice; consult a CPA.
Schools (NCES district)
- District
- Western Wayne SD
- NCES district ID
- 4226070
- Math proficiency
- 39% ▼ -12.00%
- Reading proficiency
- 63% ▼ -6.00%
- Median HH income
- $51,358
- Composite
- 43.65/100
- National rank
- #2964
- State rank
- #165 of 539 in PA
Livability — Lake
No livability data for this city. (Only ~50 U.S. cities are tracked.)
Census & demographics
- Census place
- The Hideout, PA
- Population (ZIP)
- 13,225
Population outlook (Wayne County) Hauer SSP2
- Today (2025)
- 47,924 people
- By 2030
- 46,191 · -3.6%
- By 2040
- 42,815 · -10.7%
- By 2050
- 39,873 · -16.8%
- By 2075
- 34,556 · -27.9%
- By 2100
- 28,358 · -40.8%
Race, ethnicity, and origin ACS 2023
- Neighborhood character
- Predominantly White (95%)
- Race & ethnicity
- White 95% Two or more races 3% Hispanic / Latino 2%
- Common ancestry
- Romanian 9% Scotch-Irish 2% Iranian 2%
- Foreign-born
- 4%
- Languages at home
- 95% English-only · French/Haitian/Cajun 2% Russian/Polish/Slavic 1% Spanish 1%
Political lean MEDSL · Wayne
- 2024 margin
- Solid R (+37.1) · D 31.1% · R 68.2%
- 2008→2024 swing
- -24.8pp toward R · 2008: -12.3pp · 2024: -37.1pp
- All cycles
- 2024: R+37.1 2020: R+33.6 2016: R+39.7 2012: R+20.9 2008: R+12.3
Not yet ingested
- Civics
- —
Market trends
- HPI YoY
- ▲ 47.95%
- Current HPI
- 331.9645
- Rent YoY
- —
- Metro
- —
- State GDP YoY
- ▲ 1.68%
- F500 in state
- 34
Industry mix (Fortune 500 HQ in PA)
| Industry | F500 HQs | Revenue |
|---|---|---|
| Healthcare | 2 | $309B |
|
||
| Insurance | 2 | $27B |
|
||
| Telecommunications / Media | 1 | $124B |
|
||
| Industrial Distribution | 1 | $22B |
|
||
| Financial Services | 1 | $20B |
|
||
| Chemicals / Materials | 1 | $18B |
|
||
Price history
+171.8% since first listed3 events — show timeline
- 2026-05-21 Listed $299,000 PWMLS
- 2003-12-26 Sold (Public Records) $149,000 Public Records
- 1996-09-12 Sold (Public Records) $110,000 Public Records
Property tax history
+2.3%/yrLatest (2026): $3,455 · +3.0% YoY. Source: county tax records.
Cash-flow waterfall
monthlySold comps — $/sqft
last 12 mo · ≤1 miLoading sold comps…