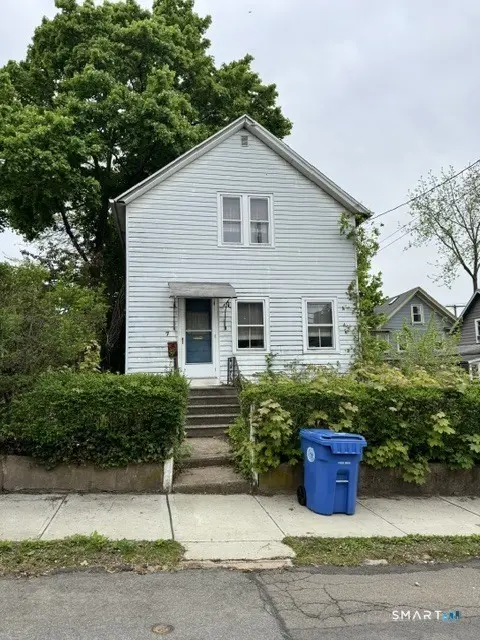
7 Clifton St · New Haven, CT
Flood risk 1/10 · Minimal
- FEMA flood zone
- X (unshaded)
- Chance of flooding over 30 yrs
- 0.0%
- Est. flood insurance / yr
- $473 – $860
Fire risk 3/10 · Minor
- Est. fire insurance / yr
- $829 – $1,539
Heat risk 6/10 · Moderate
- Hot days now (above 97°F)
- 7 days/yr
- Hot days in 30 yrs
- 16 days/yr
Wind risk 6/10 · Moderate
- Chance of severe wind over 30 yrs
- 64.0%
Air-quality risk 5/10 · Moderate
- Unhealthy air days now
- 6 days/yr
- Unhealthy air days in 30 yrs
- 8 days/yr
Risk factors via First Street. Map © Google.
Why this score? — see what drove the C- grade
The composite is a weighted blend of 9 inputs, each scored 0–100. Each bar is that input's sub-score; the figure is the points it added to the 100-point composite (weight × sub-score).
- Cash flow +15.8/30.0
- ARV discount +15.0/15.0
- 1% rule +4.9/10.0
- DSCR +4.9/10.0
- Livability +4.0/5.0
- Rent growth +3.5/5.0
- Condition / age +2.5/5.0
- Schools +1.5/10.0
- Appreciation +0.0/10.0
$186,600
🖨 Deal sheet (PDF) 📄 Offer letter ✓ Due diligence
Listing remarks
Two bedroom Cape Code in a historic district. One full bathroom and one half bathroom. Livingroom, dining room and kitchen on the first floor. The house needs a lot of work.
Key facts
- 3,049 sq ft lot
- Built 1900
- Listed 5 days
Property features AI
Exterior
- Utilities: Public water connected; Public sewer connected
- Home design: Single-family home; Gable roof
- Construction: Frame construction; Stone foundation; Asphalt shingle roof
- Exterior features: Located in a historic district; White exterior siding
Interior
- Kitchen: Refrigerator included
- Bedrooms: 2 bedrooms
- Bathrooms: 1 full bathroom; 1 half bathroom
- Heating & cooling: Hot air heating; Natural gas heat
- Interior features: Full, unfinished basement
- Laundry & utility: Laundry in the basement / lower level
Neighborhood map
What this means for you Summary
Snapshot
- This is a 2-bed/1.0-bath single-family listed at $187k.
Deal economics
- At list price, monthly cash flow is $85 ($1k/yr) — positive.
- The deal already cash-flows at list — no discount required.
- To meet the 1% rule (rent ≥ 1% of price), the offer needs to be $185k (1.0% below list).
- Recommended offer: $185k (1.0% below list) — sets the bar for 1% rule.
- Cap rate 6.8% vs local median 4.8% in New Haven — top-decile yield for the area; either an underpriced asset or a hidden risk that comps aren't pricing in. Stress-test before assuming the spread holds.
Location & tenants
- Location reads 79/100 on livability (#31 in CT, #2,190 nationally) — a middle-class / working-renter tenant base. Strengths: amenities A+, commute A+, health & safety A+; Watch: employment D, crime F.
- New Haven School District (urban): math 12% / reading 25% proficiency, ranked #147 of 153 in CT (top 96%) — low school quality limits family demand, transient renter base, plan for 1-2y turnover; 66% free/reduced lunch — lower-income household profile, screen leases tightly.
- Zoned schools: Betsy Ross Arts Magnet School (math 12% / reading 27%, grade F, #161 of 175 statewide, top 93%, 327 students, 70% FRL) — zoned schools at 70% FRL track the district average.
- Market conditions: Rents rising fast (+4.1%/yr); 102 active listings in the ZIP; 40 comparable units currently listed for rent nearby; rentals at typical pace (median 25d on market — plan ~3-4 weeks tenant-placement turnaround); 1,059 units permitted in South Central Connecticut Planning Region in 2024 (779 in 5+ unit buildings).
- At $1,847/mo this rent would consume 46% of the median local household income ($48k/yr) (locally 2664% of renters already pay >50% of income on rent) — very limited rent-growth headroom before tenants either downsize or default.
Forward outlook
- Local home prices are declining (-3.0%/yr); year-one equity from $1k of loan paydown is wiped out by about $6k of value loss. Plan a longer hold.
Negotiation context
- Only 5 days on market — expect competitive offers; lowballing is unlikely to land.
- Current owner paid $90k; list at $187k implies a 108% gain — meaningful room to come down on a strong offer.
Risks & watch-outs
- Watch-outs: built in 1900 — expect roof / HVAC / electrical / plumbing capex.
- Climate carrying-cost: major wind risk, 64% chance of damaging wind over 30y; extreme-heat days projected 7→16/yr by 2055 (HVAC capex compounding) — expect insurance premiums to compound above CPI over the hold.
Questions for the listing agent
- Built in 1900 — when were the roof, HVAC, electrical panel, plumbing, and water heater last replaced?
- Is there a deadline driving the sale (1031 exchange, divorce, estate, relocation)? That informs how much negotiation room exists.
- Schools are D-rated, which usually means shorter tenancies and higher turnover. Who's the typical renter profile here, and what's been the actual vacancy rate?
- Crime grade is F in this area — have there been break-ins, vandalism, or insurance claims at this property in the last 3 years? What carrier currently insures it and at what premium?
- What's the average days-on-market for RENTAL listings here right now (not sales)? A rising rental-DOM trend means longer vacancies and softer asking-rent achievability than the comps imply.
- What's the recent tenant-quality profile in this submarket — average credit score on applications, eviction rate, late-payment / NSF rate, and stable-employment percentage? A property-management company in the area should have these aggregated.
- How much new for-sale + rental construction is in the pipeline within 1–3 miles? Heavy new supply typically softens prices + rents 12–24 months out; constrained supply supports both.
Investment metrics
- 1% rule
- 0.99% ✗
- Cap rate
- 6.84%
- Cash-on-cash
- 1.95%
- DSCR
- 1.09
- GRM
- 8.4
CMA / ARV
- ARV (median comp)
- $284,015
- List price
- $186,600
- Delta
- -34.30%
- Verdict
- UNDERPRICED
- Comps
- 20 within 1.0 mi
Show comp detail 10 sales within ~0.75 mi
| Address | Dist | Beds/Ba | Sqft | Sold | Price | $/sf | Match |
|---|---|---|---|---|---|---|---|
| 7 Clifton St | 0.00mi | 2/1.5 | 980 (0%) | 0mo | $186,600 | $190 | 98 |
| 16 Hulse St | 0.08mi | 2/1.5 | 1,003 (+2%) | 10mo | $265,000 | $264 | 82 |
| 16 1st Ave | 0.30mi | 2/1.0 | 1,008 (+3%) | 9mo | $350,000 | $347 | 74 |
| 134 Rosewood Ave | 0.44mi | 3/1.0 (+1) | 1,040 (+6%) | 1mo | $330,000 | $317 | 64 |
| 72 Pierpont St | 0.51mi | 2/1.0 | 912 (-7%) | 2mo | $220,000 | $241 | 63 |
| 29 Mountain Top Ln | 0.57mi | 2/1.0 | 1,008 (+3%) | 12mo | $203,000 | $201 | 58 |
| 3 Highview Ln | 0.48mi | 3/1.5 (+1) | 1,072 (+9%) | 0mo | $430,000 | $401 | 55 |
| 813 Russell St | 0.61mi | 3/1.0 (+1) | 1,008 (+3%) | 11mo | $248,000 | $246 | 53 |
| 44 Rosewood Ave | 0.41mi | 2/1.0 | 840 (-14%) | 9mo | $190,000 | $226 | 50 |
| 83 View Ter | 0.72mi | 3/2.0 (+1) | 1,104 (+13%) | 8mo | $380,000 | $344 | 30 |
Match score weights: distance 35% · size 25% · config 20% · recency 20%. Top-matched comps best support the ARV.
Projected returns pro-forma
-3.0% appreciation · 4.12% rent growth · sell at horizon
- IRR
- -11.8%
- Equity multiple
- 0.57×
- Total profit
- $-22,646
- Equity at exit
- $27,823
- IRR
- -0.9%
- Equity multiple
- 0.93×
- Total profit
- $-3,595
- Equity at exit
- $16,134
Cash invested: $52,248 (down + closing). Projections, not guarantees.
Landlord ↔ Tenant lean methodology
- Overall (STATE)
- 27 Tenant-Leaning
- State Connecticut
- 27 Tenant-Leaning · D+7
- County
- — inherits STATE
- City
- — inherits STATE
ZIP-level market 06513
- Home prices YoY
- -7.8%
- Rents YoY
- 4.1%
- Active inventory
- 102
- Price-to-rent
- 8.4×
Monthly cashflow live
- Estimated rent
- $1,847 high interval (Pro) →
- Mortgage (P&I)
- −$979
- Tax from tax record
- −$318 /mo · $3,820/yr
- Insurance
- −$78
- HOA
- −$0
- Vacancy / Maint / Mgmt
- −$388
- Net cashflow
- $85
Break-even live
Sensitivity live
| Price | -10% $191 | -5% $138 | +0% $85 | +5% $32 | +10% $-21 |
|---|---|---|---|---|---|
| Rent | -10% $-61 | -5% $12 | +0% $85 | +5% $158 | +10% $231 |
| Rate | -1.0pp $179 | -0.5pp $132 | base $85 | +0.5pp $37 | +1.0pp $-13 |
UW: 25.0% down · 7.5% · 30yr · 1.5% tax · 5.0% vac · 8.0% maint · 8.0% mgmt
Financing live
Cash to close
- Down payment
- $46,650
- Closing costs
- $5,598
- Reserves months
- —
- Total cash needed
- —
Loan-product check · same deal, 3 products live
Conventional
25% down · 7.5% · 30yr
- Down + closing
- —
- Monthly P&I
- —
- Monthly cashflow
- —
- DSCR
- —
- Eligible?
- —
Personal DTI + credit; lowest rate.
DSCR
20% down · 8.5% · 30yr
- Down + closing
- —
- Monthly P&I
- —
- Monthly cashflow
- —
- DSCR
- —
- Eligible?
- —
No personal income docs; deal must DSCR.
Hard money
10% down · 12.0% · 12mo
- Down + closing
- —
- Monthly P&I
- —
- Monthly cashflow
- —
- DSCR
- —
- Eligible?
- —
Short-term bridge; refi at stabilization.
Rent comps 40 comps
| Address | Beds | Baths | Sqft | Rent | $/sqft | DOM | Units | Dist |
|---|---|---|---|---|---|---|---|---|
| 40 Exchange St Unit 2 New Haven, CT | 3.0 | 1.0 | 1000 | $2,050 | $2.05 | 45d | 1 | 0.30mi |
| 152 Lenox St New Haven, CT | 2.0 | 1.0 | 833 | $2,000 | $2.40 | 5d | 1 | 0.44mi |
| 55 Pierpont St Unit 1 New Haven, CT | 3.0 | 1.0 | 1014 | $2,100 | $2.07 | 25d | 1 | 0.46mi |
| 55 Pierpont St Unit 1 New Haven, CT | 3.0 | 1.0 | 1014 | $2,100 | $2.07 | 23d | 1 | 0.46mi |
| 57 Maltby St Unit 2nd Front New Haven, CT | 2.0 | 1.0 | 800 | $1,395 | $1.74 | 5d | 1 | 0.49mi |
| 30 Bright St Unit 2 New Haven, CT | 3.0 | 2.0 | 993 | $2,000 | $2.01 | 45d | 1 | 0.50mi |
| 76 Revere St Unit 2R New Haven, CT | 2.0 | 1.0 | 1000 | $1,850 | $1.85 | 25d | 1 | 0.52mi |
| 76 Revere St Unit 2L New Haven, CT | 2.0 | 1.0 | 880 | $1,750 | $1.99 | 5d | 1 | 0.53mi |
| 61 Revere St New Haven, CT | 1.0 | 1.0 | 700 | $1,250 | $1.79 | 5d | 1 | 0.53mi |
| 213 Ferry St Unit 3 B New Haven, CT | 2.0 | 1.0 | 626 | $1,650 | $2.64 | 45d | 1 | 0.55mi |
| 121 Lexington Ave #11 New Haven, CT | 2.0 | 1.5 | 936 | $2,000 | $2.14 | 16d | 1 | 0.56mi |
| 80 New Haven, CT | 2.0 | 1.0 | 850 | $1,900 | $2.24 | 5d | 2 | 0.57mi |
| 10 Rowe St New Haven, CT | 2.0 | 1.0 | 1100 | $1,900 | $1.73 | 13d | 1 | 0.59mi |
| 34 Wolcott St #3 New Haven, CT | 3.0 | 1.0 | 1115 | $1,700 | $1.52 | 25d | 1 | 0.61mi |
| 110 Maltby St New Haven, CT | 1.0 | 1.0 | 760 | $1,550 | $2.04 | 16d | 1 | 0.62mi |
| 483 Ferry St Unit 3 New Haven, CT | 2.0 | 1.0 | 900 | $1,650 | $1.83 | 45d | 1 | 0.65mi |
| 258 Fairmont Ave Unit 258 New Haven, CT | 2.0 | 1.5 | 1000 | $1,895 | $1.90 | 25d | 1 | 0.75mi |
| 186 Farren Ave Unit 2 New Haven, CT | 2.0 | 1.0 | 700 | $1,600 | $2.29 | 45d | 1 | 0.76mi |
| 173 Farren Ave New Haven, CT | 3.0 | 1.0 | 875 | $1,850 | $2.11 | 4d | 1 | 0.77mi |
| 173 Farren Ave Unit 3 New Haven, CT | 3.0 | 1.0 | 800 | $2,050 | $2.56 | 45d | 1 | 0.77mi |
| 173 Farren Ave Unit 3 New Haven, CT | 3.0 | 1.0 | 800 | $2,050 | $2.56 | 25d | 1 | 0.77mi |
| 339 Eastern St New Haven, CT | 2.0 | 1.0 | 505 | $1,600 | $3.17 | 45d | 6 | 0.78mi |
| 153 Dover St New Haven, CT | 2.0 | 1.0 | 888 | $1,800 | $2.03 | 13d | 1 | 0.79mi |
| 153 Dover St Unit D New Haven, CT | 2.0 | 1.0 | 888 | $1,750 | $1.97 | 45d | 1 | 0.79mi |
| 153 Dover St New Haven, CT | 2.0 | 1.0 | 888 | $1,750 | $1.97 | 25d | 1 | 0.79mi |
| 383 Lombard St #383 New Haven, CT | 2.0 | 1.5 | 968 | $2,100 | $2.17 | 25d | 1 | 0.80mi |
| 25 Pardee St Unit 2nd Floor New Haven, CT | 3.0 | 1.0 | 980 | $1,900 | $1.94 | 45d | 1 | 0.84mi |
| 241 Quinnipiac Ave New Haven, CT | 2.0 | 1.5 | 900 | $1,995 | $2.22 | 45d | 1 | 0.86mi |
| 187 Saltonstall Ave Unit 2 New Haven, CT | 2.0 | 1.0 | 798 | $1,800 | $2.26 | 16d | 1 | 0.89mi |
| 20 Maltby Pl New Haven, CT | 3.0 | 1.0 | 1100 | $1,900 | $1.73 | 5d | 1 | 0.91mi |
| 430 Eastern St New Haven, CT | 1.0–3.0 | 1.0–1.5 | 900 | $1,832 | $2.04 | 4d | 2 | 0.94mi |
| 210 Wolcott St Unit 3B New Haven, CT | 3.0 | 1.0 | 750 | $2,000 | $2.67 | 25d | 1 | 0.94mi |
| 210 Burwell St New Haven, CT | 2.0 | 1.0 | 900 | $1,800 | $2.00 | 16d | 1 | 0.95mi |
| 43 Farren Ave Unit 1 New Haven, CT | 2.0 | 1.0 | 968 | $1,900 | $1.96 | 23d | 1 | 1.00mi |
| 1399 State St Unit 5B New Haven, CT | 1.0 | 1.0 | 700 | $1,595 | $2.28 | 45d | 1 | 1.03mi |
| 1397 State St Unit 6 New Haven, CT | 2.0 | 1.5 | 1000 | $1,695 | $1.70 | 45d | 1 | 1.03mi |
| 261 View St New Haven, CT | 2.0 | 1.0 | 1100 | $2,400 | $2.18 | 45d | 1 | 1.19mi |
| 22 Chamberlain St #22 New Haven, CT | 2.0 | 1.5 | 990 | $1,950 | $1.97 | 25d | 1 | 1.19mi |
| 1050 State St New Haven, CT | 3.0 | 1.0–2.0 | 919 | $4,094 | $4.45 | 4d | 21 | 1.28mi |
| 535 East St Unit 535 East-Unit 1 New Haven, CT | 2.0 | 1.0 | 830 | $1,675 | $2.02 | 23d | 1 | 1.29mi |
Listing history 2 events
-
2026-05-13$186,600 Active 173-char remark
-
1992-09-02soldstatus $89,900
ⓘ Source: listings_history table (triggers on properties + properties_extension) + one-shot
backfill from property_details.listing_events for pre-trigger history.
Tax reassessment forecast CT · Partial reset (capped growth)
- Current annual tax
- $3,820 · $318/mo
- Projected year-2 tax
- $3,907 · $326/mo
- Expected delta
- +$87/yr (+$7/mo · 2.3%)
ⓘ Screening estimate from a state-policy table — verify with the county assessor before closing.
Climate risk First Street
- Flood 1/10 Low FEMA zone X (unshaded) · 0% chance over 30 yrs
- Wildfire 3/10 Moderate
- Heat 6/10 Major 7 d/yr ≥97°F today · 16 d/yr by 30 yrs out
- Wind 6/10 Major 64% chance of damaging wind over 30 yrs
- Air quality 5/10 Major 6 unhealthy d/yr today · 8 by 30 yrs out
Nearby sold comps map
Loading sold comps map…
Walkable amenities ~0.75 mi
Loading nearby amenities…
Taxation est. · year 1
- Rental income
- $22,170
- − Mortgage interest
- −$10,453
- − Property taxes
- −$3,820
- − Insurance
- −$933
- − Repairs & maintenance
- −$1,774
- − Management
- −$1,774
- − Depreciation
- −$5,428
- Taxable loss
- −$2,011
- Est. tax savings @ 24.0%
- +$483
- After-tax cash flow
- $1,501/yr
For passive investors: Depreciation is non-cash, so a rental often shows a tax loss while cash-flowing — sheltering income. Rental losses are passive: they offset passive income freely, and up to $25,000/yr can offset ordinary (W-2) income if you actively participate and your MAGI is under $100k (phasing out to $0 by $150k); unused losses carry forward. On sale, claimed depreciation is recaptured at up to 25%, and gains may owe capital-gains tax (a 1031 exchange can defer both). Figures are a year-1 estimate at your 24.0% rate — not tax advice; consult a CPA.
Schools (NCES district)
- District
- New Haven School District
- NCES district ID
- 0902790
- Math proficiency
- 12% ▼ -10.00%
- Reading proficiency
- 25% ▼ -10.00%
- Median HH income
- $38,058
- Composite
- 15.48/100
- National rank
- #9308
- State rank
- #147 of 153 in CT
Livability — New Haven
- Score
- 79/100
- State rank
- #31
- US rank
- #2190
Category grades
Schools grade is shown separately in the Schools card above.
Census & demographics
- Census place
- New Haven, CT
- County
- New Haven County · 688,236 people
- City population
- 132,813
- Metro
- New Haven-Milford, CT
- Population (ZIP)
- 38,888
- Household income
- $48,500
- Rent vs Own
- Severe rent burden
- 2664.0
Population outlook (South Central Connecticut County) Hauer SSP2
- By 2040
- 608,362
Race, ethnicity, and origin ACS 2023
- Neighborhood character
- Diverse neighborhood (Simpson 0.66)
- Race & ethnicity
- Hispanic / Latino 47% White 26% Black 22% Two or more races 12% Asian 1%
- Hispanic origin (detail)
- Mexican 7% Puerto Rican 25% Dominican 2%
- Common ancestry
- Romanian 2% Lithuanian 1% Slovak 1%
- Foreign-born
- 17% · Canada, Jamaica, South Korea
- Languages at home
- 56% English-only · Spanish 39% Other Indo-European 1% Russian/Polish/Slavic 1%
Political lean MEDSL · South Central Connecticut
- 2024 margin
- Strong D (+20.1) · D 59.0% · R 38.9% · Other 2.1%
- All cycles
- 2024: D+20.1
Not yet ingested
- Civics
- —
Market trends
- HPI YoY
- ▼ -30.87%
- Current HPI
- 364.006
- Rent YoY
- ▲ 4.12%
- Metro
- New Haven-Milford, CT
- State GDP YoY
- ▲ 1.06%
- F500 in state
- 38
Industry mix (Fortune 500 HQ in CT)
| Industry | F500 HQs | Revenue |
|---|---|---|
| Industrial Machinery | 4 | $38B |
|
||
| Insurance | 3 | $71B |
|
||
| Financial Services | 2 | $25B |
|
||
| Transportation / Logistics | 2 | $18B |
|
||
| Healthcare | 1 | $247B |
|
||
| Telecommunications | 1 | $55B |
|
||
Price history
+107.6% since first listed3 events — show timeline
- 2026-05-19 Pending — Smart MLS
- 2026-05-13 Listed $186,600 Smart MLS
- 1992-09-02 Sold (Public Records) $89,900 Public Records
Property tax history
+1.7%/yrLatest (2023): $3,820 · -6.4% YoY. Source: county tax records.
Cash-flow waterfall
monthlySold comps — $/sqft
last 12 mo · ≤1 miLoading sold comps…