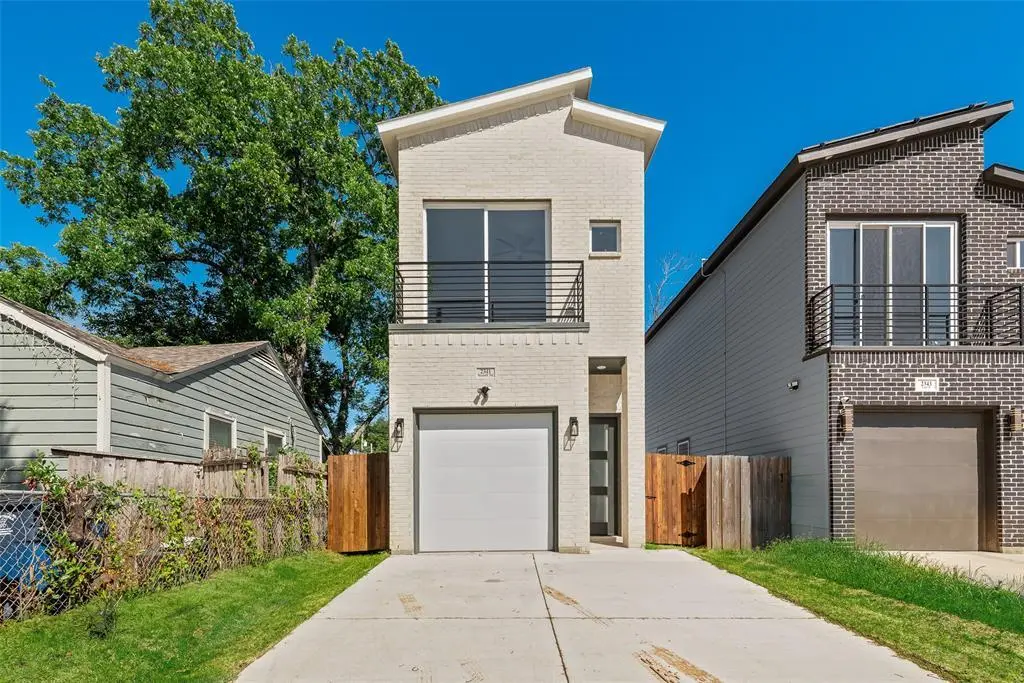
2341 Scott St · Dallas, TX
Flood risk 1/10 · Minimal
- FEMA flood zone
- X
- Chance of flooding over 30 yrs
- 0.0%
- Est. flood insurance / yr
- $507 – $1,088
Fire risk 3/10 · Minor
- Est. fire insurance / yr
- $1,222 – $2,270
Heat risk 7/10 · Major
- Hot days now (above 110°F)
- 7 days/yr
- Hot days in 30 yrs
- 24 days/yr
Wind risk 6/10 · Moderate
- Chance of severe wind over 30 yrs
- 27.0%
Air-quality risk 2/10 · Minimal
- Unhealthy air days now
- 1 days/yr
- Unhealthy air days in 30 yrs
- 2 days/yr
Risk factors via First Street. Map © Google.
Why this score? — see what drove the C- grade
The composite is a weighted blend of 9 inputs, each scored 0–100. Each bar is that input's sub-score; the figure is the points it added to the 100-point composite (weight × sub-score).
- Cash flow +13.8/30.0
- ARV discount +11.8/15.0
- Appreciation +5.4/10.0
- Rent growth +4.3/5.0
- DSCR +4.2/10.0
- Livability +4.0/5.0
- Schools +2.8/10.0
- 1% rule +2.7/10.0
- Condition / age +2.5/5.0
$286,000
🖨 Deal sheet (PDF) 📄 Offer letter ✓ Due diligence
Listing remarks
High ceiling, decorative lights, XL-large glass sliding door with patio access in main bedroom, electric fireplace, wall design and outdoor patio
Key facts
- High ceiling
- Decorative lights
- Electric fireplace
Tags
Property features AI
Finance
- HOA & community: No HOA; Community features include a park
Exterior
- Parking: 1-car attached garage; Carport space for 1 vehicle; Driveway parking; On-street parking
- Utilities: City water; City sewer; Concrete and curbs
- Home design: Single family residence; Two levels; New construction (2026)
- Construction: Brick and siding construction; Smart home features
- Exterior features: Private yard; Wood fencing; Lot is cleared with few trees; Other structures include separate entry quarters
Interior
- Kitchen: Dishwasher; Disposal; Electric cooktop; Electric oven; Microwave; Kitchen island; Granite countertops; Eat-in kitchen
- Bedrooms: 3 bedrooms (primary bedroom located on second level)
- Flooring: Carpet; Luxury vinyl plank
- Bathrooms: 3 full bathrooms
- Interior features: Decorative lighting; Eat-in kitchen; Flat screen wiring; Granite counters; Kitchen island; Open floorplan; Smart technology
- Laundry & utility: Electric water heater
Neighborhood map
What this means for you Summary
Snapshot
- This is a 3-bed/2.5-bath single-family listed at $286k.
Deal economics
- At list price, monthly cash flow is $27 ($323/yr) — positive.
- The deal already cash-flows at list — no discount required.
- To meet the 1% rule (rent ≥ 1% of price), the offer needs to be $221k (22.9% below list).
- Recommended offer: $221k (22.9% below list) — sets the bar for 1% rule.
- Cap rate 6.4% vs local median 2.3% in Dallas — top-decile yield for the area; either an underpriced asset or a hidden risk that comps aren't pricing in. Stress-test before assuming the spread holds.
Location & tenants
- Location reads 81/100 on livability (#24 in TX, #1,380 nationally) — a professional / high-income tenant draw. Strengths: amenities A+, commute A+, housing A+; Watch: crime F.
- Dallas ISD (urban): math 31% / reading 36% proficiency, ranked #559 of 826 in TX (top 68%) — families likely to look elsewhere, expect single-tenant / working-renter base with shorter leases; 83% free/reduced lunch — lower-income household profile, screen leases tightly.
- Zoned schools: Joseph J Rhoads Learning Center (math 13% / reading 18%, grade F, #3,990 of 4,322 statewide, top 93%, 101 students, 94% FRL); Billy Earl Dade Middle (math 18% / reading 23%, grade F, #1,407 of 1,662 statewide, top 86%, 636 students, 100% FRL); Lincoln Humanities/Communications Magnet High Sch (math 8% / reading 20%, grade F, #1,529 of 1,632 statewide, top 94%, 700 students, 92% FRL).
- Zoned-school proficiency averages 17% at this address vs 34% district-wide (-17 pts) — the specific schools serving this property underperform the Dallas ISD average; the district grade overstates school quality for this exact location.
- Market conditions: Rents rising fast (+7.2%/yr); 247 active listings in the ZIP; 26 comparable units currently listed for rent nearby; rentals at typical pace (median 26d on market — plan ~3-4 weeks tenant-placement turnaround); 12,577 units permitted in Dallas County in 2024 (6,829 in 5+ unit buildings).
- At $2,205/mo this rent would consume 58% of the median local household income ($46k/yr) (locally 1464% of renters already pay >50% of income on rent) — very limited rent-growth headroom before tenants either downsize or default.
Forward outlook
- In year one you build about $4k of equity ($2k loan paydown + $2k appreciation (0.8% local appreciation)).
- Dallas County population projected at +35% by 2050 — long-run rental-demand tailwind backs the buy-and-hold thesis.
- At projected returns (0.8% appreciation + 7.2% rent growth), your $80k cash investment doubles in ~8 years — after that, you're playing with house money.
- By year 8, paydown + projected appreciation supports a ~$35k cash-out refi (75% LTV) — recoverable capital for the next deal without selling this one.
Negotiation context
- It's been on market 31 days — a 3% lower offer ($277k) is reasonable based on typical stale-listing flexibility.
Risks & watch-outs
- Climate carrying-cost: major wind risk, 27% chance of damaging wind over 30y; extreme-heat days projected 7→24/yr by 2055 (HVAC capex compounding) — expect insurance premiums to compound above CPI over the hold.
Questions for the listing agent
- It's been on market 31 days. Have you received any prior offers? Is the seller open to a 23% concession, seller financing, or rate buy-down credit?
- Is there a deadline driving the sale (1031 exchange, divorce, estate, relocation)? That informs how much negotiation room exists.
- Crime grade is F in this area — have there been break-ins, vandalism, or insurance claims at this property in the last 3 years? What carrier currently insures it and at what premium?
- What's the average days-on-market for RENTAL listings here right now (not sales)? A rising rental-DOM trend means longer vacancies and softer asking-rent achievability than the comps imply.
- What's the recent tenant-quality profile in this submarket — average credit score on applications, eviction rate, late-payment / NSF rate, and stable-employment percentage? A property-management company in the area should have these aggregated.
- How much new for-sale + rental construction is in the pipeline within 1–3 miles? Heavy new supply typically softens prices + rents 12–24 months out; constrained supply supports both.
Investment metrics
- 1% rule
- 0.77% ✗
- Cap rate
- 6.41%
- Cash-on-cash
- 0.40%
- DSCR
- 1.02
- GRM
- 10.8
CMA / ARV
- ARV (on-the-fly)
- $316,217
- Comps found
- 12
Show comp detail 12 sales within ~0.75 mi
| Address | Dist | Beds/Ba | Sqft | Sold | Price | $/sf | Match |
|---|---|---|---|---|---|---|---|
| 2333 Bethurum Ave | 0.14mi | 3/2.5 | 1,700 (+0%) | 5mo | $309,000 | $182 | 88 |
| 2411 Saint Clair Dr | 0.12mi | 3/2.5 | 1,780 (+5%) | 4mo | $289,800 | $163 | 83 |
| 2413 Saint Clair Dr | 0.11mi | 3/2.5 | 1,780 (+5%) | 4mo | $289,800 | $163 | 82 |
| 2402 Dyson St | 0.15mi | 3/3.5 | 1,750 (+4%) | 2mo | $332,000 | $190 | 81 |
| 2530 Lowery St | 0.28mi | 4/2.5 (+1) | 1,750 (+4%) | 3mo | $309,000 | $177 | 74 |
| 6112 Carlton Garret St | 0.16mi | 3/2.5 | 1,500 (-11%) | 2mo | $279,999 | $187 | 72 |
| 2716 Dorris St | 0.25mi | 3/2.5 | 1,520 (-10%) | 2mo | $284,000 | $187 | 70 |
| 2521 Bethurum Ave | 0.25mi | 3/2.5 | 1,500 (-11%) | 4mo | $339,000 | $226 | 66 |
| 2302 Anderson St | 0.21mi | 3/3.5 | 1,865 (+10%) | 4mo | $349,900 | $188 | 65 |
| 2335 Macon St | 0.46mi | 4/2.0 (+1) | 1,612 (-5%) | 4mo | $299,900 | $186 | 61 |
| 2814 Rochester St | 0.36mi | 4/2.0 (+1) | 1,460 (-14%) | 4mo | $305,000 | $209 | 50 |
| 1638 Garden Dr | 0.47mi | 4/2.0 (+1) | 1,901 (+12%) | 3mo | $324,999 | $171 | 48 |
Match score weights: distance 35% · size 25% · config 20% · recency 20%. Top-matched comps best support the ARV.
Projected returns pro-forma
0.79% appreciation · 7.19% rent growth · sell at horizon
- IRR
- 3.3%
- Equity multiple
- 1.17×
- Total profit
- $13,685
- Equity at exit
- $94,511
- IRR
- 10.3%
- Equity multiple
- 2.34×
- Total profit
- $107,081
- Equity at exit
- $123,215
Cash invested: $80,080 (down + closing). Projections, not guarantees.
Landlord ↔ Tenant lean methodology
- Overall (STATE)
- 87 Strongly Landlord-Friendly
- State Texas
- 87 Strongly Landlord-Friendly · R+5
- County
- — inherits STATE
- City
- — inherits STATE
ZIP-level market 75215
- Home prices YoY
- 0.3%
- Rents YoY
- 7.2%
- Active inventory
- 247
- Price-to-rent
- 10.8×
Monthly cashflow live
- Estimated rent
- $2,205 high interval (Pro) →
- Mortgage (P&I)
- −$1,500
- Tax from tax record
- −$96 /mo · $1,157/yr
- Insurance
- −$119
- HOA
- −$0
- Vacancy / Maint / Mgmt
- −$463
- Net cashflow
- $27
Break-even live
Sensitivity live
| Price | -10% $189 | -5% $108 | +0% $27 | +5% $-54 | +10% $-135 |
|---|---|---|---|---|---|
| Rent | -10% $-147 | -5% $-60 | +0% $27 | +5% $114 | +10% $201 |
| Rate | -1.0pp $171 | -0.5pp $100 | base $27 | +0.5pp $-47 | +1.0pp $-123 |
UW: 25.0% down · 7.5% · 30yr · 1.5% tax · 5.0% vac · 8.0% maint · 8.0% mgmt
Financing live
Cash to close
- Down payment
- $71,500
- Closing costs
- $8,580
- Reserves months
- —
- Total cash needed
- —
Loan-product check · same deal, 3 products live
Conventional
25% down · 7.5% · 30yr
- Down + closing
- —
- Monthly P&I
- —
- Monthly cashflow
- —
- DSCR
- —
- Eligible?
- —
Personal DTI + credit; lowest rate.
DSCR
20% down · 8.5% · 30yr
- Down + closing
- —
- Monthly P&I
- —
- Monthly cashflow
- —
- DSCR
- —
- Eligible?
- —
No personal income docs; deal must DSCR.
Hard money
10% down · 12.0% · 12mo
- Down + closing
- —
- Monthly P&I
- —
- Monthly cashflow
- —
- DSCR
- —
- Eligible?
- —
Short-term bridge; refi at stabilization.
Rent comps 26 comps
| Address | Beds | Baths | Sqft | Rent | $/sqft | DOM | Units | Dist |
|---|---|---|---|---|---|---|---|---|
| 2216 Dyson St Dallas, TX | 3.0 | 2.0 | 1056 | $2,100 | $1.99 | 26d | 1 | 0.03mi |
| 2325 Budd St Dallas, TX | 3.0 | 2.5 | 1696 | $2,350 | $1.39 | 45d | 1 | 0.05mi |
| 2413 Easley St Dallas, TX | 3.0 | 2.5 | 1597 | $2,400 | $1.50 | 9d | 1 | 0.13mi |
| 2203 Anderson St Dallas, TX | 3.0 | 2.5 | 1219 | $2,200 | $1.80 | 45d | 1 | 0.20mi |
| 2207 Anderson St Dallas, TX | 3.0 | 2.5 | 1419 | $2,300 | $1.62 | 9d | 1 | 0.20mi |
| 2521 Bethurum Ave Dallas, TX | 3.0 | 2.5 | 1600 | $2,300 | $1.44 | 45d | 1 | 0.27mi |
| 2246 Hooper St Dallas, TX | 3.0 | 3.0 | 1870 | $2,400 | $1.28 | 45d | 1 | 0.27mi |
| 2807 Valentine St Dallas, TX | 3.0 | 2.0 | 1400 | $1,500 | $1.07 | 16d | 1 | 0.32mi |
| 6602 Bexar St Dallas, TX | 3.0 | 2.5 | 1600 | $2,499 | $1.56 | 9d | 1 | 0.36mi |
| 2927 Dorris St Dallas, TX | 3.0 | 2.0 | 1298 | $1,914 | $1.47 | 45d | 1 | 0.44mi |
| 2727 Choice St Dallas, TX | 3.0 | 2.0 | 1175 | $1,799 | $1.53 | 26d | 1 | 0.47mi |
| 1711 Herald St Dallas, TX | 3.0 | 2.5 | 2140 | $2,350 | $1.10 | 45d | 1 | 0.56mi |
| 1713 Herald St Dallas, TX | 3.0 | 2.5 | 2142 | $2,300 | $1.07 | 9d | 1 | 0.56mi |
| 5000 Linder Ave Dallas, TX | 3.0 | 2.0 | 1327 | $1,950 | $1.47 | 45d | 1 | 0.76mi |
| 2312 Stoneman St Dallas, TX | 4.0 | 3.0 | 2106 | $3,100 | $1.47 | 6d | 1 | 0.82mi |
| 2838 Frost Ave Dallas, TX | 2.0 | 1.0 | 1200 | $1,400 | $1.17 | 26d | 1 | 0.90mi |
| 2840 Oakdale St Dallas, TX | 3.0 | 2.0 | 1379 | $1,900 | $1.38 | 45d | 1 | 0.94mi |
| 2618 Carpenter Ave Dallas, TX | 4.0 | 3.0 | 2050 | $3,200 | $1.56 | 45d | 1 | 0.95mi |
| 4024 Colonial Ave Dallas, TX | 4.0 | 2.0 | 1560 | $2,400 | $1.54 | 26d | 1 | 1.01mi |
| 4024 Myrtle St Dallas, TX | 3.0 | 2.0 | 1106 | $1,595 | $1.44 | 6d | 1 | 1.21mi |
| 4722 Meadow St Dallas, TX | 2.0–3.0 | 2.0 | 1107 | $1,475 | $1.33 | 13d | 4 | 1.21mi |
| 4611 Bradshaw St Dallas, TX | 3.0 | 2.0 | 1145 | $1,550 | $1.35 | 26d | 1 | 1.38mi |
| 4503 Bradshaw St Dallas, TX | 4.0 | 2.0 | 1263 | $1,600 | $1.27 | 9d | 1 | 1.41mi |
| 3609 Cleveland St Dallas, TX | 4.0 | 2.5 | 1500 | $2,700 | $1.80 | 9d | 1 | 1.43mi |
| 3521 S Harwood St Dallas, TX | 3.0 | 2.5 | 1750 | $2,700 | $1.54 | 4d | 1 | 1.46mi |
| 2822 McDermott Ave Dallas, TX | 3.0 | 2.0 | 1200 | $1,795 | $1.50 | 26d | 1 | 1.49mi |
Listing history 16 events
-
2026-06-21days on market $286,000 Active 31 DOM
-
2026-06-18days on market $286,000 Active 28 DOM
-
2026-06-17days on market $286,000 Active 27 DOM
-
2026-06-16days on market $286,000 Active 26 DOM
-
2026-06-15days on market $286,000 Active 25 DOM
-
2026-06-13days on market $286,000 Active 23 DOM
-
2026-06-09days on market $286,000 Active 19 DOM
-
2026-06-08days on market $286,000 Active 18 DOM
-
2026-06-07days on market $286,000 Active 17 DOM
-
2026-06-04days on market $286,000 Active 14 DOM
-
2026-06-03days on market $286,000 Active 13 DOM
-
2026-06-02days on market $286,000 Active 12 DOM
-
2026-06-01days on market $286,000 Active 11 DOM
-
2026-05-31days on market $286,000 Active 10 DOM
-
2026-05-21$286,000 Active
-
2024-12-31soldstatus
ⓘ Source: listings_history table (triggers on properties + properties_extension) + one-shot
backfill from property_details.listing_events for pre-trigger history.
Tax reassessment forecast TX · Resets to sale price
- Current annual tax
- $1,157 · $96/mo
- Projected year-2 tax
- $5,234 · $436/mo
- Expected delta
- +$4,077/yr (+$340/mo · 352.4%)
ⓘ Screening estimate from a state-policy table — verify with the county assessor before closing.
Climate risk First Street
- Flood 1/10 Low FEMA zone X · 0% chance over 30 yrs
- Wildfire 3/10 Moderate
- Heat 7/10 Severe 7 d/yr ≥110°F today · 24 d/yr by 30 yrs out
- Wind 6/10 Major 27% chance of damaging wind over 30 yrs
- Air quality 2/10 Low 1 unhealthy d/yr today · 2 by 30 yrs out
Nearby sold comps map
Loading sold comps map…
Walkable amenities ~0.75 mi
Loading nearby amenities…
Taxation est. · year 1
- Rental income
- $26,465
- − Mortgage interest
- −$16,020
- − Property taxes
- −$1,157
- − Insurance
- −$1,430
- − Repairs & maintenance
- −$2,117
- − Management
- −$2,117
- − Depreciation
- −$8,320
- Taxable loss
- −$4,697
- Est. tax savings @ 24.0%
- +$1,127
- After-tax cash flow
- $1,450/yr
For passive investors: Depreciation is non-cash, so a rental often shows a tax loss while cash-flowing — sheltering income. Rental losses are passive: they offset passive income freely, and up to $25,000/yr can offset ordinary (W-2) income if you actively participate and your MAGI is under $100k (phasing out to $0 by $150k); unused losses carry forward. On sale, claimed depreciation is recaptured at up to 25%, and gains may owe capital-gains tax (a 1031 exchange can defer both). Figures are a year-1 estimate at your 24.0% rate — not tax advice; consult a CPA.
Schools (NCES district)
- District
- Dallas ISD
- NCES district ID
- 4816230
- Math proficiency
- 31% ▼ -16.00%
- Reading proficiency
- 36% ▼ -4.00%
- Median HH income
- $42,881
- Composite
- 28.41/100
- National rank
- #6763
- State rank
- #559 of 826 in TX
Livability — Dallas
- Score
- 81/100
- State rank
- #24
- US rank
- #1380
Category grades
Schools grade is shown separately in the Schools card above.
Census & demographics
- Census place
- Dallas, TX
- County
- Dallas County · 2,612,404 people
- City population
- 1,168,437
- Metro
- Dallas-Fort Worth-Arlington, TX
- Population (ZIP)
- 18,895
- Household income
- $45,557
- Rent vs Own
- Severe rent burden
- 1464.0
Population outlook (Dallas County) Hauer SSP2
- Today (2025)
- 2,979,839 people
- By 2030
- 3,191,823 · +7.1%
- By 2040
- 3,619,611 · +21.5%
- By 2050
- 4,026,915 · +35.1%
- By 2075
- 4,957,073 · +66.4%
- By 2100
- 5,508,725 · +84.9%
Race, ethnicity, and origin ACS 2023
- Neighborhood character
- Diverse neighborhood (Simpson 0.58)
- Race & ethnicity
- Black 59% Hispanic / Latino 25% White 11% Two or more races 10%
- Hispanic origin (detail)
- Mexican 21%
- Common ancestry
- Italian 1% Hispanic 1%
- Foreign-born
- 16% · Canada
- Languages at home
- 74% English-only · Spanish 26%
Political lean MEDSL · Dallas
- 2024 margin
- Strong D (+22.2) · D 60.2% · R 38.0% · Other 1.8%
- 2008→2024 swing
- +6.9pp toward D · 2008: 15.3pp · 2024: 22.2pp
- All cycles
- 2024: D+22.2 2020: D+31.6 2016: D+26.2 2012: D+15.4 2008: D+15.3
Not yet ingested
- Civics
- —
Market trends
- HPI YoY
- ▲ 0.79%
- Current HPI
- 224.2955
- Rent YoY
- ▲ 7.19%
- Metro
- Dallas-Fort Worth-Arlington, TX
- State GDP YoY
- ▲ 3.95%
- F500 in state
- 110
Industry mix (Fortune 500 HQ in TX)
| Industry | F500 HQs | Revenue |
|---|---|---|
| Energy | 16 | $1,198B |
|
||
| Technology | 5 | $198B |
|
||
| Engineering / Construction | 4 | $72B |
|
||
| Energy Services | 3 | $60B |
|
||
| Utilities | 3 | $41B |
|
||
| Healthcare | 2 | $330B |
|
||
Price history
2 events — show timeline
- 2026-05-21 Listed $286,000 NTREIS
- 2024-12-31 Sold (Public Records) — Public Records
Property tax history
+21.3%/yrLatest (2025): $1,157 · +205.3% YoY. Source: county tax records.
Cash-flow waterfall
monthlySold comps — $/sqft
last 12 mo · ≤1 miLoading sold comps…