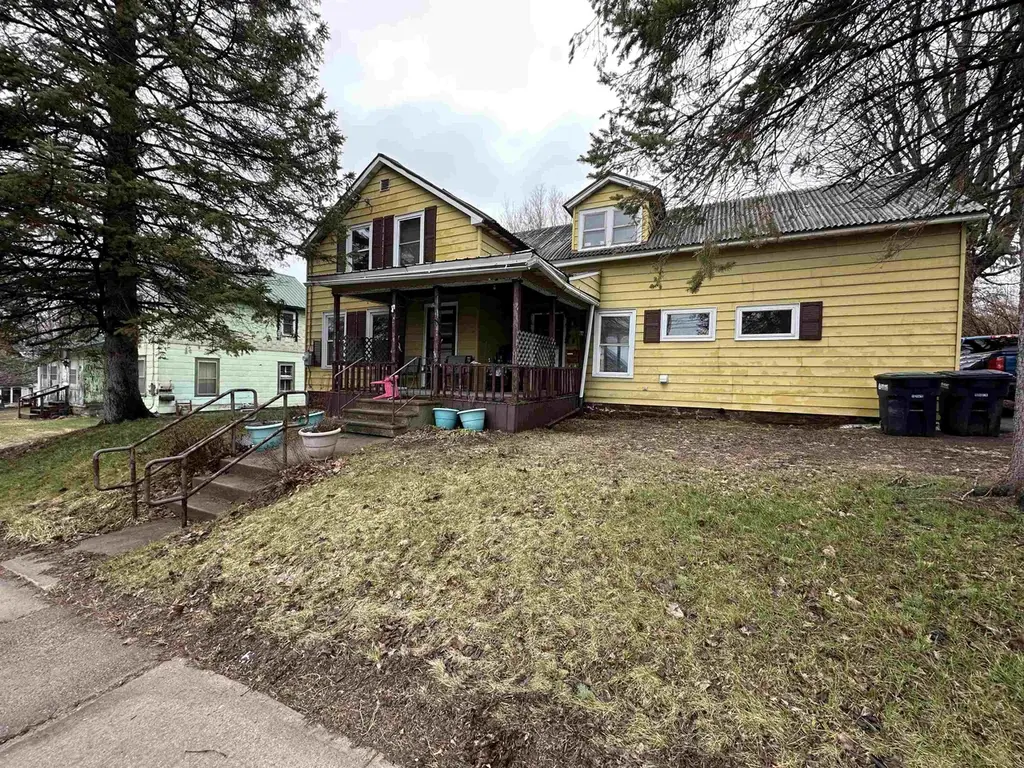
58 S Main St · Norwood, NY
Flood risk 1/10 · Minimal
- FEMA flood zone
- X
- Chance of flooding over 30 yrs
- 0.0%
- Est. flood insurance / yr
- $473 – $860
Fire risk 3/10 · Minor
- Est. fire insurance / yr
- $691 – $1,283
Heat risk 2/10 · Minimal
- Hot days now (above 93°F)
- 7 days/yr
- Hot days in 30 yrs
- 15 days/yr
Wind risk 1/10 · Minimal
- Chance of severe wind over 30 yrs
- —
Air-quality risk 1/10 · Minimal
- Unhealthy air days now
- 0 days/yr
- Unhealthy air days in 30 yrs
- 0 days/yr
Risk factors via First Street. Map © Google.
Why this score? — see what drove the B+ grade
The composite is a weighted blend of 9 inputs, each scored 0–100. Each bar is that input's sub-score; the figure is the points it added to the 100-point composite (weight × sub-score).
- Cash flow +30.0/30.0
- 1% rule +10.0/10.0
- DSCR +10.0/10.0
- ARV discount +7.5/15.0
- Appreciation +6.8/10.0
- Livability +3.4/5.0
- Schools +2.8/10.0
- Rent growth +2.5/5.0
- Condition / age +2.5/5.0
$69,900
🖨 Deal sheet (PDF) 📄 Offer letter ✓ Due diligence
Listing remarks MLS
Welcome to this charming village fixer-upper brimming with potential! This home offers a fantastic opportunity for those looking to add their personal touch while benefiting from several key updates already in place. Upstairs, you’ll find spacious bedrooms featuring newly installed drywall, updated insulation, and refreshed wiring—providing a solid foundation for comfort and efficiency. The home also includes newer appliances, adding convenience to your daily living. Outside, enjoy a generously sized backyard perfect for gardening, entertaining, or creating your own outdoor retreat. With a new electrical entrance already in place, much of the heavy lifting has begun—leaving plenty of room for you to customize and enhance the space to your liking. With great bones, valuable upgrades, and endless possibilities, this property is truly a must-see to fully appreciate its potential.
Key facts
- Newer appliances
- Refreshed wiring
- Updated insulation
Tags
Neighborhood map
What this means for you Summary
Snapshot
- This is a 3-bed/2.0-bath single-family listed at $70k.
Deal economics
- At list price, monthly cash flow is $520 ($6k/yr) — positive.
- The deal already cash-flows at list — no discount required.
- Meets the 1% rule at list price ($1k rent vs $70k).
- Recommended offer: $66k (6.0% below list) — sets the bar for market timing.
Location & tenants
- Location reads 68/100 on livability (#541 in NY) — a middle-class / working-renter tenant base. Strengths: cost of living A+, housing A+, crime A-; Watch: health & safety C-, amenities F, commute F.
- Norwood-Norfolk Central School District (rural): math 30% / reading 36% proficiency, ranked #568 of 590 in NY (top 96%) — families likely to look elsewhere, expect single-tenant / working-renter base with shorter leases.
- Zoned schools: Norwood-Norfolk Elementary School (math 17% / reading 42%, grade F, #1,729 of 2,108 statewide, top 84%, 363 students, 56% FRL); Norwood-Norfolk Middle School (math 17% / reading 34%, grade F, #597 of 729 statewide, top 82%, 295 students, 64% FRL); Norwood-Norfolk School (math 95%, 314 students, 59% FRL) — zoned schools average 60% FRL vs 44% district-wide (16 pts higher); higher-poverty schools than district average — tighter screening recommended.
- Market conditions: 26 active listings in the ZIP; 215 units permitted in St. Lawrence County in 2024 (0 in 5+ unit buildings).
Forward outlook
- In year one you build about $3k of equity ($483 loan paydown + $3k appreciation (3.6% local appreciation)).
- St. Lawrence County population projected at -14% by 2050 — secular population decline; favor cash flow + early exit over multi-decade hold.
- At projected returns (3.6% appreciation + 3.0% rent growth), your $20k cash investment doubles in ~3 years — after that, you're playing with house money.
Negotiation context
- It's been on market 68 days — a 6% lower offer ($66k) is reasonable based on typical stale-listing flexibility.
- Current owner paid $51k; 38% above their basis — modest negotiation headroom, anchor on the comps not their cost.
Risks & watch-outs
- Watch-outs: built in 1900 — expect roof / HVAC / electrical / plumbing capex.
Questions for the listing agent
- It's been on market 68 days. Have you received any prior offers? Is the seller open to a 6% concession, seller financing, or rate buy-down credit?
- Built in 1900 — when were the roof, HVAC, electrical panel, plumbing, and water heater last replaced?
- Why hasn't it sold? Are there any deal-killer items the seller is aware of (foundation, flood, title, zoning, code violations)?
- Is there a deadline driving the sale (1031 exchange, divorce, estate, relocation)? That informs how much negotiation room exists.
- Schools are D-rated, which usually means shorter tenancies and higher turnover. Who's the typical renter profile here, and what's been the actual vacancy rate?
- What's the average days-on-market for RENTAL listings here right now (not sales)? A rising rental-DOM trend means longer vacancies and softer asking-rent achievability than the comps imply.
- What's the recent tenant-quality profile in this submarket — average credit score on applications, eviction rate, late-payment / NSF rate, and stable-employment percentage? A property-management company in the area should have these aggregated.
- How much new for-sale + rental construction is in the pipeline within 1–3 miles? Heavy new supply typically softens prices + rents 12–24 months out; constrained supply supports both.
Investment metrics
- 1% rule
- 1.82% ✓
- Cap rate
- 15.22%
- Cash-on-cash
- 31.90%
- DSCR
- 2.42
- GRM
- 4.6
CMA / ARV
- ARV (median comp)
- $142,895
- List price
- $69,900
- Delta
- -51.08%
- Verdict
- UNDERPRICED
- Comps
- 20 within 1.0 mi
Show comp detail 2 sales within ~0.75 mi
| Address | Dist | Beds/Ba | Sqft | Sold | Price | $/sf | Match |
|---|---|---|---|---|---|---|---|
| 56 N Main St | 0.50mi | 3/1.5 | 1,793 (+5%) | 1mo | $100,000 | $56 | 66 |
| 10 Morgan St | 0.19mi | 4/2.5 (+1) | 1,944 (+14%) | 2mo | $180,000 | $93 | 60 |
Match score weights: distance 35% · size 25% · config 20% · recency 20%. Top-matched comps best support the ARV.
Projected returns pro-forma
3.6% appreciation · 3.0% rent growth · sell at horizon
- IRR
- 38.7%
- Equity multiple
- 3.24×
- Total profit
- $43,816
- Equity at exit
- $33,813
- IRR
- 38.1%
- Equity multiple
- 6.46×
- Total profit
- $106,874
- Equity at exit
- $54,043
Cash invested: $19,572 (down + closing). Projections, not guarantees.
Landlord ↔ Tenant lean methodology
- Overall (STATE)
- 15 Strongly Tenant-Friendly
- State New York
- 15 Strongly Tenant-Friendly · D+10
- County
- — inherits STATE
- City
- — inherits STATE
ZIP-level market 13668
- Home prices YoY
- 1.1%
- Active inventory
- 26
- Price-to-rent
- 4.6×
Monthly cashflow live
- Estimated rent
- $1,270 medium interval (Pro) →
- Mortgage (P&I)
- −$367
- Tax est. 1.5%
- −$87 /mo · $1,048/yr
- Insurance
- −$29
- HOA
- −$0
- Vacancy / Maint / Mgmt
- −$267
- Net cashflow
- $520
Break-even live
Sensitivity live
| Price | -10% $569 | -5% $544 | +0% $520 | +5% $496 | +10% $472 |
|---|---|---|---|---|---|
| Rent | -10% $420 | -5% $470 | +0% $520 | +5% $570 | +10% $621 |
| Rate | -1.0pp $555 | -0.5pp $538 | base $520 | +0.5pp $502 | +1.0pp $484 |
UW: 25.0% down · 7.5% · 30yr · 1.5% tax · 5.0% vac · 8.0% maint · 8.0% mgmt
Financing live
Cash to close
- Down payment
- $17,475
- Closing costs
- $2,097
- Reserves months
- —
- Total cash needed
- —
Loan-product check · same deal, 3 products live
Conventional
25% down · 7.5% · 30yr
- Down + closing
- —
- Monthly P&I
- —
- Monthly cashflow
- —
- DSCR
- —
- Eligible?
- —
Personal DTI + credit; lowest rate.
DSCR
20% down · 8.5% · 30yr
- Down + closing
- —
- Monthly P&I
- —
- Monthly cashflow
- —
- DSCR
- —
- Eligible?
- —
No personal income docs; deal must DSCR.
Hard money
10% down · 12.0% · 12mo
- Down + closing
- —
- Monthly P&I
- —
- Monthly cashflow
- —
- DSCR
- —
- Eligible?
- —
Short-term bridge; refi at stabilization.
Listing history 18 events
-
2026-06-21days on market $69,900 Active 68 DOM
-
2026-06-21days on market $69,900 Active 67 DOM
-
2026-06-18days on market $69,900 Active 65 DOM
-
2026-06-17days on market $69,900 Active 64 DOM
-
2026-06-16days on market $69,900 Active 63 DOM
-
2026-06-15days on market $69,900 Active 62 DOM
-
2026-06-13days on market $69,900 Active 60 DOM
-
2026-06-12pricedays on market $69,900 Active 59 DOM
-
2026-06-09days on market $79,900 Active 56 DOM
-
2026-06-08days on market $79,900 Active 55 DOM
-
2026-06-07days on market $79,900 Active 54 DOM
-
2026-06-07days on market $79,900 Active 53 DOM
-
2026-06-04days on market $79,900 Active 50 DOM
-
2026-06-02days on market $79,900 Active 49 DOM
-
2026-06-01days on market $79,900 Active 48 DOM
-
2026-05-31days on market $79,900 Active 47 DOM
-
2026-04-13$79,900 Active 907-char remark
Show marketing remark (907 chars)
Welcome to this charming village fixer-upper brimming with potential! This home offers a fantastic opportunity for those looking to add their personal touch while benefiting from several key updates already in place. Upstairs, you’ll find spacious bedrooms featuring newly installed drywall, updated insulation, and refreshed wiring—providing a solid foundation for comfort and efficiency. The home also includes newer appliances, adding convenience to your daily living. Outside, enjoy a generously sized backyard perfect for gardening, entertaining, or creating your own outdoor retreat. With a new electrical entrance already in place, much of the heavy lifting has begun—leaving plenty of room for you to customize and enhance the space to your liking. With great bones, valuable upgrades, and endless possibilities, this property is truly a must-see to fully appreciate its potential.
-
2012-01-19soldstatus $50,800
ⓘ Source: listings_history table (triggers on properties + properties_extension) + one-shot
backfill from property_details.listing_events for pre-trigger history.
Climate risk First Street
- Flood 1/10 Low FEMA zone X · 0% chance over 30 yrs
- Wildfire 3/10 Moderate
- Heat 2/10 Low 7 d/yr ≥93°F today · 15 d/yr by 30 yrs out
- Wind 1/10 Low
- Air quality 1/10 Low 0 unhealthy d/yr today · 0 by 30 yrs out
Nearby sold comps map
Loading sold comps map…
Walkable amenities ~0.75 mi
Loading nearby amenities…
Taxation est. · year 1
- Rental income
- $15,241
- − Mortgage interest
- −$3,915
- − Property taxes
- −$1,048
- − Insurance
- −$350
- − Repairs & maintenance
- −$1,219
- − Management
- −$1,219
- − Depreciation
- −$2,033
- Taxable income
- $5,455
- Est. tax owed @ 24.0%
- −$1,309
- After-tax cash flow
- $4,934/yr
For passive investors: Depreciation is non-cash, so a rental often shows a tax loss while cash-flowing — sheltering income. Rental losses are passive: they offset passive income freely, and up to $25,000/yr can offset ordinary (W-2) income if you actively participate and your MAGI is under $100k (phasing out to $0 by $150k); unused losses carry forward. On sale, claimed depreciation is recaptured at up to 25%, and gains may owe capital-gains tax (a 1031 exchange can defer both). Figures are a year-1 estimate at your 24.0% rate — not tax advice; consult a CPA.
Schools (NCES district)
- District
- Norwood-Norfolk Central School District
- NCES district ID
- 3621360
- Math proficiency
- 30% ▼ -8.00%
- Reading proficiency
- 36% ▼ -4.00%
- Median HH income
- $43,492
- Composite
- 28.05/100
- National rank
- #6841
- State rank
- #568 of 590 in NY
Livability — Norwood
- Score
- 68/100
- State rank
- #541
- US rank
- #9728
Category grades
Schools grade is shown separately in the Schools card above.
Census & demographics
- Census place
- Norwood, NY
- City population
- 3,313
- Population (ZIP)
- 3,313
Population outlook (St. Lawrence County) Hauer SSP2
- Today (2025)
- 110,027 people
- By 2030
- 107,455 · -2.3%
- By 2040
- 100,492 · -8.7%
- By 2050
- 94,254 · -14.3%
- By 2075
- 80,175 · -27.1%
- By 2100
- 63,140 · -42.6%
Race, ethnicity, and origin ACS 2023
- Neighborhood character
- Predominantly White (95%)
- Race & ethnicity
- White 95% Two or more races 3% Hispanic / Latino 2%
- Common ancestry
- Lithuanian 13% Portuguese 2% Slovak 2%
- Foreign-born
- 1% · Canada
- Languages at home
- 99% English-only · French/Haitian/Cajun 1%
Political lean MEDSL · St. Lawrence
- 2024 margin
- R (+18.0) · D 41.0% · R 59.0%
- 2008→2024 swing
- -34.3pp toward R · 2008: 16.3pp · 2024: -18.0pp
- All cycles
- 2024: R+18.0 2020: R+11.7 2016: R+10.8 2012: D+16.6 2008: D+16.3
Not yet ingested
- Civics
- —
Market trends
- HPI YoY
- ▲ 3.60%
- Current HPI
- 318.2533
- Rent YoY
- —
- Metro
- —
- State GDP YoY
- ▲ 2.60%
- F500 in state
- 92
Industry mix (Fortune 500 HQ in NY)
| Industry | F500 HQs | Revenue |
|---|---|---|
| Financial Services | 10 | $950B |
|
||
| Consumer Goods | 9 | $162B |
|
||
| Insurance | 4 | $225B |
|
||
| Telecommunications | 2 | $144B |
|
||
| Pharmaceuticals | 2 | $112B |
|
||
| Media / Entertainment | 2 | $69B |
|
||
Price history
+57.3% since first listed2 events — show timeline
- 2026-04-13 Listed $79,900 SLCMLS
- 2012-01-19 Sold (Public Records) $50,800 Public Records
Property tax history
+5.2%/yrLatest (2025): $3,788 · +11.7% YoY. Source: county tax records.
Cash-flow waterfall
monthlySold comps — $/sqft
last 12 mo · ≤1 miLoading sold comps…