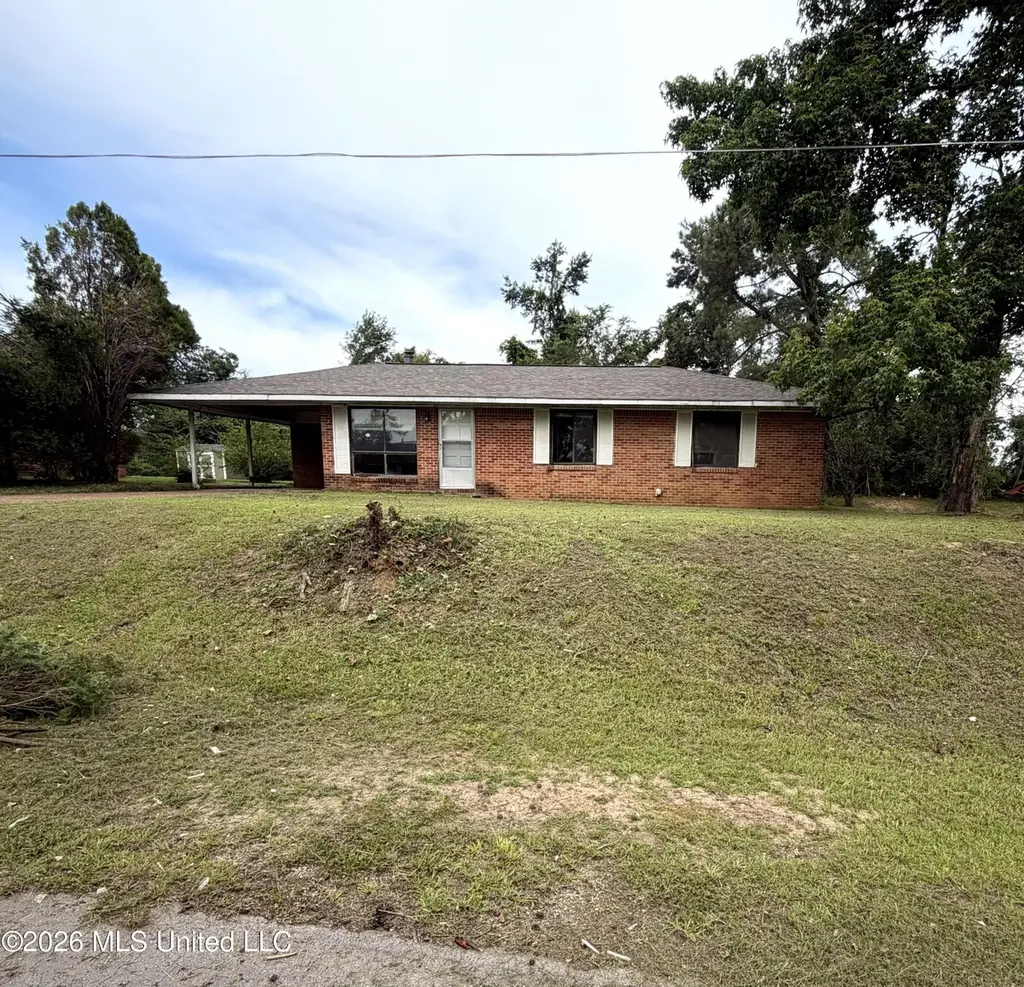
403 Pride St · Oxford, MS
Flood risk 1/10 · Minimal
- FEMA flood zone
- X (unshaded)
- Chance of flooding over 30 yrs
- 0.0%
- Est. flood insurance / yr
- $507 – $1,088
Fire risk 4/10 · Minor
- Est. fire insurance / yr
- $1,241 – $2,305
Heat risk 6/10 · Moderate
- Hot days now (above 109°F)
- 7 days/yr
- Hot days in 30 yrs
- 20 days/yr
Wind risk 4/10 · Minor
- Chance of severe wind over 30 yrs
- 24.0%
Air-quality risk 2/10 · Minimal
- Unhealthy air days now
- 0 days/yr
- Unhealthy air days in 30 yrs
- 1 days/yr
Risk factors via First Street. Map © Google.
Why this score? — see what drove the B- grade
The composite is a weighted blend of 9 inputs, each scored 0–100. Each bar is that input's sub-score; the figure is the points it added to the 100-point composite (weight × sub-score).
- Cash flow +28.0/30.0
- DSCR +9.9/10.0
- 1% rule +7.7/10.0
- ARV discount +7.5/15.0
- Livability +4.4/5.0
- Schools +4.3/10.0
- Rent growth +3.7/5.0
- Condition / age +2.5/5.0
- Appreciation +0.0/10.0
$159,000
🖨 Deal sheet (PDF) 📄 Offer letter ✓ Due diligence
Listing remarks
Great investment opportunity to own this all brick 3 bedroom/1 bath home in Oxford! One level home with a private backyard. Come check it out!
Key facts
- Private backyard
- All brick
- 0.29 acre lot
Tags
Property features AI
Exterior
- Parking: Attached parking; Carport (1 space); Driveway; Concrete surfaces; 1 total parking space
- Utilities: Public water; Public sewer; Electricity available; Water available; Sewer available
- Home design: Single-family residence (house); One level
- Construction: Brick veneer exterior; Slab foundation; Built year reported by owner
- Exterior features: Patio
Interior
- Kitchen: Kitchen on main level
- Bedrooms: Primary bedroom located on the main level
- Flooring: Carpet
- Bathrooms: 1 full bathroom
- Heating & cooling: No central cooling reported
- Interior features: 3 total rooms; Carpet flooring; Living room on the main level; Kitchen on the main level; Primary bedroom on the main level
Neighborhood map
What this means for you Summary
Snapshot
- This is a 3-bed/1.0-bath single-family listed at $159k.
Deal economics
- At list price, monthly cash flow is $496 ($6k/yr) — positive.
- The deal already cash-flows at list — no discount required.
- Meets the 1% rule at list price ($2k rent vs $159k).
- Cap rate 10.0% vs local median 2.8% in Oxford — top-decile yield for the area; either an underpriced asset or a hidden risk that comps aren't pricing in. Stress-test before assuming the spread holds.
Location & tenants
- Location reads 87/100 on livability (#1 in MS, #285 nationally) — a professional / high-income tenant draw. Strengths: amenities A+, commute A+, health & safety A+; Watch: employment C-.
- Oxford School District (town): math 53% / reading 49% proficiency, ranked #12 of 130 in MS (top 9%) — acceptable for families but not a draw, mixed tenant base, ~2y average lease.
- Zoned schools: Bramlett Elementary School (742 students, 100% FRL); Oxford Middle School (math 55% / reading 48%, grade C, #27 of 179 statewide, top 16%, 697 students, 100% FRL); Oxford High School (math 33% / reading 49%, grade F, #49 of 197 statewide, top 25%, 1,345 students, 100% FRL) — zoned schools average 100% FRL vs 42% district-wide (58 pts higher); higher-poverty schools than district average — tighter screening recommended.
- Market conditions: Rents rising fast (+4.8%/yr); 856 active listings in the ZIP; 503 units permitted in Lafayette County in 2024 (0 in 5+ unit buildings).
- This rent runs 35% of the median local income ($68k/yr) — at the standard rent-burdened threshold; future hikes will face affordability resistance.
Forward outlook
- Local home prices are declining (-3.0%/yr); year-one equity from $1k of loan paydown is wiped out by about $5k of value loss. Plan a longer hold.
- Lafayette County population projected at +61% by 2050 — long-run rental-demand tailwind backs the buy-and-hold thesis.
- At projected returns (-3.0% appreciation + 4.8% rent growth), your $45k cash investment doubles in ~8 years — after that, you're playing with house money.
Negotiation context
- Only 7 days on market — expect competitive offers; lowballing is unlikely to land.
Risks & watch-outs
- Climate carrying-cost: extreme-heat days projected 7→20/yr by 2055 (HVAC capex compounding) — expect insurance premiums to compound above CPI over the hold.
Questions for the listing agent
- Built in 1974 — when were the roof, HVAC, electrical panel, plumbing, and water heater last replaced?
- Is there a deadline driving the sale (1031 exchange, divorce, estate, relocation)? That informs how much negotiation room exists.
- Schools are B-rated — typically a magnet for longer-tenancy family renters. What's the average tenant stay here, and is there a school-zone premium baked into asking?
- What's the average days-on-market for RENTAL listings here right now (not sales)? A rising rental-DOM trend means longer vacancies and softer asking-rent achievability than the comps imply.
- What's the recent tenant-quality profile in this submarket — average credit score on applications, eviction rate, late-payment / NSF rate, and stable-employment percentage? A property-management company in the area should have these aggregated.
- How much new for-sale + rental construction is in the pipeline within 1–3 miles? Heavy new supply typically softens prices + rents 12–24 months out; constrained supply supports both.
Investment metrics
- 1% rule
- 1.27% ✓
- Cap rate
- 10.04%
- Cash-on-cash
- 13.37%
- DSCR
- 1.59
- GRM
- 6.6
CMA / ARV
No comps found within radius.
Projected returns pro-forma
-3.0% appreciation · 4.85% rent growth · sell at horizon
- IRR
- 5.5%
- Equity multiple
- 1.22×
- Total profit
- $9,674
- Equity at exit
- $23,707
- IRR
- 16.5%
- Equity multiple
- 2.47×
- Total profit
- $65,522
- Equity at exit
- $13,747
Cash invested: $44,520 (down + closing). Projections, not guarantees.
Landlord ↔ Tenant lean methodology
- Overall (STATE)
- 90 Strongly Landlord-Friendly
- State Mississippi
- 90 Strongly Landlord-Friendly · R+11
- County
- — inherits STATE
- City
- — inherits STATE
ZIP-level market 38655
- Rents YoY
- 4.8%
- Active inventory
- 856
- Price-to-rent
- 6.6×
Monthly cashflow live
- Estimated rent
- $2,019 medium interval (Pro) →
- Mortgage (P&I)
- −$834
- Tax est. 1.5%
- −$199 /mo · $2,385/yr
- Insurance
- −$66
- HOA
- −$0
- Vacancy / Maint / Mgmt
- −$424
- Net cashflow
- $496
Break-even live
Sensitivity live
| Price | -10% $606 | -5% $551 | +0% $496 | +5% $441 | +10% $386 |
|---|---|---|---|---|---|
| Rent | -10% $336 | -5% $416 | +0% $496 | +5% $576 | +10% $655 |
| Rate | -1.0pp $576 | -0.5pp $536 | base $496 | +0.5pp $455 | +1.0pp $413 |
UW: 25.0% down · 7.5% · 30yr · 1.5% tax · 5.0% vac · 8.0% maint · 8.0% mgmt
Financing live
Cash to close
- Down payment
- $39,750
- Closing costs
- $4,770
- Reserves months
- —
- Total cash needed
- —
Loan-product check · same deal, 3 products live
Conventional
25% down · 7.5% · 30yr
- Down + closing
- —
- Monthly P&I
- —
- Monthly cashflow
- —
- DSCR
- —
- Eligible?
- —
Personal DTI + credit; lowest rate.
DSCR
20% down · 8.5% · 30yr
- Down + closing
- —
- Monthly P&I
- —
- Monthly cashflow
- —
- DSCR
- —
- Eligible?
- —
No personal income docs; deal must DSCR.
Hard money
10% down · 12.0% · 12mo
- Down + closing
- —
- Monthly P&I
- —
- Monthly cashflow
- —
- DSCR
- —
- Eligible?
- —
Short-term bridge; refi at stabilization.
Listing history 8 events
-
2026-06-18status $159,000 Pending 7 DOM
-
2026-06-18days on market $159,000 Active 7 DOM
-
2026-06-17days on market $159,000 Active 6 DOM
-
2026-06-16days on market $159,000 Active 5 DOM
-
2026-06-15days on market $159,000 Active 4 DOM
-
2026-06-14days on market $159,000 Active 2 DOM
-
2026-06-12remarks 142-char remark
-
2026-06-12$159,000 Active 1 DOM
ⓘ Source: listings_history table (triggers on properties + properties_extension) + one-shot
backfill from property_details.listing_events for pre-trigger history.
Climate risk First Street
- Flood 1/10 Low FEMA zone X (unshaded) · 0% chance over 30 yrs
- Wildfire 4/10 Moderate
- Heat 6/10 Major 7 d/yr ≥109°F today · 20 d/yr by 30 yrs out
- Wind 4/10 Moderate 24% chance of damaging wind over 30 yrs
- Air quality 2/10 Low 0 unhealthy d/yr today · 1 by 30 yrs out
Nearby sold comps map
Loading sold comps map…
Walkable amenities ~0.75 mi
Loading nearby amenities…
Taxation est. · year 1
- Rental income
- $24,223
- − Mortgage interest
- −$8,906
- − Property taxes
- −$2,385
- − Insurance
- −$795
- − Repairs & maintenance
- −$1,938
- − Management
- −$1,938
- − Depreciation
- −$4,625
- Taxable income
- $3,635
- Est. tax owed @ 24.0%
- −$872
- After-tax cash flow
- $5,078/yr
For passive investors: Depreciation is non-cash, so a rental often shows a tax loss while cash-flowing — sheltering income. Rental losses are passive: they offset passive income freely, and up to $25,000/yr can offset ordinary (W-2) income if you actively participate and your MAGI is under $100k (phasing out to $0 by $150k); unused losses carry forward. On sale, claimed depreciation is recaptured at up to 25%, and gains may owe capital-gains tax (a 1031 exchange can defer both). Figures are a year-1 estimate at your 24.0% rate — not tax advice; consult a CPA.
Schools (NCES district)
- District
- Oxford School District
- NCES district ID
- 2803450
- Math proficiency
- 53% ▼ -17.00%
- Reading proficiency
- 49% ▼ -8.00%
- Median HH income
- $40,878
- Composite
- 42.77/100
- National rank
- #3152
- State rank
- #12 of 130 in MS
Livability — Oxford
- Score
- 87/100
- State rank
- #1
- US rank
- #285
Category grades
Schools grade is shown separately in the Schools card above.
Census & demographics
- Census place
- Oxford, MS
- County
- Lafayette County · 46,156 people
- City population
- 46,156
- Metro
- Oxford, MS
- Population (ZIP)
- 46,156
- Household income
- $68,235
- Rent vs Own
- Severe rent burden
- 1892.0
Population outlook (Lafayette County) Hauer SSP2
- Today (2025)
- 66,984 people
- By 2030
- 74,726 · +11.6%
- By 2040
- 90,806 · +35.6%
- By 2050
- 108,114 · +61.4%
- By 2075
- 151,215 · +125.7%
- By 2100
- 187,997 · +180.7%
Race, ethnicity, and origin ACS 2023
- Neighborhood character
- Predominantly White (68%)
- Race & ethnicity
- White 68% Black 24% Hispanic / Latino 4% Asian 2% Two or more races 2%
- Common ancestry
- Slovak 3% Serbian 2% Lithuanian 1%
- Foreign-born
- 4% · Canada, China, Vietnam
- Languages at home
- 95% English-only · Spanish 2% Other Indo-European 1% Vietnamese 1%
Political lean MEDSL · Lafayette
- 2024 margin
- Strong R (+21.8) · D 38.3% · R 60.0% · Other 1.7%
- 2008→2024 swing
- -9.4pp toward R · 2008: -12.4pp · 2024: -21.8pp
- All cycles
- 2024: R+21.8 2020: R+12.3 2016: R+14.8 2012: R+15.6 2008: R+12.4
Not yet ingested
- Civics
- —
Market trends
- HPI YoY
- ▼ -204.86%
- Current HPI
- 211.5486
- Rent YoY
- ▲ 4.85%
- Metro
- Oxford, MS
- State GDP YoY
- —
- F500 in state
- 0
Price history
1 event — show timeline
- 2026-06-11 Listed $159,000 MLSU
Property tax history
+1.4%/yrLatest (2025): $155 · +9.1% YoY. Source: county tax records.
Cash-flow waterfall
monthlySold comps — $/sqft
last 12 mo · ≤1 miLoading sold comps…