 Duplex
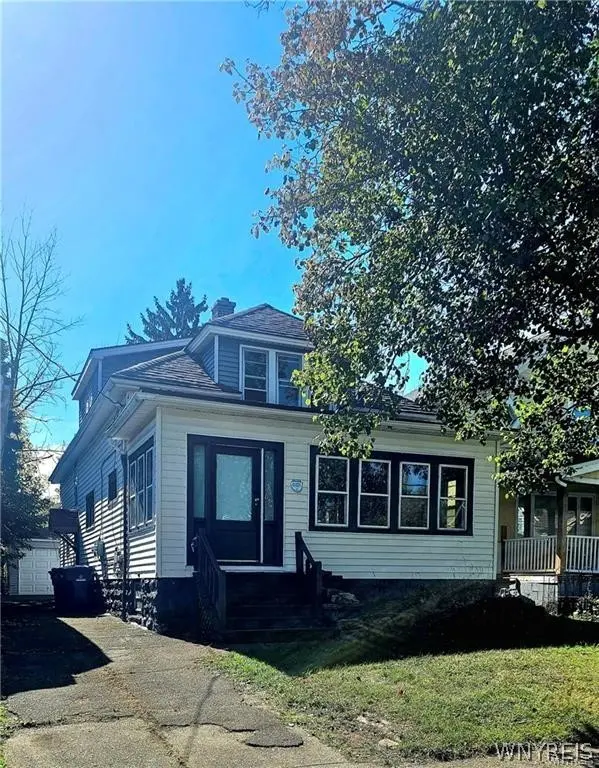
67 Thornton Ave · Buffalo, NY
Flood risk 1/10 · Minimal
- FEMA flood zone
- X (unshaded)
- Chance of flooding over 30 yrs
- 0.0%
- Est. flood insurance / yr
- $473 – $860
Fire risk 1/10 · Minimal
- Est. fire insurance / yr
- $691 – $1,283
Heat risk 3/10 · Minor
- Hot days now (above 93°F)
- 7 days/yr
- Hot days in 30 yrs
- 15 days/yr
Wind risk 1/10 · Minimal
- Chance of severe wind over 30 yrs
- —
Air-quality risk 3/10 · Minor
- Unhealthy air days now
- 2 days/yr
- Unhealthy air days in 30 yrs
- 3 days/yr
Risk factors via First Street. Map © Google.
Why this score? — see what drove the B grade
The composite is a weighted blend of 9 inputs, each scored 0–100. Each bar is that input's sub-score; the figure is the points it added to the 100-point composite (weight × sub-score).
- Cash flow +27.4/30.0
- ARV discount +13.4/15.0
- DSCR +9.6/10.0
- 1% rule +7.4/10.0
- Livability +3.9/5.0
- Schools +3.3/10.0
- Rent growth +2.7/5.0
- Condition / age +2.5/5.0
- Appreciation +0.0/10.0
$210,000
🖨 Deal sheet (PDF) 📄 Offer letter ✓ Due diligence
Multi-family units
County records classify this as Multi-Family (2-4 Unit). Listing-text estimate: 2 units. confirmed
Listing remarks MLS
A mile away from UB campus! TWO unit with stunning woodwork and stained glass throughout. A beautiful large mudroom/ entrance hall opens into a beautiful Living room/ den combo leading into a stunningly framed dining room with exquisite woodwork. Hardwood floors throughout. Open breakfast bar into a partial renovated kitchen. New counter tops, sink and faucet. Renovated bathrooms. A NEW ROOF done in 2024 as well as a BRAND NEW GARAGE. Updated electrical. Ample parking in driveway for extra cars. Solid, dry, stone basement with high ceilings. Close to all shopping areas and UB!
Key facts
- New counter tops
- Large mudroom
- Stained glass
Tags
Neighborhood map
What this means for you Summary
Snapshot
- This is a 2 × 2-bed/1.0-bath units multifamily listed at $210k.
Deal economics
- At list price, monthly cash flow is $612 ($7k/yr) — positive. Per door: $306/mo.
- The deal already cash-flows at list — no discount required.
- Meets the 1% rule at list price ($3k rent vs $210k).
- Recommended offer: $197k (6.0% below list) — sets the bar for market timing.
- Cap rate 9.8% vs local median 8.1% in Buffalo — meaningfully above typical; check what's discounted (condition, days-on-market, listing class) to confirm the premium yield is real.
Location & tenants
- Location reads 77/100 on livability (#195 in NY, #3,011 nationally) — a middle-class / working-renter tenant base. Strengths: commute A+, housing A+, health & safety A+; Watch: crime F, employment D-.
- Buffalo City School District (urban): math 41% / reading 40% proficiency, ranked #535 of 590 in NY (top 91%) — families likely to look elsewhere, expect single-tenant / working-renter base with shorter leases; 75% free/reduced lunch — lower-income household profile, screen leases tightly.
- Zoned schools: International School (math 8% / reading 17%, grade F, #2,048 of 2,108 statewide, top 97%, 981 students, 92% FRL); Hutchinson Central Technical High School (math 96% / reading 32%, grade B-, #807 of 1,100 statewide, top 73%, 1,175 students, 78% FRL).
- Market conditions: Rents flat; 239 active listings in the ZIP; 15 comparable units currently listed for rent nearby; rentals leasing fast (median 5d on market — plan ~1-2 weeks tenant-placement turnaround); lower-income renter base — watch delinquency; 1,244 units permitted in Erie County in 2024 (563 in 5+ unit buildings).
- At $2,612/mo this rent would consume 70% of the median local household income ($45k/yr) (locally 2873% of renters already pay >50% of income on rent) — very limited rent-growth headroom before tenants either downsize or default.
Forward outlook
- Local home prices are declining (-3.0%/yr); year-one equity from $1k of loan paydown is wiped out by about $6k of value loss. Plan a longer hold.
Negotiation context
- It's been on market 73 days — a 6% lower offer ($197k) is reasonable based on typical stale-listing flexibility.
- 4 sale attempts since 7y ago with the ask held roughly flat each time — persistent listings suggest the price (not the market) is what's stuck; bring a comps-based counter.
- Current owner paid $85k; list at $210k implies a 146% gain — meaningful room to come down on a strong offer.
Risks & watch-outs
- Watch-outs: built in 1925 — expect roof / HVAC / electrical / plumbing capex.
Questions for the listing agent
- It's been on market 73 days. Have you received any prior offers? Is the seller open to a 6% concession, seller financing, or rate buy-down credit?
- Can we see the unit-by-unit rent roll, current vacancy, and any below-market leases? What's the average tenancy length?
- What capital expenditures (roof, boiler, parking lot, exteriors) have been made in the last 5 years, and what's planned in the next 2?
- Built in 1925 — when were the roof, HVAC, electrical panel, plumbing, and water heater last replaced?
- Why hasn't it sold? Are there any deal-killer items the seller is aware of (foundation, flood, title, zoning, code violations)?
- Is there a deadline driving the sale (1031 exchange, divorce, estate, relocation)? That informs how much negotiation room exists.
- Crime grade is F in this area — have there been break-ins, vandalism, or insurance claims at this property in the last 3 years? What carrier currently insures it and at what premium?
- What's the average days-on-market for RENTAL listings here right now (not sales)? A rising rental-DOM trend means longer vacancies and softer asking-rent achievability than the comps imply.
- What's the recent tenant-quality profile in this submarket — average credit score on applications, eviction rate, late-payment / NSF rate, and stable-employment percentage? A property-management company in the area should have these aggregated.
- How much new apartment / multifamily construction is in the pipeline within 1–3 miles? Heavy new supply (>2% of stock underway) typically softens rents 12–24 months out; light construction supports rent growth.
Investment metrics
- 1% rule
- 1.24% ✓
- Cap rate
- 9.79%
- Cash-on-cash
- 12.49%
- DSCR
- 1.56
- GRM
- 6.7
CMA / ARV
- ARV (median comp)
- $241,711
- List price
- $210,000
- Delta
- -13.12%
- Verdict
- UNDERPRICED
- Comps
- 20 within 1.0 mi
Show comp detail 12 sales within ~0.75 mi
| Address | Dist | Beds/Ba | Sqft | Sold | Price | $/sf | Match |
|---|---|---|---|---|---|---|---|
| 44 Freeman St | 0.22mi | 4/2.0 | 2,182 (+0%) | 9mo | $144,000 | $66 | 82 |
| 18 Phyllis Ave | 0.24mi | 5/2.0 (+1) | 2,134 (-2%) | 8mo | $138,000 | $65 | 74 |
| 208 Davidson Ave | 0.47mi | 5/2.0 (+1) | 2,199 (+1%) | 8mo | $170,000 | $77 | 65 |
| 19 Dunlop Ave | 0.52mi | 5/2.0 (+1) | 2,160 (-1%) | 6mo | $160,000 | $74 | 65 |
| 192 Berkshire Ave | 0.24mi | 4/2.0 | 1,955 (-10%) | 10mo | $129,000 | $66 | 64 |
| 132 Hewitt Ave | 0.33mi | 4/2.0 | 1,946 (-11%) | 5mo | $125,000 | $64 | 63 |
| 40 Ruspin Ave | 0.53mi | 4/2.0 | 2,351 (+8%) | 2mo | $307,000 | $131 | 60 |
| 35 Erskine Ave | 0.72mi | 4/2.0 | 2,135 (-2%) | 5mo | $170,000 | $80 | 59 |
| 486 Hewitt Ave | 0.48mi | 3/2.0 (-1) | 2,233 (+2%) | 13mo | $176,000 | $79 | 57 |
| 337 Davidson Ave | 0.72mi | 5/2.0 (+1) | 2,199 (+1%) | 9mo | $230,000 | $105 | 53 |
| 171 Davidson Ave | 0.41mi | 4/2.5 | 1,857 (-15%) | 10mo | $200,000 | $108 | 46 |
| 626 Lisbon Ave | 0.71mi | 5/2.0 (+1) | 1,919 (-12%) | 8mo | $250,000 | $130 | 35 |
Match score weights: distance 35% · size 25% · config 20% · recency 20%. Top-matched comps best support the ARV.
Projected returns pro-forma
-3.0% appreciation · 0.67% rent growth · sell at horizon
- IRR
- -0.5%
- Equity multiple
- 0.98×
- Total profit
- $-982
- Equity at exit
- $31,312
- IRR
- 6.6%
- Equity multiple
- 1.44×
- Total profit
- $26,078
- Equity at exit
- $18,157
Cash invested: $58,800 (down + closing). Projections, not guarantees.
Landlord ↔ Tenant lean methodology
- Overall (STATE)
- 15 Strongly Tenant-Friendly
- State New York
- 15 Strongly Tenant-Friendly · D+10
- County
- — inherits STATE
- City
- — inherits STATE
ZIP-level market 14215
- Home prices YoY
- -30.0%
- Rents YoY
- 0.7%
- Active inventory
- 239
- Price-to-rent
- 13.4×
Monthly cashflow live
- Estimated rent
- $2,612 high interval (Pro) →
- Mortgage (P&I)
- −$1,101
- Tax est. 1.5%
- −$262 /mo · $3,150/yr
- Insurance
- −$88
- HOA
- −$0
- Lot rent
- −$0
- Vacancy / Maint / Mgmt
- −$549
- Net cashflow
- $612
Break-even live
Sensitivity live
| Price | -10% $757 | -5% $685 | +0% $612 | +5% $540 | +10% $467 |
|---|---|---|---|---|---|
| Rent | -10% $406 | -5% $509 | +0% $612 | +5% $715 | +10% $819 |
| Rate | -1.0pp $718 | -0.5pp $666 | base $612 | +0.5pp $558 | +1.0pp $502 |
2-unit breakdown (identical units grouped — click to expand)
| Units | Beds | Baths | Est. rent |
|---|---|---|---|
| 2× units | 2 | 1 | $2,612 |
| #1 | 2 | 1 | $1,306 |
| #2 | 2 | 1 | $1,306 |
| Total (2 units) | $2,612 | ||
UW: 25.0% down · 7.5% · 30yr · 1.5% tax · 5.0% vac · 8.0% maint · 8.0% mgmt
Financing live
Cash to close
- Down payment
- $52,500
- Closing costs
- $6,300
- Reserves months
- —
- Total cash needed
- —
Loan-product check · same deal, 3 products live
Conventional
25% down · 7.5% · 30yr
- Down + closing
- —
- Monthly P&I
- —
- Monthly cashflow
- —
- DSCR
- —
- Eligible?
- —
Personal DTI + credit; lowest rate.
DSCR
20% down · 8.5% · 30yr
- Down + closing
- —
- Monthly P&I
- —
- Monthly cashflow
- —
- DSCR
- —
- Eligible?
- —
No personal income docs; deal must DSCR.
Hard money
10% down · 12.0% · 12mo
- Down + closing
- —
- Monthly P&I
- —
- Monthly cashflow
- —
- DSCR
- —
- Eligible?
- —
Short-term bridge; refi at stabilization.
Rent comps 15 comps
| Address | Beds | Baths | Sqft | Rent | $/sqft | DOM | Units | Dist |
|---|---|---|---|---|---|---|---|---|
| 25 Parkridge Ave Buffalo, NY | 3.0 | 1.0 | 1914 | $1,350 | $0.71 | 16d | 1 | 0.40mi |
| 222 Lisbon Ave Unit Upper Buffalo, NY | 3.0 | 1.0 | 1400 | $1,400 | $1.00 | 46d | 1 | 0.66mi |
| 175 Lisbon Ave Buffalo, NY | 5.0 | 2.0 | 2000 | $2,500 | $1.25 | 16d | 1 | 0.69mi |
| 89 Lasalle Ave Buffalo, NY | 1.0–4.0 | 1.0–4.0 | 1024 | $2,997 | $2.93 | 4d | 10 | 0.79mi |
| 85 Highgate Ave Buffalo, NY | 5.0 | 2.0 | 2193 | $3,750 | $1.71 | 16d | 1 | 0.83mi |
| 59 Lisbon Ave Buffalo, NY | 3.0 | 1.0 | 2521 | $1,250 | $0.50 | 26d | 1 | 0.85mi |
| 65 Northrup Pl Buffalo, NY | 5.0 | 2.0 | 1467 | $2,500 | $1.70 | 16d | 1 | 0.87mi |
| 24 Custer St Buffalo, NY | 5.0 | 2.0 | 2500 | $3,000 | $1.20 | 16d | 1 | 1.01mi |
| 60 Englewood Ave Buffalo, NY | 4.0 | 1.0 | 1400 | $1,650 | $1.18 | 0d | 1 | 1.16mi |
| 91 Englewood Ave Buffalo, NY | 4.0 | 1.0 | 2500 | $2,000 | $0.80 | 0d | 1 | 1.23mi |
| 102 Englewood Ave Buffalo, NY | 4.0 | 1.0 | 2426 | $2,750 | $1.13 | 0d | 1 | 1.23mi |
| 63 Montrose Ave Buffalo, NY | 4.0 | 1.0 | 2240 | $2,000 | $0.89 | 0d | 1 | 1.32mi |
| 80 Capen Blvd Buffalo, NY | 5.0 | 2.5 | 2591 | $2,800 | $1.08 | 0d | 1 | 1.39mi |
| 196 Englewood Ave Unit Lower Buffalo, NY | 5.0 | 1.5 | 2560 | $2,000 | $0.78 | 0d | 1 | 1.39mi |
| 163 Carmel Rd Buffalo, NY | 3.0 | 1.0 | 1400 | $1,800 | $1.29 | 5d | 1 | 1.46mi |
Listing history 27 events
-
2026-06-22days on market $210,000 Active 73 DOM
-
2026-06-21days on market $210,000 Active 72 DOM
-
2026-06-18days on market $210,000 Active 69 DOM
-
2026-06-17days on market $210,000 Active 68 DOM
-
2026-06-16days on market $210,000 Active 67 DOM
-
2026-06-15days on market $210,000 Active 66 DOM
-
2026-06-13days on market $210,000 Active 64 DOM
-
2026-06-13days on market $210,000 Active 63 DOM
-
2026-06-10days on market $210,000 Active 61 DOM
-
2026-06-09days on market $210,000 Active 60 DOM
-
2026-06-08days on market $210,000 Active 59 DOM
-
2026-06-07days on market $210,000 Active 58 DOM
-
2026-06-03days on market $210,000 Active 54 DOM
-
2026-06-02days on market $210,000 Active 53 DOM
-
2026-06-01days on market $210,000 Active 52 DOM
-
2026-05-31days on market $210,000 Active 51 DOM
-
2026-04-28status Active 583-char remark
Show marketing remark (583 chars)
A mile away from UB campus! TWO unit with stunning woodwork and stained glass throughout. A beautiful large mudroom/ entrance hall opens into a beautiful Living room/ den combo leading into a stunningly framed dining room with exquisite woodwork. Hardwood floors throughout. Open breakfast bar into a partial renovated kitchen. New counter tops, sink and faucet. Renovated bathrooms. A NEW ROOF done in 2024 as well as a BRAND NEW GARAGE. Updated electrical. Ample parking in driveway for extra cars. Solid, dry, stone basement with high ceilings. Close to all shopping areas and UB!
-
2026-04-27status Pending 583-char remark
Show marketing remark (583 chars)
A mile away from UB campus! TWO unit with stunning woodwork and stained glass throughout. A beautiful large mudroom/ entrance hall opens into a beautiful Living room/ den combo leading into a stunningly framed dining room with exquisite woodwork. Hardwood floors throughout. Open breakfast bar into a partial renovated kitchen. New counter tops, sink and faucet. Renovated bathrooms. A NEW ROOF done in 2024 as well as a BRAND NEW GARAGE. Updated electrical. Ample parking in driveway for extra cars. Solid, dry, stone basement with high ceilings. Close to all shopping areas and UB!
-
2026-04-09$210,000 Active 583-char remark
Show marketing remark (583 chars)
A mile away from UB campus! TWO unit with stunning woodwork and stained glass throughout. A beautiful large mudroom/ entrance hall opens into a beautiful Living room/ den combo leading into a stunningly framed dining room with exquisite woodwork. Hardwood floors throughout. Open breakfast bar into a partial renovated kitchen. New counter tops, sink and faucet. Renovated bathrooms. A NEW ROOF done in 2024 as well as a BRAND NEW GARAGE. Updated electrical. Ample parking in driveway for extra cars. Solid, dry, stone basement with high ceilings. Close to all shopping areas and UB!
-
2025-11-03historical
-
2025-09-30$265,000 Active
-
2019-05-13soldstatus $85,250 Closed Sale or Rented
-
2019-05-13soldstatus $85,250
-
2019-03-20status Under Contract- Do Not Show
-
2019-03-05$74,900 Active
-
2017-04-07soldstatus $64,700
-
2016-09-27soldstatus $25,000
ⓘ Source: listings_history table (triggers on properties + properties_extension) + one-shot
backfill from property_details.listing_events for pre-trigger history.
Climate risk First Street
- Flood 1/10 Low FEMA zone X (unshaded) · 0% chance over 30 yrs
- Wildfire 1/10 Low
- Heat 3/10 Moderate 7 d/yr ≥93°F today · 15 d/yr by 30 yrs out
- Wind 1/10 Low
- Air quality 3/10 Moderate 2 unhealthy d/yr today · 3 by 30 yrs out
Nearby sold comps map
Loading sold comps map…
Walkable amenities ~0.75 mi
Loading nearby amenities…
Taxation est. · year 1
- Rental income
- $31,344
- − Mortgage interest
- −$11,763
- − Property taxes
- −$3,150
- − Insurance
- −$1,050
- − Repairs & maintenance
- −$2,508
- − Management
- −$2,508
- − Depreciation
- −$6,109
- Taxable income
- $4,257
- Est. tax owed @ 24.0%
- −$1,022
- After-tax cash flow
- $6,325/yr
For passive investors: Depreciation is non-cash, so a rental often shows a tax loss while cash-flowing — sheltering income. Rental losses are passive: they offset passive income freely, and up to $25,000/yr can offset ordinary (W-2) income if you actively participate and your MAGI is under $100k (phasing out to $0 by $150k); unused losses carry forward. On sale, claimed depreciation is recaptured at up to 25%, and gains may owe capital-gains tax (a 1031 exchange can defer both). Figures are a year-1 estimate at your 24.0% rate — not tax advice; consult a CPA.
Schools (NCES district)
- District
- Buffalo City School District
- NCES district ID
- 3605850
- Math proficiency
- 41% ▲ 11.00%
- Reading proficiency
- 40% ▲ 7.00%
- Median HH income
- $31,665
- Composite
- 33.17/100
- National rank
- #5544
- State rank
- #535 of 590 in NY
Livability — Buffalo
- Score
- 77/100
- State rank
- #195
- US rank
- #3011
Category grades
Schools grade is shown separately in the Schools card above.
Census & demographics
- Census place
- Buffalo, NY
- County
- Erie County · 714,559 people
- City population
- 440,021
- Metro
- Buffalo-Cheektowaga, NY
- Population (ZIP)
- 42,524
- Household income
- $44,955
- Rent vs Own
- Severe rent burden
- 2873.0
Population outlook (Erie County) Hauer SSP2
- Today (2025)
- 933,037 people
- By 2030
- 935,181 · +0.2%
- By 2040
- 928,531 · -0.5%
- By 2050
- 905,725 · -2.9%
- By 2075
- 834,037 · -10.6%
- By 2100
- 708,033 · -24.1%
Race, ethnicity, and origin ACS 2023
- Neighborhood character
- Predominantly Black (67%)
- Race & ethnicity
- Black 67% White 15% Asian 7% Hispanic / Latino 6% Two or more races 6%
- Hispanic origin (detail)
- Puerto Rican 4%
- Common ancestry
- Romanian 4% Lithuanian 1% Italian 1%
- Foreign-born
- 9% · Canada, China
- Languages at home
- 88% English-only · Other Indo-European 4% Spanish 4% Chinese 1%
Political lean MEDSL · Erie
- 2024 margin
- Lean D (+9.7) · D 54.8% · R 45.2%
- 2008→2024 swing
- -7.9pp toward R · 2008: 17.5pp · 2024: 9.7pp
- All cycles
- 2024: D+9.7 2020: D+14.7 2016: D+4.8 2012: D+15.6 2008: D+17.5
Not yet ingested
- Civics
- —
Market trends
- HPI YoY
- ▼ -126.29%
- Current HPI
- 295.2966
- Rent YoY
- ▲ 0.67%
- Metro
- Buffalo-Cheektowaga, NY
- State GDP YoY
- ▲ 2.60%
- F500 in state
- 92
Industry mix (Fortune 500 HQ in NY)
| Industry | F500 HQs | Revenue |
|---|---|---|
| Financial Services | 10 | $950B |
|
||
| Consumer Goods | 9 | $162B |
|
||
| Insurance | 4 | $225B |
|
||
| Telecommunications | 2 | $144B |
|
||
| Pharmaceuticals | 2 | $112B |
|
||
| Media / Entertainment | 2 | $69B |
|
||
Price history
+740.0% since first listed11 events — show timeline
- 2026-04-28 Relisted — WNYREIS
- 2026-04-27 Pending — WNYREIS
- 2026-04-09 Listed $210,000 WNYREIS
- 2025-11-03 Listing Removed — WNYREIS
- 2025-09-30 Listed $265,000 WNYREIS
- 2019-05-13 Sold (Public Records) $85,250 Public Records
- 2019-05-13 Sold (MLS) $85,250 WNYREIS
- 2019-03-20 Pending — WNYREIS
- 2019-03-05 Listed $74,900 WNYREIS
- 2017-04-07 Sold (Public Records) $64,700 Public Records
- 2016-09-27 Sold (Public Records) $25,000 Public Records
Property tax history
+2.3%/yrLatest (2025): $291 · +0.0% YoY. Source: county tax records.
Cash-flow waterfall
monthlySold comps — $/sqft
last 12 mo · ≤1 miLoading sold comps…