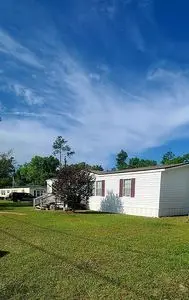
9220 Duggar Rd · Woodville, FL
Flood risk 1/10 · Minimal
- FEMA flood zone
- X (unshaded)
- Chance of flooding over 30 yrs
- 0.0%
- Est. flood insurance / yr
- $507 – $1,088
Fire risk 6/10 · Moderate
- Est. fire insurance / yr
- $947 – $1,759
Heat risk 9/10 · Severe
- Hot days now (above 109°F)
- 7 days/yr
- Hot days in 30 yrs
- 20 days/yr
Wind risk 9/10 · Severe
- Chance of severe wind over 30 yrs
- 99.0%
Air-quality risk 4/10 · Minor
- Unhealthy air days now
- 5 days/yr
- Unhealthy air days in 30 yrs
- 7 days/yr
Risk factors via First Street. Map © Google.
Why this score? — see what drove the B- grade
The composite is a weighted blend of 9 inputs, each scored 0–100. Each bar is that input's sub-score; the figure is the points it added to the 100-point composite (weight × sub-score).
- Cash flow +25.7/30.0
- ARV discount +14.1/15.0
- DSCR +8.6/10.0
- 1% rule +5.9/10.0
- Schools +4.3/10.0
- Livability +3.4/5.0
- Rent growth +2.5/5.0
- Condition / age +2.5/5.0
- Appreciation +0.0/10.0
$147,900
🖨 Deal sheet 📄 Offer letter ✓ Due diligence
Listing remarks MLS
Foreclosure. This price has been approved by lender. Needs some TLC. No Seller's Property Disclosures. Sold as is. 3 Bedrooms, 2 Baths. Large screened in patio and fenced back yard. Also has a carport as well as a shed.
Key facts
- Walk-in closets
- Covered patio
- Rural area
Tags
Neighborhood map
What this means for you Summary
Snapshot
- This is a 3-bed/2.0-bath manufactured listed at $148k.
Deal economics
- At list price, monthly cash flow is $356 ($4k/yr) — positive.
- The deal already cash-flows at list — no discount required.
- Meets the 1% rule at list price ($2k rent vs $148k).
- Recommended offer: $143k (3.0% below list) — sets the bar for market timing.
- Cap rate 9.2% vs local median 4.3% in Woodville — top-decile yield for the area; either an underpriced asset or a hidden risk that comps aren't pricing in. Stress-test before assuming the spread holds.
Location & tenants
- Location reads 67/100 on livability (#581 in FL) — a middle-class / working-renter tenant base. Strengths: cost of living A+, housing A+, crime A-; Watch: employment D, schools F, amenities F.
- Leon (urban): math 48% / reading 53% proficiency, ranked #33 of 73 in FL (top 45%) — acceptable for families but not a draw, mixed tenant base, ~2y average lease.
- Market conditions: 105 active listings in the ZIP; 1,765 units permitted in Leon County in 2024 (975 in 5+ unit buildings).
- This rent runs 40% of the median local income ($48k/yr) — at the standard rent-burdened threshold; future hikes will face affordability resistance.
Forward outlook
- Local home prices are declining (-3.0%/yr); year-one equity from $1k of loan paydown is wiped out by about $4k of value loss. Plan a longer hold.
- Leon County population projected at +23% by 2050 — long-run rental-demand tailwind backs the buy-and-hold thesis.
Negotiation context
- It's been on market 37 days — a 3% lower offer ($143k) is reasonable based on typical stale-listing flexibility.
- 2 sale attempts since 16y ago with the ask held roughly flat each time — persistent listings suggest the price (not the market) is what's stuck; bring a comps-based counter.
- Current owner paid $70k; list at $148k implies a 113% gain — meaningful room to come down on a strong offer.
Risks & watch-outs
- Climate carrying-cost: severe wind risk, 99% chance of damaging wind over 30y; major wildfire risk; extreme-heat days projected 7→20/yr by 2055 (HVAC capex compounding) — expect insurance premiums to compound above CPI over the hold.
Questions for the listing agent
- It's been on market 37 days. Have you received any prior offers? Is the seller open to a 3% concession, seller financing, or rate buy-down credit?
- Is there a deadline driving the sale (1031 exchange, divorce, estate, relocation)? That informs how much negotiation room exists.
- Schools are F-rated, which usually means shorter tenancies and higher turnover. Who's the typical renter profile here, and what's been the actual vacancy rate?
- What's the average days-on-market for RENTAL listings here right now (not sales)? A rising rental-DOM trend means longer vacancies and softer asking-rent achievability than the comps imply.
- What's the recent tenant-quality profile in this submarket — average credit score on applications, eviction rate, late-payment / NSF rate, and stable-employment percentage? A property-management company in the area should have these aggregated.
- How much new for-sale + rental construction is in the pipeline within 1–3 miles? Heavy new supply typically softens prices + rents 12–24 months out; constrained supply supports both.
Investment metrics
- 1% rule
- 1.09% ✓
- Cap rate
- 9.18%
- Cash-on-cash
- 10.30%
- DSCR
- 1.46
- GRM
- 7.7
CMA / ARV
- ARV (on-the-fly)
- $173,472
- Comps found
- 2
Show comp detail 2 sales within ~0.75 mi
| Address | Dist | Beds/Ba | Sqft | Sold | Price | $/sf | Match |
|---|---|---|---|---|---|---|---|
| 1906 Cemetery Rd | 0.36mi | 3/2.0 | 1,320 (+6%) | 0mo | $153,000 | $116 | 73 |
| 2277 E Oak Ridge Rd | 0.41mi | 3/2.0 | 1,150 (-8%) | 5mo | $160,000 | $139 | 64 |
Match score weights: distance 35% · size 25% · config 20% · recency 20%. Top-matched comps best support the ARV.
Projected returns pro-forma
-3.0% appreciation · 3.0% rent growth · sell at horizon
- IRR
- -0.9%
- Equity multiple
- 0.97×
- Total profit
- $-1,362
- Equity at exit
- $22,052
- IRR
- 8.8%
- Equity multiple
- 1.67×
- Total profit
- $27,803
- Equity at exit
- $12,788
Cash invested: $41,412 (down + closing). Projections, not guarantees.
Landlord ↔ Tenant lean methodology
- Overall (STATE)
- 87 Strongly Landlord-Friendly
- State Florida
- 87 Strongly Landlord-Friendly · R+3
- County
- — inherits STATE
- City
- — inherits STATE
ZIP-level market 32305
- Home prices YoY
- -22.5%
- Active inventory
- 105
- Price-to-rent
- 7.7×
Monthly cashflow live
- Estimated rent
- $1,608 medium interval (Pro) →
- Mortgage (P&I)
- −$776
- Tax from tax record
- −$77 /mo · $926/yr
- Insurance
- −$62
- HOA
- −$0
- Vacancy / Maint / Mgmt
- −$338
- Net cashflow
- $356
Break-even live
UW: 25.0% down · 7.5% · 30yr · 1.5% tax · 5.0% vac · 8.0% maint · 8.0% mgmt
Financing live
Cash to close
- Down payment
- $36,975
- Closing costs
- $4,437
- Reserves months
- —
- Total cash needed
- —
Loan-product check · same deal, 3 products live
Conventional
25% down · 7.5% · 30yr
- Down + closing
- —
- Monthly P&I
- —
- Monthly cashflow
- —
- DSCR
- —
- Eligible?
- —
Personal DTI + credit; lowest rate.
DSCR
20% down · 8.5% · 30yr
- Down + closing
- —
- Monthly P&I
- —
- Monthly cashflow
- —
- DSCR
- —
- Eligible?
- —
No personal income docs; deal must DSCR.
Hard money
10% down · 12.0% · 12mo
- Down + closing
- —
- Monthly P&I
- —
- Monthly cashflow
- —
- DSCR
- —
- Eligible?
- —
Short-term bridge; refi at stabilization.
Listing history 21 events
-
2026-06-18days on market $147,900 Active 37 DOM
-
2026-06-17days on market $147,900 Active 36 DOM
-
2026-06-16days on market $147,900 Active 35 DOM
-
2026-06-15days on market $147,900 Active 34 DOM
-
2026-06-14days on market $147,900 Active 32 DOM
-
2026-06-10days on market $147,900 Active 29 DOM
-
2026-06-09days on market $147,900 Active 28 DOM
-
2026-06-08days on market $147,900 Active 27 DOM
-
2026-06-07days on market $147,900 Active 26 DOM
-
2026-06-05days on market $147,900 Active 23 DOM
-
2026-06-03days on market $147,900 Active 22 DOM
-
2026-06-02days on market $147,900 Active 21 DOM
-
2026-06-01days on market $147,900 Active 20 DOM
-
2026-05-31days on market $147,900 Active 19 DOM
-
2026-05-30days on market $147,900 Active 18 DOM
-
2026-05-12$147,900 Active
-
2020-03-03soldstatus $69,500
-
2011-01-19soldstatus $25,000 219-char remark
Show marketing remark (219 chars)
Foreclosure. This price has been approved by lender. Needs some TLC. No Seller's Property Disclosures. Sold as is. 3 Bedrooms, 2 Baths. Large screened in patio and fenced back yard. Also has a carport as well as a shed.
-
2010-12-15$34,900 219-char remark
Show marketing remark (219 chars)
Foreclosure. This price has been approved by lender. Needs some TLC. No Seller's Property Disclosures. Sold as is. 3 Bedrooms, 2 Baths. Large screened in patio and fenced back yard. Also has a carport as well as a shed.
-
2000-08-22soldstatus $58,400
-
1997-10-23soldstatus $25,000
ⓘ Source: listings_history table (triggers on properties + properties_extension) + one-shot
backfill from property_details.listing_events for pre-trigger history.
Tax reassessment forecast FL · Resets to sale price
- Current annual tax
- $926 · $77/mo
- Projected year-2 tax
- $1,228 · $102/mo
- Expected delta
- +$301/yr (+$25/mo · 32.5%)
ⓘ Screening estimate from a state-policy table — verify with the county assessor before closing.
Climate risk First Street
- Flood 1/10 Low FEMA zone X (unshaded) · 0% chance over 30 yrs
- Wildfire 6/10 Major
- Heat 9/10 Extreme 7 d/yr ≥109°F today · 20 d/yr by 30 yrs out
- Wind 9/10 Extreme 99% chance of damaging wind over 30 yrs
- Air quality 4/10 Moderate 5 unhealthy d/yr today · 7 by 30 yrs out
Nearby sold comps map
Loading sold comps map…
Walkable amenities ~0.75 mi
Loading nearby amenities…
Taxation est. · year 1
- Rental income
- $19,291
- − Mortgage interest
- −$8,285
- − Property taxes
- −$926
- − Insurance
- −$740
- − Repairs & maintenance
- −$1,543
- − Management
- −$1,543
- − Depreciation
- −$4,303
- Taxable income
- $1,951
- Est. tax owed @ 24.0%
- −$468
- After-tax cash flow
- $3,798/yr
For passive investors: Depreciation is non-cash, so a rental often shows a tax loss while cash-flowing — sheltering income. Rental losses are passive: they offset passive income freely, and up to $25,000/yr can offset ordinary (W-2) income if you actively participate and your MAGI is under $100k (phasing out to $0 by $150k); unused losses carry forward. On sale, claimed depreciation is recaptured at up to 25%, and gains may owe capital-gains tax (a 1031 exchange can defer both). Figures are a year-1 estimate at your 24.0% rate — not tax advice; consult a CPA.
Schools (NCES district)
- District
- Leon
- NCES district ID
- 1201110
- Math proficiency
- 48% ▼ -13.00%
- Reading proficiency
- 53% ▼ -5.00%
- Median HH income
- $46,339
- Composite
- 42.84/100
- National rank
- #3131
- State rank
- #33 of 73 in FL
Livability — Woodville
- Score
- 67/100
- State rank
- #581
- US rank
- #10723
Category grades
Schools grade is shown separately in the Schools card above.
Census & demographics
- Census place
- Woodville, FL
- County
- Leon County · 294,472 people
- Metro
- Tallahassee, FL
- Population (ZIP)
- 19,384
- Household income
- $48,045
- Rent vs Own
- Severe rent burden
- 654.0
Population outlook (Leon County) Hauer SSP2
- Today (2025)
- 315,507 people
- By 2030
- 330,677 · +4.8%
- By 2040
- 358,465 · +13.6%
- By 2050
- 386,804 · +22.6%
- By 2075
- 465,480 · +47.5%
- By 2100
- 519,959 · +64.8%
Race, ethnicity, and origin ACS 2023
- Neighborhood character
- Diverse neighborhood (Simpson 0.57)
- Race & ethnicity
- Black 57% White 33% Two or more races 5% Hispanic / Latino 5% Asian 1%
- Common ancestry
- Serbian 1% Hispanic 1% Iranian 1%
- Foreign-born
- 3% · Canada
- Languages at home
- 94% English-only · Spanish 5% Other Indo-European 1%
Political lean MEDSL · Leon
- 2024 margin
- Strong D (+21.8) · D 60.3% · R 38.5% · Other 1.2%
- 2008→2024 swing
- -2.5pp toward R · 2008: 24.3pp · 2024: 21.8pp
- All cycles
- 2024: D+21.8 2020: D+28.3 2016: D+25.1 2012: D+23.6 2008: D+24.3
Not yet ingested
- Civics
- —
Market trends
- HPI YoY
- ▼ -63.40%
- Current HPI
- 218.4834
- Rent YoY
- —
- Metro
- Tallahassee, FL
- State GDP YoY
- ▲ 3.28%
- F500 in state
- 36
Industry mix (Fortune 500 HQ in FL)
| Industry | F500 HQs | Revenue |
|---|---|---|
| Industrial Technology | 2 | $29B |
|
||
| Insurance | 2 | $17B |
|
||
| Retail | 1 | $60B |
|
||
| Technology Distribution | 1 | $58B |
|
||
| Homebuilding | 1 | $35B |
|
||
| Technology Manufacturing | 1 | $35B |
|
||
Price history
+491.6% since first listed6 events — show timeline
- 2026-05-12 Listed $147,900 FSBO.com
- 2020-03-03 Sold (Public Records) $69,500 Public Records
- 2011-01-19 Sold (MLS) $25,000 CATRS
- 2010-12-15 Listed $34,900 CATRS
- 2000-08-22 Sold (Public Records) $58,400 Public Records
- 1997-10-23 Sold (Public Records) $25,000 Public Records
Property tax history
+18.4%/yrLatest (2025): $926 · +35.2% YoY. Source: county tax records.
Cash-flow waterfall
monthlySold comps — $/sqft
last 12 mo · ≤1 miLoading sold comps…