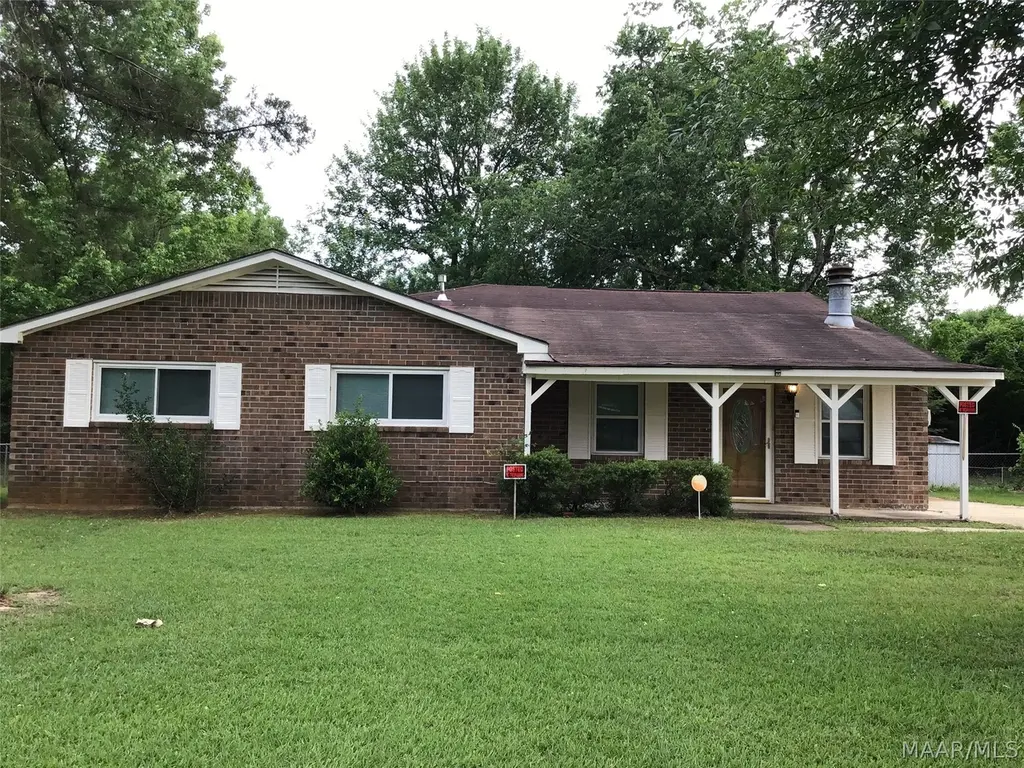
3226 Babette Cir · Montgomery, AL
Flood risk 1/10 · Minimal
- FEMA flood zone
- X (unshaded)
- Chance of flooding over 30 yrs
- 0.0%
- Est. flood insurance / yr
- $507 – $1,088
Fire risk 1/10 · Minimal
- Est. fire insurance / yr
- $916 – $1,700
Heat risk 7/10 · Major
- Hot days now (above 108°F)
- 7 days/yr
- Hot days in 30 yrs
- 19 days/yr
Wind risk 8/10 · Major
- Chance of severe wind over 30 yrs
- 80.0%
Air-quality risk 2/10 · Minimal
- Unhealthy air days now
- 1 days/yr
- Unhealthy air days in 30 yrs
- 3 days/yr
Risk factors via First Street. Map © Google.
Why this score? — see what drove the C grade
The composite is a weighted blend of 9 inputs, each scored 0–100. Each bar is that input's sub-score; the figure is the points it added to the 100-point composite (weight × sub-score).
- Cash flow +24.9/30.0
- ARV discount +9.6/15.0
- DSCR +8.1/10.0
- 1% rule +5.4/10.0
- Rent growth +3.9/5.0
- Livability +3.2/5.0
- Condition / age +2.5/5.0
- Schools +1.7/10.0
- Appreciation +0.0/10.0
$150,000
🖨 Deal sheet (PDF) 📄 Offer letter ✓ Due diligence
Listing remarks
Welcome to 3226 Babette Circle Montgomery, AL, located off Troy Highway and Virginia Loop Road. This corner lot home with 4 bedrooms, 2 full bathrooms and one half bath is ready for its new owner! As you enter the home, you will love the large open living area that flows to the dining/kitchen combo. The updated dining/kitchen features beautiful new countertops and custom built cabinets! The kitchen is equipped with stainless appliances, a stylish backsplash, plenty of cabinet space and a breakfast bar for extra dining space. Just off the kitchen there is a separate entrance door, a wonderful pantry, separate laundry room and the half bathroom. The hallway which leads to each of the 4 bedroo
Key facts
- Corner lot home
- Wonderful pantry
- Stainless appliances
Tags
Property features AI
Finance
- Other: Annual tax information recorded (details available)
Exterior
- Parking: Driveway
- Security: Security system
- Utilities: Public water; Public sewer; Electricity available; Cable available; Gas water heater
- Home design: Single-story brick home; Entry and living areas on first level
- Construction: Brick construction; Slab foundation; Built per public records
- Exterior features: Fence (partial); City lot; Corner lot; Mature trees
Interior
- Kitchen: Kitchen/dining combo; Dishwasher; Electric cooktop; Electric oven; Smooth cooktop; Microwave; Refrigerator; Breakfast bar
- Bedrooms: Master bedroom (first level); Additional bedrooms on first level
- Flooring: Tile
- Bathrooms: 2 full bathrooms; 1 half bathroom
- Heating & cooling: Central heating (electric); Central air (electric)
- Interior features: Blinds; Window treatments; Breakfast bar; Tile flooring; One fireplace
- Laundry & utility: Washer hookup; Dryer hookup; Laundry on first level
Neighborhood map
What this means for you Summary
Snapshot
- This is a 4-bed/2.0-bath single-family listed at $150k.
Deal economics
- At list price, monthly cash flow is $324 ($4k/yr) — positive.
- The deal already cash-flows at list — no discount required.
- Meets the 1% rule at list price ($2k rent vs $150k).
- Recommended offer: $148k (1.5% below list) — sets the bar for market timing.
- Cap rate 8.9% vs local median 6.0% in Montgomery — top-decile yield for the area; either an underpriced asset or a hidden risk that comps aren't pricing in. Stress-test before assuming the spread holds.
Location & tenants
- Location reads 65/100 on livability (#138 in AL) — a middle-class / working-renter tenant base. Strengths: cost of living A+, housing A+; Watch: employment D, crime F, amenities D-.
- Montgomery County (urban): math 9% / reading 31% proficiency, ranked #106 of 129 in AL (top 82%) — low school quality limits family demand, transient renter base, plan for 1-2y turnover; 70% free/reduced lunch — lower-income household profile, screen leases tightly.
- Zoned schools: Fitzpatrick Elementary School (math 2% / reading 22%, grade F, #536 of 627 statewide, top 88%, 363 students, 95% FRL); Mckee Middle School (math 0% / reading 13%, grade F, #249 of 257 statewide, top 98%, 676 students, 94% FRL); Jefferson Davis High School (math 3% / reading 16%, grade F, #258 of 305 statewide, top 85%, 1,522 students, 83% FRL) — zoned schools average 91% FRL vs 70% district-wide (21 pts higher); higher-poverty schools than district average — tighter screening recommended.
- Market conditions: Rents rising fast (+5.7%/yr); 293 active listings in the ZIP; 12 comparable units currently listed for rent nearby; rentals lingering (median 46d on market — plan ~5-8 weeks vacancy on turnover, expect pricing pressure); 50% of comp listings sitting > 30 days — soft ceiling on asking rent; 460 units permitted in Montgomery County in 2024 (37 in 5+ unit buildings).
- This rent runs 34% of the median local income ($55k/yr) — at the standard rent-burdened threshold; future hikes will face affordability resistance.
Forward outlook
- Local home prices are declining (-3.0%/yr); year-one equity from $1k of loan paydown is wiped out by about $4k of value loss. Plan a longer hold.
- Montgomery County population projected to shrink 8% by 2050 — rents likely to lag national; underwrite the cash flow, not the appreciation.
- At projected returns (-3.0% appreciation + 5.7% rent growth), your $42k cash investment doubles in ~9 years — after that, you're playing with house money.
Negotiation context
- It's been on market 27 days — a 2% lower offer ($148k) is reasonable based on typical stale-listing flexibility.
Risks & watch-outs
- Climate carrying-cost: severe wind risk, 80% chance of damaging wind over 30y; extreme-heat days projected 7→19/yr by 2055 (HVAC capex compounding) — expect insurance premiums to compound above CPI over the hold.
Questions for the listing agent
- Built in 1970 — when were the roof, HVAC, electrical panel, plumbing, and water heater last replaced?
- Is there a deadline driving the sale (1031 exchange, divorce, estate, relocation)? That informs how much negotiation room exists.
- Crime grade is F in this area — have there been break-ins, vandalism, or insurance claims at this property in the last 3 years? What carrier currently insures it and at what premium?
- What's the average days-on-market for RENTAL listings here right now (not sales)? A rising rental-DOM trend means longer vacancies and softer asking-rent achievability than the comps imply.
- What's the recent tenant-quality profile in this submarket — average credit score on applications, eviction rate, late-payment / NSF rate, and stable-employment percentage? A property-management company in the area should have these aggregated.
- How much new for-sale + rental construction is in the pipeline within 1–3 miles? Heavy new supply typically softens prices + rents 12–24 months out; constrained supply supports both.
Investment metrics
- 1% rule
- 1.04% ✓
- Cap rate
- 8.89%
- Cash-on-cash
- 9.26%
- DSCR
- 1.41
- GRM
- 8.0
CMA / ARV
- ARV (on-the-fly)
- $157,425
- Comps found
- 5
Show comp detail 5 sales within ~0.75 mi
| Address | Dist | Beds/Ba | Sqft | Sold | Price | $/sf | Match |
|---|---|---|---|---|---|---|---|
| 3218 Riderwood Dr | 0.65mi | 4/2.0 | 1,882 (-10%) | 9mo | $134,000 | $71 | 45 |
| 2845 Peabody Rd | 0.71mi | 3/2.0 (-1) | 1,848 (-12%) | 0mo | $149,900 | $81 | 42 |
| 3910 Strathmore Dr | 0.59mi | 4/2.0 | 1,896 (-10%) | 20mo | $165,000 | $87 | 40 |
| 3213 Riderwood Dr | 0.67mi | 4/2.0 | 1,934 (-8%) | 23mo | $145,000 | $75 | 37 |
| 3857 Strathmore Dr | 0.57mi | 3/2.5 (-1) | 2,307 (+10%) | 19mo | $81,500 | $35 | 34 |
Match score weights: distance 35% · size 25% · config 20% · recency 20%. Top-matched comps best support the ARV.
Projected returns pro-forma
-3.0% appreciation · 5.65% rent growth · sell at horizon
- IRR
- 0.3%
- Equity multiple
- 1.01×
- Total profit
- $566
- Equity at exit
- $22,365
- IRR
- 12.3%
- Equity multiple
- 2.08×
- Total profit
- $45,406
- Equity at exit
- $12,969
Cash invested: $42,000 (down + closing). Projections, not guarantees.
Landlord ↔ Tenant lean methodology
- Overall (STATE)
- 90 Strongly Landlord-Friendly
- State Alabama
- 90 Strongly Landlord-Friendly · R+15
- County
- — inherits STATE
- City
- — inherits STATE
ZIP-level market 36116
- Home prices YoY
- -9.7%
- Rents YoY
- 5.7%
- Active inventory
- 293
- Price-to-rent
- 8.0×
Monthly cashflow live
- Estimated rent
- $1,564 high interval (Pro) →
- Mortgage (P&I)
- −$787
- Tax from tax record
- −$62 /mo · $748/yr
- Insurance
- −$62
- HOA
- −$0
- Vacancy / Maint / Mgmt
- −$328
- Net cashflow
- $324
Break-even live
Sensitivity live
| Price | -10% $409 | -5% $367 | +0% $324 | +5% $282 | +10% $239 |
|---|---|---|---|---|---|
| Rent | -10% $201 | -5% $262 | +0% $324 | +5% $386 | +10% $448 |
| Rate | -1.0pp $400 | -0.5pp $362 | base $324 | +0.5pp $285 | +1.0pp $246 |
UW: 25.0% down · 7.5% · 30yr · 1.5% tax · 5.0% vac · 8.0% maint · 8.0% mgmt
Financing live
Cash to close
- Down payment
- $37,500
- Closing costs
- $4,500
- Reserves months
- —
- Total cash needed
- —
Loan-product check · same deal, 3 products live
Conventional
25% down · 7.5% · 30yr
- Down + closing
- —
- Monthly P&I
- —
- Monthly cashflow
- —
- DSCR
- —
- Eligible?
- —
Personal DTI + credit; lowest rate.
DSCR
20% down · 8.5% · 30yr
- Down + closing
- —
- Monthly P&I
- —
- Monthly cashflow
- —
- DSCR
- —
- Eligible?
- —
No personal income docs; deal must DSCR.
Hard money
10% down · 12.0% · 12mo
- Down + closing
- —
- Monthly P&I
- —
- Monthly cashflow
- —
- DSCR
- —
- Eligible?
- —
Short-term bridge; refi at stabilization.
Rent comps 12 comps
| Address | Beds | Baths | Sqft | Rent | $/sqft | DOM | Units | Dist |
|---|---|---|---|---|---|---|---|---|
| 2699 Whispering Pine Dr Montgomery, AL | 4.0 | 2.0 | 1500 | $1,500 | $1.00 | 15d | 1 | 0.55mi |
| 3855 Woodley Rd Montgomery, AL | 4.0 | 2.0 | 1450 | $1,450 | $1.00 | 45d | 1 | 0.70mi |
| 3633 Woodley Rd Montgomery, AL | 4.0 | 2.0 | 1734 | $1,600 | $0.92 | 23d | 1 | 0.94mi |
| 3824 Glenfern Ct Montgomery, AL | 3.0 | 2.0 | 1600 | $1,450 | $0.91 | 45d | 1 | 0.95mi |
| 6105 Jennifer Ln Montgomery, AL | 3.0 | 2.0 | 1553 | $1,250 | $0.80 | 15d | 1 | 0.97mi |
| 2916 Moorcroft Dr Unit 1043818P Montgomery, AL | 5.0 | 2.5 | 1496 | $5,435 | $3.63 | 15d | 1 | 1.07mi |
| 4590 Troy Hwy Montgomery, AL | 2.0–3.0 | 2.0 | 1330 | $1,299 | $0.98 | 15d | 1 | 1.12mi |
| 2724 Endicott Dr Montgomery, AL | 5.0 | 4.0 | 1857 | $1,750 | $0.94 | 45d | 1 | 1.16mi |
| 2724 Forsyth Ln Montgomery, AL | 4.0 | 2.0 | 1794 | $1,400 | $0.78 | 45d | 1 | 1.27mi |
| 654 Mayflower Dr Montgomery, AL | 3.0 | 2.0 | 1777 | $1,400 | $0.79 | 45d | 1 | 1.35mi |
| 3252 Cheltenham Dr Montgomery, AL | 3.0 | 2.0 | 1705 | $1,200 | $0.70 | 45d | 1 | 1.38mi |
| 4008 Oak Shadow Ln Montgomery, AL | 3.0 | 2.5 | 1741 | $1,395 | $0.80 | 23d | 1 | 1.42mi |
Listing history 17 events
-
2026-06-21days on market $150,000 Active 27 DOM
-
2026-06-18days on market $150,000 Active 24 DOM
-
2026-06-17days on market $150,000 Active 23 DOM
-
2026-06-16days on market $150,000 Active 22 DOM
-
2026-06-15days on market $150,000 Active 21 DOM
-
2026-06-14days on market $150,000 Active 19 DOM
-
2026-06-13days on market $150,000 Active 18 DOM
-
2026-06-10days on market $150,000 Active 16 DOM
-
2026-06-09days on market $150,000 Active 15 DOM
-
2026-06-08days on market $150,000 Active 14 DOM
-
2026-06-07days on market $150,000 Active 13 DOM
-
2026-06-03days on market $150,000 Active 9 DOM
-
2026-06-02days on market $150,000 Active 8 DOM
-
2026-06-01days on market $150,000 Active 7 DOM
-
2026-05-31days on market $150,000 Active 6 DOM
-
2026-05-30days on market $150,000 Active 5 DOM
-
2026-05-25$150,000 Active
ⓘ Source: listings_history table (triggers on properties + properties_extension) + one-shot
backfill from property_details.listing_events for pre-trigger history.
Tax reassessment forecast AL · Resets to sale price
- Current annual tax
- $748 · $62/mo
- Projected year-2 tax
- $748 · $62/mo
- Expected delta
- $0/yr ($0/mo · 0.0%)
ⓘ Screening estimate from a state-policy table — verify with the county assessor before closing.
Climate risk First Street
- Flood 1/10 Low FEMA zone X (unshaded) · 0% chance over 30 yrs
- Wildfire 1/10 Low
- Heat 7/10 Severe 7 d/yr ≥108°F today · 19 d/yr by 30 yrs out
- Wind 8/10 Severe 80% chance of damaging wind over 30 yrs
- Air quality 2/10 Low 1 unhealthy d/yr today · 3 by 30 yrs out
Nearby sold comps map
Loading sold comps map…
Walkable amenities ~0.75 mi
Loading nearby amenities…
Taxation est. · year 1
- Rental income
- $18,768
- − Mortgage interest
- −$8,402
- − Property taxes
- −$748
- − Insurance
- −$750
- − Repairs & maintenance
- −$1,501
- − Management
- −$1,501
- − Depreciation
- −$4,364
- Taxable income
- $1,502
- Est. tax owed @ 24.0%
- −$360
- After-tax cash flow
- $3,529/yr
For passive investors: Depreciation is non-cash, so a rental often shows a tax loss while cash-flowing — sheltering income. Rental losses are passive: they offset passive income freely, and up to $25,000/yr can offset ordinary (W-2) income if you actively participate and your MAGI is under $100k (phasing out to $0 by $150k); unused losses carry forward. On sale, claimed depreciation is recaptured at up to 25%, and gains may owe capital-gains tax (a 1031 exchange can defer both). Figures are a year-1 estimate at your 24.0% rate — not tax advice; consult a CPA.
Schools (NCES district)
- District
- Montgomery County
- NCES district ID
- 0102430
- Math proficiency
- 9% ▼ -21.00%
- Reading proficiency
- 31% ▼ -1.00%
- Median HH income
- $43,902
- Composite
- 17.24/100
- National rank
- #9093
- State rank
- #106 of 129 in AL
Livability — Montgomery
- Score
- 65/100
- State rank
- #138
- US rank
- #13416
Category grades
Schools grade is shown separately in the Schools card above.
Census & demographics
- Census place
- Montgomery, AL
- County
- Montgomery County · 190,016 people
- City population
- 175,913
- Metro
- Montgomery, AL
- Population (ZIP)
- 45,250
- Household income
- $55,160
- Rent vs Own
- Severe rent burden
- 2786.0
Population outlook (Montgomery County) Hauer SSP2
- Today (2025)
- 224,008 people
- By 2030
- 221,460 · -1.1%
- By 2040
- 214,179 · -4.4%
- By 2050
- 204,912 · -8.5%
- By 2075
- 177,821 · -20.6%
- By 2100
- 145,134 · -35.2%
Race, ethnicity, and origin ACS 2023
- Neighborhood character
- Predominantly Black (80%)
- Race & ethnicity
- Black 80% White 12% Two or more races 4% Asian 3% Hispanic / Latino 2%
- Common ancestry
- Italian 1%
- Foreign-born
- 5% · Canada, South Korea
- Languages at home
- 94% English-only · Spanish 2% Other Indo-European 1% Korean 1%
Political lean MEDSL · Montgomery
- 2024 margin
- Solid D (+30.7) · D 64.8% · R 34.1% · Other 1.1%
- 2008→2024 swing
- +11.5pp toward D · 2008: 19.2pp · 2024: 30.7pp
- All cycles
- 2024: D+30.7 2020: D+31.5 2016: D+26.2 2012: D+24.3 2008: D+19.2
Not yet ingested
- Civics
- —
Market trends
- HPI YoY
- ▼ -16.31%
- Current HPI
- 151.8598
- Rent YoY
- ▲ 5.65%
- Metro
- Montgomery, AL
- State GDP YoY
- ▲ 2.94%
- F500 in state
- 4
Industry mix (Fortune 500 HQ in AL)
| Industry | F500 HQs | Revenue |
|---|---|---|
| Financial Services | 1 | $8B |
|
||
| Healthcare | 1 | $5B |
|
||
Price history
1 event — show timeline
- 2026-05-25 Listed $150,000 MAAR
Property tax history
+9.8%/yrLatest (2025): $748 · +22.0% YoY. Source: county tax records.
Cash-flow waterfall
monthlySold comps — $/sqft
last 12 mo · ≤1 miLoading sold comps…