 Multi-family
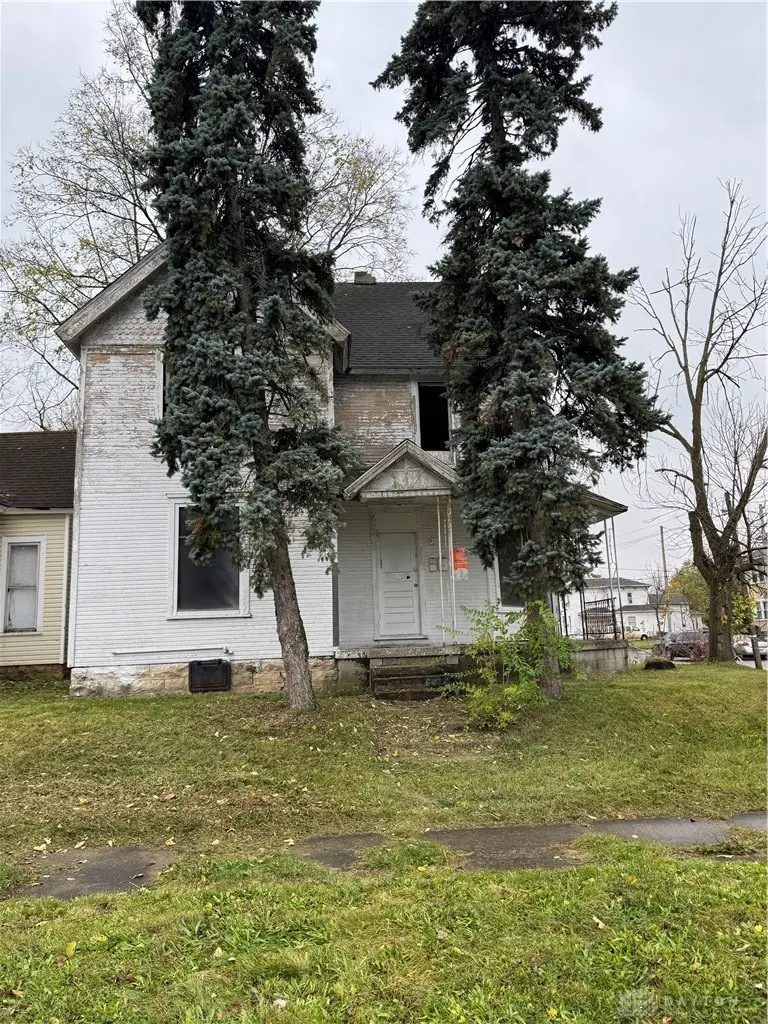
205 E Grand Ave · Springfield, OH
Flood risk 1/10 · Minimal
- FEMA flood zone
- X (unshaded)
- Chance of flooding over 30 yrs
- 0.0%
- Est. flood insurance / yr
- $507 – $1,088
Fire risk 1/10 · Minimal
- Est. fire insurance / yr
- $713 – $1,323
Heat risk 3/10 · Minor
- Hot days now (above 100°F)
- 7 days/yr
- Hot days in 30 yrs
- 18 days/yr
Wind risk 2/10 · Minimal
- Chance of severe wind over 30 yrs
- —
Air-quality risk 3/10 · Minor
- Unhealthy air days now
- 2 days/yr
- Unhealthy air days in 30 yrs
- 3 days/yr
Risk factors via First Street. Map © Google.
Why this score? — see what drove the D grade
The composite is a weighted blend of 9 inputs, each scored 0–100. Each bar is that input's sub-score; the figure is the points it added to the 100-point composite (weight × sub-score).
- Cash flow +15.0/30.0
- ARV discount +7.5/15.0
- 1% rule +5.0/10.0
- DSCR +5.0/10.0
- Livability +2.8/5.0
- Rent growth +2.5/5.0
- Condition / age +2.5/5.0
- Schools +1.9/10.0
- Appreciation +0.0/10.0
$45,000
🖨 Deal sheet (PDF) 📄 Offer letter ✓ Due diligence
Multi-family units
County records classify this as Multi-Family (2-4 Unit). Listing-text estimate: 1 unit. estimate disagrees with records
Listing remarks MLS
Investor special! Affordable duplex on a corner lot with strong upside that can easily be converted back to a single-family home. Solid winter project for investors or owner-occupants looking to rehab and add value. Features include separate units, flexible floorplans, original hardwoods, and generous yard with off-street parking. Sold as-is. Close to schools, shopping, and transit. Cash or renovation financing recommended. Check this one out by appointment today!
Key facts
- Original hardwoods
- Generous yard
- Separate units
Tags
Neighborhood map
What this means for you Summary
Snapshot
- This is a 4-bed/2.0-bath multifamily listed at $45k.
Deal economics
- At list price, monthly cash flow is $1k ($15k/yr) — positive.
- The deal already cash-flows at list — no discount required.
- Meets the 1% rule at list price ($2k rent vs $45k).
- Recommended offer: $40k (12.0% below list) — sets the bar for market timing.
- Cap rate 38.6% vs local median 4.8% in Springfield — top-decile yield for the area; either an underpriced asset or a hidden risk that comps aren't pricing in. Stress-test before assuming the spread holds.
Location & tenants
- Location reads 56/100 on livability (#1,108 in OH) — a working-class tenant base; expect higher turnover. Strengths: cost of living A+, housing A+; Watch: crime F, amenities F, commute F.
- Springfield City School District (urban): math 20% / reading 27% proficiency, ranked #616 of 656 in OH (top 94%) — low school quality limits family demand, transient renter base, plan for 1-2y turnover; 75% free/reduced lunch — lower-income household profile, screen leases tightly.
- Market conditions: 158 active listings in the ZIP; 12 comparable units currently listed for rent nearby; rentals at typical pace (median 15d on market — plan ~3-4 weeks tenant-placement turnaround); lower-income renter base — watch delinquency; 232 units permitted in Clark County in 2024 (116 in 5+ unit buildings).
- At $2,009/mo this rent would consume 55% of the median local household income ($44k/yr) (locally 950% of renters already pay >50% of income on rent) — very limited rent-growth headroom before tenants either downsize or default.
Forward outlook
- Local home prices are declining (-3.0%/yr); year-one equity from $311 of loan paydown is wiped out by about $1k of value loss. Plan a longer hold.
- Clark County population projected at -16% by 2050 — secular population decline; favor cash flow + early exit over multi-decade hold.
- At projected returns (-3.0% appreciation + 3.0% rent growth), your $13k cash investment doubles in ~1 year — after that, you're playing with house money.
Negotiation context
- It's been on market 152 days — a 12% lower offer ($40k) is reasonable based on typical stale-listing flexibility.
- 5 sale attempts since 3y ago with the ask held roughly flat each time — persistent listings suggest the price (not the market) is what's stuck; bring a comps-based counter.
- Current owner paid $28k; list at $45k implies a 61% gain — meaningful room to come down on a strong offer.
Risks & watch-outs
- Watch-outs: property tax is 3.3% of price; built in 1894 — expect roof / HVAC / electrical / plumbing capex.
Questions for the listing agent
- It's been on market 152 days. Have you received any prior offers? Is the seller open to a 12% concession, seller financing, or rate buy-down credit?
- Built in 1894 — when were the roof, HVAC, electrical panel, plumbing, and water heater last replaced?
- Property tax is high relative to price — has the assessment been appealed recently, and will the sale trigger a re-assessment?
- Why hasn't it sold? Are there any deal-killer items the seller is aware of (foundation, flood, title, zoning, code violations)?
- Is there a deadline driving the sale (1031 exchange, divorce, estate, relocation)? That informs how much negotiation room exists.
- Crime grade is F in this area — have there been break-ins, vandalism, or insurance claims at this property in the last 3 years? What carrier currently insures it and at what premium?
- The area grade is low — what's the realistic commute time and amenity access for the typical tenant pool here? Any planned neighborhood developments (good or bad) we should know about?
- What's the average days-on-market for RENTAL listings here right now (not sales)? A rising rental-DOM trend means longer vacancies and softer asking-rent achievability than the comps imply.
- What's the recent tenant-quality profile in this submarket — average credit score on applications, eviction rate, late-payment / NSF rate, and stable-employment percentage? A property-management company in the area should have these aggregated.
- How much new apartment / multifamily construction is in the pipeline within 1–3 miles? Heavy new supply (>2% of stock underway) typically softens rents 12–24 months out; light construction supports rent growth.
Investment metrics
- 1% rule
- 4.46% ✓
- Cap rate
- 38.56%
- Cash-on-cash
- 115.25%
- DSCR
- 6.13
- GRM
- 1.9
CMA / ARV
- ARV (median comp)
- $98,705
- List price
- $45,000
- Delta
- -54.41%
- Verdict
- UNDERPRICED
- Comps
- 20 within 1.0 mi
Show comp detail 7 sales within ~0.75 mi
| Address | Dist | Beds/Ba | Sqft | Sold | Price | $/sf | Match |
|---|---|---|---|---|---|---|---|
| 1202 Clifton Ave | 0.06mi | 4/2.0 | 2,180 (+14%) | 4mo | $124,900 | $57 | 71 |
| 1202-1204 Clifton Ave | 0.06mi | 4/2.0 | 2,180 (+14%) | 4mo | $124,900 | $57 | 71 |
| 1603 Woodward Ave | 0.46mi | 4/2.0 | 1,873 (-2%) | 12mo | $85,000 | $45 | 65 |
| 18-20 W Perrin Ave | 0.30mi | 4/2.0 | 2,064 (+8%) | 13mo | $194,000 | $94 | 63 |
| 1363 S Center Blvd | 0.41mi | 3/2.0 (-1) | 1,862 (-3%) | 11mo | $85,000 | $46 | 61 |
| 1517 Linden Ave | 0.32mi | 4/2.0 | 2,172 (+13%) | 12mo | $116,000 | $53 | 53 |
| 1102-1104 Pine St | 0.72mi | 4/2.0 | 1,636 (-15%) | 7mo | $50,000 | $31 | 36 |
Match score weights: distance 35% · size 25% · config 20% · recency 20%. Top-matched comps best support the ARV.
Projected returns pro-forma
-3.0% appreciation · 3.0% rent growth · sell at horizon
- IRR
- —
- Equity multiple
- 6.54×
- Total profit
- $69,854
- Equity at exit
- $6,710
- IRR
- —
- Equity multiple
- 13.73×
- Total profit
- $160,363
- Equity at exit
- $3,891
Cash invested: $12,600 (down + closing). Projections, not guarantees.
Landlord ↔ Tenant lean methodology
- Overall (STATE)
- 73 Landlord-Friendly
- State Ohio
- 73 Landlord-Friendly · R+6
- County
- — inherits STATE
- City
- — inherits STATE
ZIP-level market 45505
- Home prices YoY
- -34.3%
- Active inventory
- 158
- Price-to-rent
- 3.7×
Monthly cashflow live
- Estimated rent
- $2,009 high interval (Pro) →
- Mortgage (P&I)
- −$236
- Tax from tax record
- −$122 /mo · $1,467/yr
- Insurance
- −$19
- HOA
- −$0
- Vacancy / Maint / Mgmt
- −$422
- Net cashflow
- $1,210
Break-even live
Sensitivity live
| Price | -10% $1,236 | -5% $1,223 | +0% $1,210 | +5% $1,197 | +10% $1,185 |
|---|---|---|---|---|---|
| Rent | -10% $1,051 | -5% $1,131 | +0% $1,210 | +5% $1,290 | +10% $1,369 |
| Rate | -1.0pp $1,233 | -0.5pp $1,222 | base $1,210 | +0.5pp $1,198 | +1.0pp $1,187 |
2-unit breakdown (identical units grouped — click to expand)
| Units | Beds | Baths | Est. rent |
|---|---|---|---|
| 2× units | 2 | 1 | $2,008 |
| #1 | 2 | 1 | $1,004 |
| #2 | 2 | 1 | $1,004 |
| Total (2 units) | $2,009 | ||
UW: 25.0% down · 7.5% · 30yr · 1.5% tax · 5.0% vac · 8.0% maint · 8.0% mgmt
Financing live
Cash to close
- Down payment
- $11,250
- Closing costs
- $1,350
- Reserves months
- —
- Total cash needed
- —
Loan-product check · same deal, 3 products live
Conventional
25% down · 7.5% · 30yr
- Down + closing
- —
- Monthly P&I
- —
- Monthly cashflow
- —
- DSCR
- —
- Eligible?
- —
Personal DTI + credit; lowest rate.
DSCR
20% down · 8.5% · 30yr
- Down + closing
- —
- Monthly P&I
- —
- Monthly cashflow
- —
- DSCR
- —
- Eligible?
- —
No personal income docs; deal must DSCR.
Hard money
10% down · 12.0% · 12mo
- Down + closing
- —
- Monthly P&I
- —
- Monthly cashflow
- —
- DSCR
- —
- Eligible?
- —
Short-term bridge; refi at stabilization.
Rent comps 12 comps
| Address | Beds | Baths | Sqft | Rent | $/sqft | DOM | Units | Dist |
|---|---|---|---|---|---|---|---|---|
| 1306 S Limestone St Springfield, OH | 4.0 | 2.0 | 1452 | $1,695 | $1.17 | 21d | 1 | 0.18mi |
| 18 E Grand Ave Springfield, OH | 4.0 | 2.0 | 1452 | $1,575 | $1.08 | 19d | 1 | 0.20mi |
| 421 Catherine St Springfield, OH | 3.0 | 2.0 | 1498 | $1,500 | $1.00 | 44d | 1 | 0.30mi |
| 830 Oak St Unit 830 Springfield, OH | 4.0 | 1.5 | 1400 | $1,250 | $0.89 | 14d | 1 | 0.79mi |
| 545 W Grand Ave Springfield, OH | 4.0 | 2.0 | 1456 | $1,595 | $1.10 | 3d | 1 | 0.84mi |
| 401 Section St Springfield, OH | 4.0 | 2.0 | 1612 | $1,850 | $1.15 | 11d | 1 | 0.89mi |
| 306 S Plum St Springfield, OH | 4.0 | 2.0 | 1352 | $1,700 | $1.26 | 44d | 1 | 0.90mi |
| 524 W Pleasant St Springfield, OH | 4.0 | 2.0 | 1456 | $1,645 | $1.13 | 11d | 1 | 0.93mi |
| 523 W Mulberry St Springfield, OH | 4.0 | 2.0 | 1456 | $1,825 | $1.25 | 11d | 1 | 0.95mi |
| 356 S Yellow Springs St Springfield, OH | 4.0 | 2.0 | 1606 | $1,825 | $1.14 | 11d | 1 | 0.99mi |
| 302 S Yellow Springs St Springfield, OH | 4.0 | 2.0 | 1456 | $1,845 | $1.27 | 11d | 1 | 1.02mi |
| 220 S Yellow Springs St Springfield, OH | 4.0 | 2.0 | 1456 | $1,645 | $1.13 | 24d | 1 | 1.04mi |
Listing history 36 events
-
2026-06-19days on market $45,000 Active 152 DOM
-
2026-06-18days on market $45,000 Active 151 DOM
-
2026-06-17days on market $45,000 Active 150 DOM
-
2026-06-16days on market $45,000 Active 149 DOM
-
2026-06-15days on market $45,000 Active 148 DOM
-
2026-06-14days on market $45,000 Active 146 DOM
-
2026-06-12days on market $45,000 Active 145 DOM
-
2026-06-09days on market $45,000 Active 142 DOM
-
2026-06-08days on market $45,000 Active 141 DOM
-
2026-06-07days on market $45,000 Active 140 DOM
-
2026-06-05days on market $45,000 Active 137 DOM
-
2026-06-02days on market $45,000 Active 135 DOM
-
2026-06-01days on market $45,000 Active 134 DOM
-
2026-05-31days on market $45,000 Active 133 DOM
-
2026-05-30days on market $45,000 Active 132 DOM
-
2026-01-18$45,000 Active 468-char remark
Show marketing remark (468 chars)
Investor special! Affordable duplex on a corner lot with strong upside that can easily be converted back to a single-family home. Solid winter project for investors or owner-occupants looking to rehab and add value. Features include separate units, flexible floorplans, original hardwoods, and generous yard with off-street parking. Sold as-is. Close to schools, shopping, and transit. Cash or renovation financing recommended. Check this one out by appointment today!
-
2025-12-31historical
-
2025-12-09price $45,000
-
2025-12-01$49,900 Active
-
2024-06-04historical
-
2024-05-20status Pending
-
2024-04-26price $45,000
-
2024-03-22$50,000 Active
-
2023-02-16soldstatus $28,000
-
2023-02-10soldstatus $28,000 Sold
-
2023-02-10soldstatus $28,000 Closed
-
2023-02-10soldstatus $28,000 Closed
-
2023-01-30status Pending
-
2023-01-30status Pending
-
2023-01-24$37,500 Active
-
2023-01-24$37,500 Active
-
2008-09-18soldstatus $32,900
-
2007-09-10soldstatus $65,000
-
2002-02-26soldstatus $38,500
-
1999-04-15soldstatus $31,500
-
1988-12-20soldstatus $30,000
ⓘ Source: listings_history table (triggers on properties + properties_extension) + one-shot
backfill from property_details.listing_events for pre-trigger history.
Tax reassessment forecast OH · Partial reset (capped growth)
- Current annual tax
- $1,467 · $122/mo
- Projected year-2 tax
- $1,467 · $122/mo
- Expected delta
- $0/yr ($0/mo · 0.0%)
ⓘ Screening estimate from a state-policy table — verify with the county assessor before closing.
Climate risk First Street
- Flood 1/10 Low FEMA zone X (unshaded) · 0% chance over 30 yrs
- Wildfire 1/10 Low
- Heat 3/10 Moderate 7 d/yr ≥100°F today · 18 d/yr by 30 yrs out
- Wind 2/10 Low
- Air quality 3/10 Moderate 2 unhealthy d/yr today · 3 by 30 yrs out
Nearby sold comps map
Loading sold comps map…
Walkable amenities ~0.75 mi
Loading nearby amenities…
Taxation est. · year 1
- Rental income
- $24,108
- − Mortgage interest
- −$2,521
- − Property taxes
- −$1,467
- − Insurance
- −$225
- − Repairs & maintenance
- −$1,929
- − Management
- −$1,929
- − Depreciation
- −$1,309
- Taxable income
- $14,729
- Est. tax owed @ 24.0%
- −$3,535
- After-tax cash flow
- $10,987/yr
For passive investors: Depreciation is non-cash, so a rental often shows a tax loss while cash-flowing — sheltering income. Rental losses are passive: they offset passive income freely, and up to $25,000/yr can offset ordinary (W-2) income if you actively participate and your MAGI is under $100k (phasing out to $0 by $150k); unused losses carry forward. On sale, claimed depreciation is recaptured at up to 25%, and gains may owe capital-gains tax (a 1031 exchange can defer both). Figures are a year-1 estimate at your 24.0% rate — not tax advice; consult a CPA.
Schools (NCES district)
- District
- Springfield City School District
- NCES district ID
- 3904481
- Math proficiency
- 20% ▼ -16.00%
- Reading proficiency
- 27% ▼ -12.00%
- Median HH income
- $32,541
- Composite
- 19.12/100
- National rank
- #8834
- State rank
- #616 of 656 in OH
Livability — Springfield
- Score
- 56/100
- State rank
- #1108
- US rank
- #22551
Category grades
Schools grade is shown separately in the Schools card above.
Census & demographics
- Census place
- Springfield, OH
- County
- Clark County · 33,261 people
- City population
- 33,261
- Metro
- Springfield, OH
- Population (ZIP)
- 19,826
- Household income
- $43,819
- Rent vs Own
- Severe rent burden
- 950.0
Population outlook (Clark County) Hauer SSP2
- Today (2025)
- 130,703 people
- By 2030
- 126,952 · -2.9%
- By 2040
- 118,344 · -9.5%
- By 2050
- 109,590 · -16.2%
- By 2075
- 89,464 · -31.6%
- By 2100
- 68,810 · -47.4%
Race, ethnicity, and origin ACS 2023
- Neighborhood character
- Predominantly White (75%)
- Race & ethnicity
- White 75% Black 14% Two or more races 7% Hispanic / Latino 4%
- Common ancestry
- Slovak 1% German 1% Iranian 1%
- Foreign-born
- 2% · Canada
- Languages at home
- 96% English-only · Spanish 2% French/Haitian/Cajun 1% German/W. Germanic 1%
Political lean MEDSL · Clark
- 2024 margin
- Strong R (+29.5) · D 34.8% · R 64.3%
- 2008→2024 swing
- -27.0pp toward R · 2008: -2.5pp · 2024: -29.5pp
- All cycles
- 2024: R+29.5 2020: R+23.3 2016: R+19.5 2012: R+1.8 2008: R+2.5
Not yet ingested
- Civics
- —
Market trends
- HPI YoY
- ▼ -135.16%
- Current HPI
- 258.9037
- Rent YoY
- —
- Metro
- Springfield, OH
- State GDP YoY
- ▲ 1.98%
- F500 in state
- 48
Industry mix (Fortune 500 HQ in OH)
| Industry | F500 HQs | Revenue |
|---|---|---|
| Insurance | 3 | $145B |
|
||
| Industrial Machinery | 3 | $49B |
|
||
| Financial Services | 3 | $24B |
|
||
| Consumer Goods | 2 | $93B |
|
||
| Aerospace / Defense | 2 | $47B |
|
||
| Utilities | 2 | $33B |
|
||
Price history
+50.0% since first listed21 events — show timeline
- 2026-01-18 Listed $45,000 Dayton MLS
- 2025-12-31 Listing Removed — WRIST
- 2025-12-09 Price Changed $45,000 WRIST
- 2025-12-01 Listed $49,900 WRIST
- 2024-06-04 Listing Removed — Dayton MLS
- 2024-05-20 Pending — Dayton MLS
- 2024-04-26 Price Changed $45,000 Dayton MLS
- 2024-03-22 Listed $50,000 Dayton MLS
- 2023-02-16 Sold (Public Records) $28,000 Public Records
- 2023-02-10 Sold (MLS) $28,000 WRIST
- 2023-02-10 Sold (MLS) $28,000 Dayton MLS
- 2023-02-10 Sold (MLS) $28,000 Dayton MLS
- 2023-01-30 Pending — Dayton MLS
- 2023-01-30 Pending — WRIST
- 2023-01-24 Listed $37,500 WRIST
- 2023-01-24 Listed $37,500 Dayton MLS
- 2008-09-18 Sold (Public Records) $32,900 Public Records
- 2007-09-10 Sold (Public Records) $65,000 Public Records
- 2002-02-26 Sold (Public Records) $38,500 Public Records
- 1999-04-15 Sold (Public Records) $31,500 Public Records
- 1988-12-20 Sold (Public Records) $30,000 Public Records
Property tax history
+14.7%/yrLatest (2025): $1,467 · +69.3% YoY. Source: county tax records.
Cash-flow waterfall
monthlySold comps — $/sqft
last 12 mo · ≤1 miLoading sold comps…