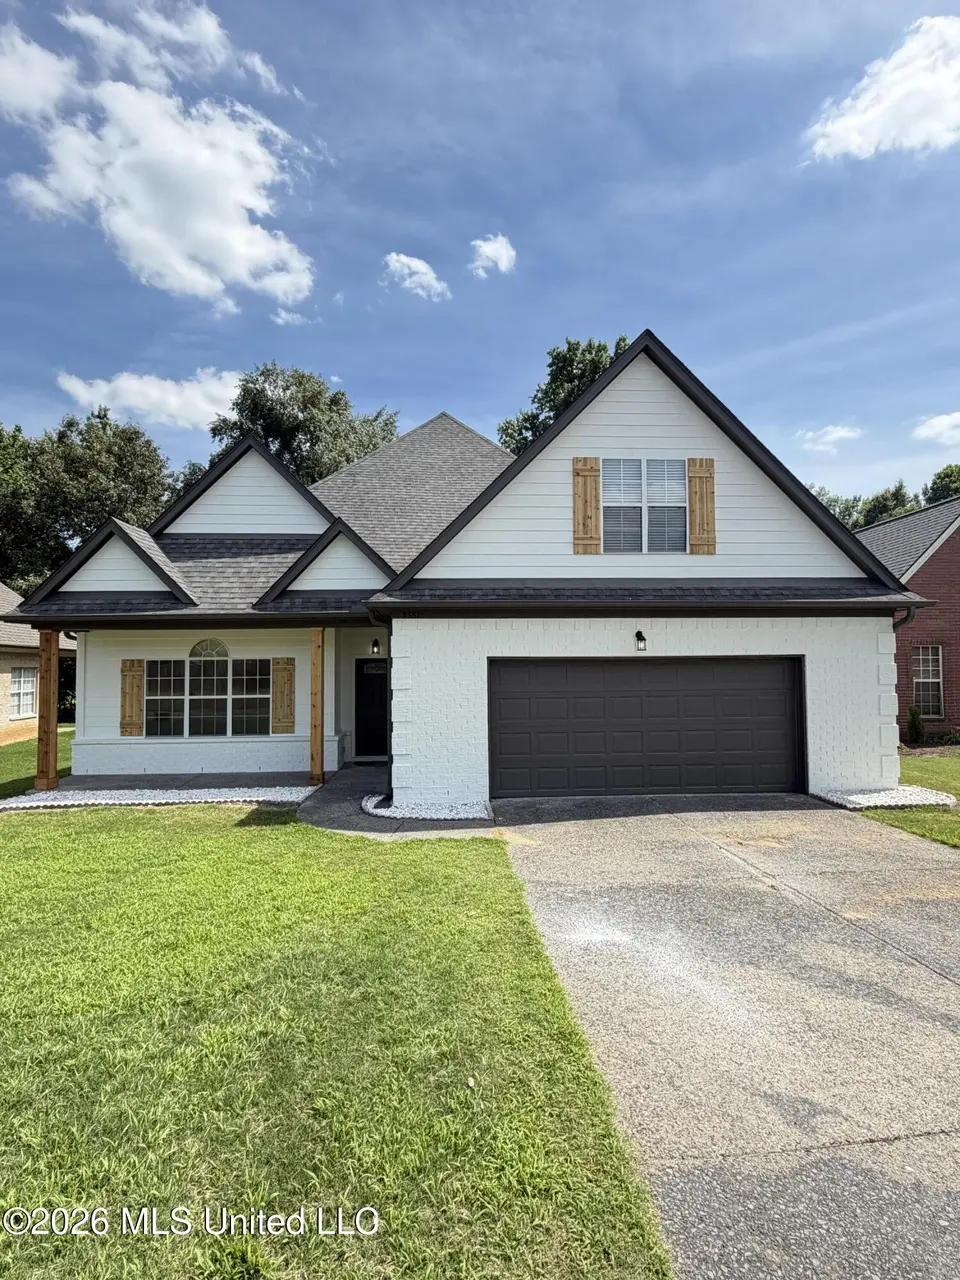
3381 Jacob Ln · Southaven, MS
Flood risk 1/10 · Minimal
- FEMA flood zone
- X (unshaded)
- Chance of flooding over 30 yrs
- 0.0%
- Est. flood insurance / yr
- $507 – $1,088
Fire risk 3/10 · Minor
- Est. fire insurance / yr
- $1,241 – $2,305
Heat risk 6/10 · Moderate
- Hot days now (above 110°F)
- 7 days/yr
- Hot days in 30 yrs
- 21 days/yr
Wind risk 4/10 · Minor
- Chance of severe wind over 30 yrs
- 20.0%
Air-quality risk 2/10 · Minimal
- Unhealthy air days now
- 2 days/yr
- Unhealthy air days in 30 yrs
- 2 days/yr
Risk factors via First Street. Map © Google.
Why this score? — see what drove the D grade
The composite is a weighted blend of 9 inputs, each scored 0–100. Each bar is that input's sub-score; the figure is the points it added to the 100-point composite (weight × sub-score).
- Cash flow +13.5/30.0
- ARV discount +8.7/15.0
- DSCR +4.1/10.0
- Schools +4.0/10.0
- Livability +3.2/5.0
- 1% rule +2.5/10.0
- Rent growth +2.5/5.0
- Condition / age +2.5/5.0
- Appreciation +0.0/10.0
$320,000
🖨 Deal sheet 📄 Offer letter ✓ Due diligence
Listing remarks MLS
This home is one you must look at from the inside out. The rooms are large and extremly well layed out. The porches have an upgraded stained wood plank ceiling(back porch measures 10'5"x23 and front porch is 20'4" x 5. Plus this home will have all the ugrades!! Also, there is lots of room for future expanding upstairs(over garage 20x16'8" and over greatroom 27x16) its already floored for storage.
Key facts
- Ample cabinet space
- 9,147 sq ft lot
- 2 garage spots
Tags
Property features AI
Finance
- HOA & community: Association with management services
Exterior
- Parking: 2-car garage
- Utilities: Public water; Public sewer; Electricity connected; Natural gas connected
- Home design: Single family residence — house; One level
- Construction: Brick construction; Architectural shingle roof; Slab foundation; Built (year source: Assessor)
- Exterior features: Private yard
Interior
- Kitchen: Dishwasher; Free-standing electric range; Microwave
- Bathrooms: 2 full bathrooms
- Heating & cooling: Central heating; Central air conditioning
- Interior features: Living room fireplace
Neighborhood map
What this means for you Summary
Snapshot
- This is a 3-bed/2.0-bath single-family listed at $320k.
Deal economics
- At list price, monthly cash flow is $13 ($156/yr) — positive.
- The deal already cash-flows at list — no discount required.
- To meet the 1% rule (rent ≥ 1% of price), the offer needs to be $239k (25.2% below list).
- Recommended offer: $239k (25.2% below list) — sets the bar for 1% rule.
- Cap rate 6.3% vs local median 5.2% in Southaven — meaningfully above typical; check what's discounted (condition, days-on-market, listing class) to confirm the premium yield is real.
Location & tenants
- Location reads 65/100 on livability (#107 in MS) — a middle-class / working-renter tenant base. Strengths: cost of living A+, housing A+; Watch: amenities F, commute F, health & safety F.
- Desoto County School District (suburban): math 48% / reading 42% proficiency, ranked #20 of 130 in MS (top 15%) — families likely to look elsewhere, expect single-tenant / working-renter base with shorter leases.
- Zoned schools: Desoto Central Primary (876 students, 100% FRL); Desoto Central Middle School (math 62% / reading 48%, grade B-, #15 of 179 statewide, top 8%, 1,468 students, 100% FRL); Desoto Central High School (math 36% / reading 52%, grade F, #40 of 197 statewide, top 20%, 1,995 students, 100% FRL) — zoned schools average 100% FRL vs 43% district-wide (56 pts higher); higher-poverty schools than district average — tighter screening recommended.
- Market conditions: 157 active listings in the ZIP; 16 comparable units currently listed for rent nearby; rentals at typical pace (median 17d on market — plan ~3-4 weeks tenant-placement turnaround); high-income renter base; 1,155 units permitted in DeSoto County in 2024 (0 in 5+ unit buildings).
Forward outlook
- Local home prices are declining (-3.0%/yr); year-one equity from $2k of loan paydown is wiped out by about $10k of value loss. Plan a longer hold.
- DeSoto County population projected at +33% by 2050 — long-run rental-demand tailwind backs the buy-and-hold thesis.
Negotiation context
- Only 12 days on market — expect competitive offers; lowballing is unlikely to land.
- 2 sale attempts since 24y ago with the ask held roughly flat each time — persistent listings suggest the price (not the market) is what's stuck; bring a comps-based counter.
Risks & watch-outs
- Climate carrying-cost: extreme-heat days projected 7→21/yr by 2055 (HVAC capex compounding) — expect insurance premiums to compound above CPI over the hold.
Questions for the listing agent
- Is there a deadline driving the sale (1031 exchange, divorce, estate, relocation)? That informs how much negotiation room exists.
- Schools are D-rated, which usually means shorter tenancies and higher turnover. Who's the typical renter profile here, and what's been the actual vacancy rate?
- The area grade is low — what's the realistic commute time and amenity access for the typical tenant pool here? Any planned neighborhood developments (good or bad) we should know about?
- What's the average days-on-market for RENTAL listings here right now (not sales)? A rising rental-DOM trend means longer vacancies and softer asking-rent achievability than the comps imply.
- What's the recent tenant-quality profile in this submarket — average credit score on applications, eviction rate, late-payment / NSF rate, and stable-employment percentage? A property-management company in the area should have these aggregated.
- How much new for-sale + rental construction is in the pipeline within 1–3 miles? Heavy new supply typically softens prices + rents 12–24 months out; constrained supply supports both.
Investment metrics
- 1% rule
- 0.75% ✗
- Cap rate
- 6.34%
- Cash-on-cash
- 0.17%
- DSCR
- 1.01
- GRM
- 11.1
CMA / ARV
- ARV (on-the-fly)
- $328,494
- Comps found
- 12
Show comp detail 12 sales within ~0.75 mi
| Address | Dist | Beds/Ba | Sqft | Sold | Price | $/sf | Match |
|---|---|---|---|---|---|---|---|
| 2978 Boffin Dr | 0.49mi | 3/2.0 | 2,070 (+0%) | 2mo | $309,900 | $150 | 75 |
| 4912 Jessica Dr | 0.40mi | 4/2.0 (+1) | 2,019 (-2%) | 2mo | $350,000 | $173 | 70 |
| 3167 Roseleigh Dr | 0.34mi | 3/2.0 | 1,884 (-9%) | 0mo | $325,000 | $173 | 69 |
| 4903 W Rosebrook Cir | 0.41mi | 4/3.0 (+1) | 2,000 (-3%) | 5mo | $331,900 | $166 | 62 |
| 4259 Markston Dr | 0.65mi | 3/2.0 | 1,976 (-4%) | 1mo | $299,900 | $152 | 62 |
| 4104 Bramble Crest Dr | 0.48mi | 3/2.0 | 1,882 (-9%) | 4mo | $299,000 | $159 | 60 |
| 3191 Rosebrook Cv | 0.37mi | 3/2.0 | 1,787 (-14%) | 2mo | $315,000 | $176 | 59 |
| 2973 Keeley Cv | 0.46mi | 4/2.0 (+1) | 2,195 (+6%) | 6mo | $350,000 | $159 | 59 |
| 4087 Jessica Dr | 0.52mi | 3/2.5 | 2,347 (+14%) | 0mo | $357,500 | $152 | 51 |
| 4416 Evelyn Ln | 0.71mi | 4/3.0 (+1) | 2,146 (+4%) | 2mo | $324,900 | $151 | 50 |
| 3098 Roseleigh Dr | 0.41mi | 4/3.0 (+1) | 2,299 (+11%) | 5mo | $344,900 | $150 | 49 |
| 5071 Maiden Ln | 0.50mi | 4/3.0 (+1) | 2,300 (+11%) | 6mo | $350,000 | $152 | 44 |
Match score weights: distance 35% · size 25% · config 20% · recency 20%. Top-matched comps best support the ARV.
Projected returns pro-forma
-3.0% appreciation · 3.0% rent growth · sell at horizon
- IRR
- -16.1%
- Equity multiple
- 0.43×
- Total profit
- $-51,193
- Equity at exit
- $47,713
- IRR
- -7.9%
- Equity multiple
- 0.51×
- Total profit
- $-44,195
- Equity at exit
- $27,668
Cash invested: $89,600 (down + closing). Projections, not guarantees.
Landlord ↔ Tenant lean methodology
- Overall (STATE)
- 90 Strongly Landlord-Friendly
- State Mississippi
- 90 Strongly Landlord-Friendly · R+11
- County
- — inherits STATE
- City
- — inherits STATE
ZIP-level market 38672
- Home prices YoY
- -13.1%
- Active inventory
- 157
- Price-to-rent
- 11.1×
Monthly cashflow live
- Estimated rent
- $2,395 high interval (Pro) →
- Mortgage (P&I)
- −$1,678
- Tax from tax record
- −$67 /mo · $807/yr
- Insurance
- −$133
- HOA
- −$0
- Vacancy / Maint / Mgmt
- −$503
- Net cashflow
- $13
Break-even live
UW: 25.0% down · 7.5% · 30yr · 1.5% tax · 5.0% vac · 8.0% maint · 8.0% mgmt
Financing live
Cash to close
- Down payment
- $80,000
- Closing costs
- $9,600
- Reserves months
- —
- Total cash needed
- —
Loan-product check · same deal, 3 products live
Conventional
25% down · 7.5% · 30yr
- Down + closing
- —
- Monthly P&I
- —
- Monthly cashflow
- —
- DSCR
- —
- Eligible?
- —
Personal DTI + credit; lowest rate.
DSCR
20% down · 8.5% · 30yr
- Down + closing
- —
- Monthly P&I
- —
- Monthly cashflow
- —
- DSCR
- —
- Eligible?
- —
No personal income docs; deal must DSCR.
Hard money
10% down · 12.0% · 12mo
- Down + closing
- —
- Monthly P&I
- —
- Monthly cashflow
- —
- DSCR
- —
- Eligible?
- —
Short-term bridge; refi at stabilization.
Rent comps 16 comps
| Address | Beds | Baths | Sqft | Rent | $/sqft | DOM | Units | Dist |
|---|---|---|---|---|---|---|---|---|
| 3450 Bop Blvd Southaven, MS | 3.0 | 2.0 | 1913 | $2,136 | $1.12 | 23d | 1 | 0.26mi |
| 3261 Vineyard Dr S Southaven, MS | 4.0 | 2.0 | 1817 | $2,495 | $1.37 | 43d | 1 | 0.34mi |
| 4919 Rosebrook Cir E Southaven, MS | 3.0 | 2.0 | 1683 | $2,200 | $1.31 | 43d | 1 | 0.39mi |
| 4508 Westminister Cir Southaven, MS | 4.0 | 3.0 | 2204 | $2,165 | $0.98 | 11d | 1 | 0.48mi |
| 2943 Dawkins Cv Southaven, MS | 4.0 | 2.0 | 1830 | $2,140 | $1.17 | 3d | 1 | 0.51mi |
| 3080 Greenhouse Dr Southaven, MS | 3.0 | 2.0 | 1767 | $2,100 | $1.19 | 43d | 1 | 0.52mi |
| 2928 Boffin Dr Southaven, MS | 4.0 | 2.0 | 1725 | $1,990 | $1.15 | 43d | 1 | 0.54mi |
| 2722 Nelle Ln Southaven, MS | 4.0 | 3.0 | 2364 | $2,320 | $0.98 | 2d | 1 | 0.67mi |
| 2674 Champion Hills Dr Southaven, MS | 4.0 | 2.5 | 2037 | $2,360 | $1.16 | 17d | 1 | 1.25mi |
| 2647 Champion Hills Dr Southaven, MS | 3.0 | 2.0 | 2002 | $3,270 | $1.63 | 19d | 1 | 1.30mi |
| 5683 Antler Trl Southaven, MS | 3.0 | 2.0 | 1794 | $2,015 | $1.12 | 4d | 1 | 1.38mi |
| 2777 Rutherford Dr Southaven, MS | 4.0 | 2.0 | 2320 | $2,200 | $0.95 | 4d | 1 | 1.42mi |
| 5678 Kuykendall Dr Southaven, MS | 4.0 | 2.0 | 2244 | $2,285 | $1.02 | 4d | 1 | 1.46mi |
| 2855 Nail Rd E Southaven, MS | 2.0 | 2.0 | 1740 | $3,345 | $1.92 | 43d | 1 | 1.46mi |
| 5764 Deer Ridge Dr Southaven, MS | 4.0 | 2.0 | 1665 | $2,060 | $1.24 | 2d | 1 | 1.49mi |
| 3596 Sabra Ln Southaven, MS | 3.0 | 2.5 | 1868 | $2,320 | $1.24 | 2d | 1 | 1.50mi |
Listing history 10 events
-
2026-06-18days on market $320,000 Active 12 DOM
-
2026-06-17days on market $320,000 Active 11 DOM
-
2026-06-16days on market $320,000 Active 10 DOM
-
2026-06-15days on market $320,000 Active 9 DOM
-
2026-06-13days on market $320,000 Active 7 DOM
-
2026-06-10days on market $320,000 Active 4 DOM
-
2026-06-09days on market $320,000 Active 3 DOM
-
2026-06-08days on market $320,000 Active 2 DOM
-
2026-06-07remarks 689-char remark
-
2026-06-07$320,000 Active 1 DOM
ⓘ Source: listings_history table (triggers on properties + properties_extension) + one-shot
backfill from property_details.listing_events for pre-trigger history.
Tax reassessment forecast MS · Resets to sale price
- Current annual tax
- $807 · $67/mo
- Projected year-2 tax
- $2,528 · $211/mo
- Expected delta
- +$1,721/yr (+$143/mo · 213.1%)
ⓘ Screening estimate from a state-policy table — verify with the county assessor before closing.
Climate risk First Street
- Flood 1/10 Low FEMA zone X (unshaded) · 0% chance over 30 yrs
- Wildfire 3/10 Moderate
- Heat 6/10 Major 7 d/yr ≥110°F today · 21 d/yr by 30 yrs out
- Wind 4/10 Moderate 20% chance of damaging wind over 30 yrs
- Air quality 2/10 Low 2 unhealthy d/yr today · 2 by 30 yrs out
Nearby sold comps map
Loading sold comps map…
Walkable amenities ~0.75 mi
Loading nearby amenities…
Taxation est. · year 1
- Rental income
- $28,735
- − Mortgage interest
- −$17,925
- − Property taxes
- −$807
- − Insurance
- −$1,600
- − Repairs & maintenance
- −$2,299
- − Management
- −$2,299
- − Depreciation
- −$9,309
- Taxable loss
- −$5,504
- Est. tax savings @ 24.0%
- +$1,321
- After-tax cash flow
- $1,477/yr
For passive investors: Depreciation is non-cash, so a rental often shows a tax loss while cash-flowing — sheltering income. Rental losses are passive: they offset passive income freely, and up to $25,000/yr can offset ordinary (W-2) income if you actively participate and your MAGI is under $100k (phasing out to $0 by $150k); unused losses carry forward. On sale, claimed depreciation is recaptured at up to 25%, and gains may owe capital-gains tax (a 1031 exchange can defer both). Figures are a year-1 estimate at your 24.0% rate — not tax advice; consult a CPA.
Schools (NCES district)
- District
- Desoto County School District
- NCES district ID
- 2801320
- Math proficiency
- 48% ▼ -13.00%
- Reading proficiency
- 42% ▼ -6.00%
- Median HH income
- $59,272
- Composite
- 39.56/100
- National rank
- #3933
- State rank
- #20 of 130 in MS
Livability — Southaven
- Score
- 65/100
- State rank
- #107
- US rank
- #12584
Category grades
Schools grade is shown separately in the Schools card above.
Census & demographics
- Census place
- Southaven, MS
- County
- DeSoto County · 176,513 people
- City population
- 53,755
- Metro
- Memphis, TN-MS-AR
- Population (ZIP)
- 16,436
- Household income
- $116,184
- Rent vs Own
- Severe rent burden
- 44.0
Population outlook (DeSoto County) Hauer SSP2
- Today (2025)
- 203,338 people
- By 2030
- 217,692 · +7.1%
- By 2040
- 245,320 · +20.6%
- By 2050
- 270,133 · +32.8%
- By 2075
- 323,341 · +59.0%
- By 2100
- 348,742 · +71.5%
Race, ethnicity, and origin ACS 2023
- Neighborhood character
- Majority White (60%)
- Race & ethnicity
- White 60% Black 31% Hispanic / Latino 5% Two or more races 4% Asian 3%
- Hispanic origin (detail)
- Mexican 3%
- Common ancestry
- Subsaharan African 2% Italian 2% Serbian 1%
- Foreign-born
- 5% · Canada, China
- Languages at home
- 96% English-only · Spanish 2% Chinese 1% Other Asian/Pacific 1%
Political lean MEDSL · DeSoto
- 2024 margin
- Strong R (+24.1) · D 36.7% · R 60.8% · Other 2.5%
- 2008→2024 swing
- +14.2pp toward D · 2008: -38.2pp · 2024: -24.1pp
- All cycles
- 2024: R+24.1 2020: R+23.9 2016: R+34.8 2012: R+33.5 2008: R+38.2
Not yet ingested
- Civics
- —
Market trends
- HPI YoY
- ▼ -25.90%
- Current HPI
- 172.4771
- Rent YoY
- —
- Metro
- Memphis, TN-MS-AR
- State GDP YoY
- —
- F500 in state
- 0
Price history
+85.0% since first listed5 events — show timeline
- 2026-06-06 Listed $320,000 MLSU
- 2026-03-13 Sold (Public Records) — Public Records
- 2003-06-03 Sold (Public Records) — Public Records
- 2003-06-02 Sold (MLS) — MLSU
- 2002-11-07 Listed $172,990 MLSU
Property tax history
-5.9%/yrLatest (2025): $807 · -16.3% YoY. Source: county tax records.
Cash-flow waterfall
monthlySold comps — $/sqft
last 12 mo · ≤1 miLoading sold comps…