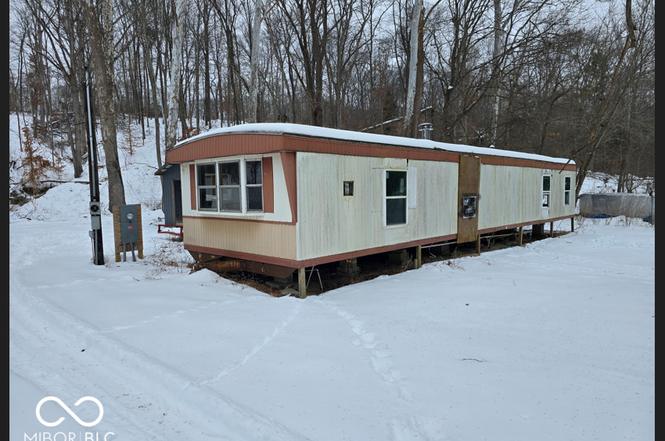
1318 State Road 135 S · Nashville, IN
Flood risk 8/10 · Major
- FEMA flood zone
- A
- Chance of flooding over 30 yrs
- 0.99%
- Est. flood insurance / yr
- $1,009 – $1,996
Fire risk 3/10 · Minor
- Est. fire insurance / yr
- $717 – $1,331
Heat risk 3/10 · Minor
- Hot days now (above 103°F)
- 7 days/yr
- Hot days in 30 yrs
- 19 days/yr
Wind risk 2/10 · Minimal
- Chance of severe wind over 30 yrs
- 1.0%
Air-quality risk 2/10 · Minimal
- Unhealthy air days now
- 1 days/yr
- Unhealthy air days in 30 yrs
- 1 days/yr
Risk factors via First Street. Map © Google.
Why this score? — see what drove the B grade
The composite is a weighted blend of 9 inputs, each scored 0–100. Each bar is that input's sub-score; the figure is the points it added to the 100-point composite (weight × sub-score).
- Cash flow +30.0/30.0
- 1% rule +10.0/10.0
- DSCR +10.0/10.0
- ARV discount +7.5/15.0
- Livability +4.0/5.0
- Schools +3.7/10.0
- Rent growth +2.5/5.0
- Condition / age +2.5/5.0
- Appreciation +0.0/10.0
$72,900
🖨 Deal sheet (PDF) 📄 Offer letter ✓ Due diligence
Listing remarks
This property sits on 1.5 acres, with a single wide trailer. Property is a fixer upper, being sold As Is. Clear title for trailer. Extended garage with storage included.
Key facts
- Storage included
- 1.5 acres
- Extended garage
Tags
Property features AI
Finance
- Other: Property on approximately 1.5 acres (1–3 acres); GPS-friendly directions
- HOA & community: Not low-maintenance lifestyle
Exterior
- Parking: One-car garage (approx. 450 sq ft); Gravel parking; Additional/other garage parking
- Utilities: Public water; Septic system; 200+ amp electric service; Cable available; Electricity connected; Solid waste service available; No on-site fuel source
- Home design: Single-family residence; One level; North-facing
- Construction: Aluminum siding exterior; Other type of foundation
- Exterior features: Covered patio/porch; Barn pole; Exterior storage; No fence
Interior
- Kitchen: No appliances included
- Bedrooms: Three bedrooms on the main level
- Bathrooms: One full bath and one half bath on the main level
- Heating & cooling: No heating; No cooling
- Interior features: Fixer condition; Has a view; Five main-level rooms
- Laundry & utility: Main-level laundry room
Neighborhood map
What this means for you Summary
Snapshot
- This is a 3-bed/1.5-bath single-family listed at $73k.
Deal economics
- At list price, monthly cash flow is $839 ($10k/yr) — positive.
- The deal already cash-flows at list — no discount required.
- Meets the 1% rule at list price ($2k rent vs $73k).
- Recommended offer: $64k (12.0% below list) — sets the bar for market timing.
- Cap rate 22.2% vs local median 2.9% in Nashville — top-decile yield for the area; either an underpriced asset or a hidden risk that comps aren't pricing in. Stress-test before assuming the spread holds.
Location & tenants
- Location reads 80/100 on livability (#20 in IN, #1,893 nationally) — a professional / high-income tenant draw. Strengths: crime A+, cost of living A+, housing A+; Watch: employment D+, amenities F, commute F.
- Brown County School Corporation (rural): math 37% / reading 48% proficiency, ranked #113 of 301 in IN (top 38%) — families likely to look elsewhere, expect single-tenant / working-renter base with shorter leases.
- Zoned schools: Van Buren Elementary School (math 47% / reading 47%, grade D-, #325 of 994 statewide, top 36%, 245 students, 43% FRL); Brown County High School (math 27% / reading 67%, grade D-, #143 of 369 statewide, top 44%, 509 students, 48% FRL) — zoned schools at 46% FRL track the district average.
- Market conditions: 90 active listings in the ZIP; 76 units permitted in Brown County in 2024 (0 in 5+ unit buildings).
Forward outlook
- Local home prices are declining (-3.0%/yr); year-one equity from $504 of loan paydown is wiped out by about $2k of value loss. Plan a longer hold.
- Brown County population projected at -12% by 2050 — secular population decline; favor cash flow + early exit over multi-decade hold.
- At projected returns (-3.0% appreciation + 3.0% rent growth), your $20k cash investment doubles in ~3 years — after that, you're playing with house money.
Negotiation context
- It's been on market 148 days — a 12% lower offer ($64k) is reasonable based on typical stale-listing flexibility.
- Current owner paid $32k; list at $73k implies a 128% gain — meaningful room to come down on a strong offer.
Risks & watch-outs
- Watch-outs: flood insurance adds $125/mo.
- Climate carrying-cost: in FEMA flood zone A (mandatory federal flood insurance) — expect insurance premiums to compound above CPI over the hold.
Questions for the listing agent
- It's been on market 148 days. Have you received any prior offers? Is the seller open to a 12% concession, seller financing, or rate buy-down credit?
- What's the actual annual flood-insurance premium (NFIP or private), and is the property in a SFHA with mandatory coverage?
- Why hasn't it sold? Are there any deal-killer items the seller is aware of (foundation, flood, title, zoning, code violations)?
- Is there a deadline driving the sale (1031 exchange, divorce, estate, relocation)? That informs how much negotiation room exists.
- What's the average days-on-market for RENTAL listings here right now (not sales)? A rising rental-DOM trend means longer vacancies and softer asking-rent achievability than the comps imply.
- What's the recent tenant-quality profile in this submarket — average credit score on applications, eviction rate, late-payment / NSF rate, and stable-employment percentage? A property-management company in the area should have these aggregated.
- How much new for-sale + rental construction is in the pipeline within 1–3 miles? Heavy new supply typically softens prices + rents 12–24 months out; constrained supply supports both.
Investment metrics
- 1% rule
- 2.45% ✓
- Cap rate
- 22.16%
- Cash-on-cash
- 56.68%
- DSCR
- 3.52
- GRM
- 3.4
CMA / ARV
No comps found within radius.
Projected returns pro-forma
-3.0% appreciation · 3.0% rent growth · sell at horizon
- IRR
- 47.0%
- Equity multiple
- 3.04×
- Total profit
- $41,684
- Equity at exit
- $10,870
- IRR
- 52.7%
- Equity multiple
- 6.16×
- Total profit
- $105,375
- Equity at exit
- $6,303
Cash invested: $20,412 (down + closing). Projections, not guarantees.
Landlord ↔ Tenant lean methodology
- Overall (STATE)
- 90 Strongly Landlord-Friendly
- State Indiana
- 90 Strongly Landlord-Friendly · R+11
- County
- — inherits STATE
- City
- — inherits STATE
ZIP-level market 47448
- Home prices YoY
- -25.5%
- Active inventory
- 90
- Price-to-rent
- 3.4×
Monthly cashflow live
- Estimated rent
- $1,786 medium interval (Pro) →
- Mortgage (P&I)
- −$382
- Tax from tax record
- −$34 /mo · $411/yr
- Insurance
- −$30
- Flood insurance flood zone
- −$125 /mo · $1,502/yr
- HOA
- −$0
- Vacancy / Maint / Mgmt
- −$375
- Net cashflow
- $839
Break-even live
Sensitivity live
| Price | -10% $880 | -5% $860 | +0% $839 | +5% $818 | +10% $798 |
|---|---|---|---|---|---|
| Rent | -10% $698 | -5% $768 | +0% $839 | +5% $909 | +10% $980 |
| Rate | -1.0pp $876 | -0.5pp $857 | base $839 | +0.5pp $820 | +1.0pp $801 |
UW: 25.0% down · 7.5% · 30yr · 1.5% tax · 5.0% vac · 8.0% maint · 8.0% mgmt
Financing live
Cash to close
- Down payment
- $18,225
- Closing costs
- $2,187
- Reserves months
- —
- Total cash needed
- —
Loan-product check · same deal, 3 products live
Conventional
25% down · 7.5% · 30yr
- Down + closing
- —
- Monthly P&I
- —
- Monthly cashflow
- —
- DSCR
- —
- Eligible?
- —
Personal DTI + credit; lowest rate.
DSCR
20% down · 8.5% · 30yr
- Down + closing
- —
- Monthly P&I
- —
- Monthly cashflow
- —
- DSCR
- —
- Eligible?
- —
No personal income docs; deal must DSCR.
Hard money
10% down · 12.0% · 12mo
- Down + closing
- —
- Monthly P&I
- —
- Monthly cashflow
- —
- DSCR
- —
- Eligible?
- —
Short-term bridge; refi at stabilization.
Listing history 20 events
-
2026-06-19days on market $72,900 Active 148 DOM
-
2026-06-18days on market $72,900 Active 147 DOM
-
2026-06-17days on market $72,900 Active 146 DOM
-
2026-06-16days on market $72,900 Active 145 DOM
-
2026-06-15days on market $72,900 Active 144 DOM
-
2026-06-14days on market $72,900 Active 142 DOM
-
2026-06-13days on market $72,900 Active 141 DOM
-
2026-06-10days on market $72,900 Active 139 DOM
-
2026-06-09days on market $72,900 Active 138 DOM
-
2026-06-08days on market $72,900 Active 137 DOM
-
2026-06-07days on market $72,900 Active 136 DOM
-
2026-06-05days on market $72,900 Active 133 DOM
-
2026-06-02days on market $72,900 Active 131 DOM
-
2026-06-01days on market $72,900 Active 130 DOM
-
2026-05-31days on market $72,900 Active 129 DOM
-
2026-05-30days on market $72,900 Active 128 DOM
-
2026-05-13price $72,900
-
2026-04-16price $79,500
-
2026-01-22$85,000 Active
-
2005-07-05soldstatus $32,000
ⓘ Source: listings_history table (triggers on properties + properties_extension) + one-shot
backfill from property_details.listing_events for pre-trigger history.
Tax reassessment forecast IN · Partial reset (capped growth)
- Current annual tax
- $411 · $34/mo
- Projected year-2 tax
- $515 · $43/mo
- Expected delta
- +$104/yr (+$9/mo · 25.4%)
ⓘ Screening estimate from a state-policy table — verify with the county assessor before closing.
Climate risk First Street
- Flood 8/10 Severe FEMA zone A · 99% chance over 30 yrs
- Wildfire 3/10 Moderate
- Heat 3/10 Moderate 7 d/yr ≥103°F today · 19 d/yr by 30 yrs out
- Wind 2/10 Low 100% chance of damaging wind over 30 yrs
- Air quality 2/10 Low 1 unhealthy d/yr today · 1 by 30 yrs out
Nearby sold comps map
Loading sold comps map…
Walkable amenities ~0.75 mi
Loading nearby amenities…
Taxation est. · year 1
- Rental income
- $21,433
- − Mortgage interest
- −$4,084
- − Property taxes
- −$411
- − Insurance
- −$1,867
- − Repairs & maintenance
- −$1,715
- − Management
- −$1,715
- − Depreciation
- −$2,121
- Taxable income
- $9,521
- Est. tax owed @ 24.0%
- −$2,285
- After-tax cash flow
- $7,781/yr
For passive investors: Depreciation is non-cash, so a rental often shows a tax loss while cash-flowing — sheltering income. Rental losses are passive: they offset passive income freely, and up to $25,000/yr can offset ordinary (W-2) income if you actively participate and your MAGI is under $100k (phasing out to $0 by $150k); unused losses carry forward. On sale, claimed depreciation is recaptured at up to 25%, and gains may owe capital-gains tax (a 1031 exchange can defer both). Figures are a year-1 estimate at your 24.0% rate — not tax advice; consult a CPA.
Schools (NCES district)
- District
- Brown County School Corporation
- NCES district ID
- 1800960
- Math proficiency
- 37% ▼ -15.00%
- Reading proficiency
- 48% ▼ -6.00%
- Median HH income
- $53,070
- Composite
- 36.82/100
- National rank
- #4563
- State rank
- #113 of 301 in IN
Livability — Nashville
- Score
- 80/100
- State rank
- #20
- US rank
- #1893
Category grades
Schools grade is shown separately in the Schools card above.
Census & demographics
- Population (ZIP)
- 7,719
Population outlook (Brown County) Hauer SSP2
- Today (2025)
- 14,677 people
- By 2030
- 14,458 · -1.5%
- By 2040
- 13,727 · -6.5%
- By 2050
- 12,841 · -12.5%
- By 2075
- 11,232 · -23.5%
- By 2100
- 9,129 · -37.8%
Race, ethnicity, and origin ACS 2023
- Neighborhood character
- Predominantly White (95%)
- Race & ethnicity
- White 95% Two or more races 2% Hispanic / Latino 1% Black 1%
- Common ancestry
- Lithuanian 3% Slovak 3% Romanian 2%
- Foreign-born
- 2% · Philippines
- Languages at home
- 98% English-only · Other Asian/Pacific 1% Spanish 1%
Political lean MEDSL · Brown
- 2024 margin
- Solid R (+32.6) · D 32.8% · R 65.5% · Other 1.7%
- 2008→2024 swing
- -30.1pp toward R · 2008: -2.5pp · 2024: -32.6pp
- All cycles
- 2024: R+32.6 2020: R+30.5 2016: R+31.6 2012: R+16.8 2008: R+2.5
Not yet ingested
- Civics
- —
Market trends
- HPI YoY
- ▼ -78.31%
- Current HPI
- 228.3895
- Rent YoY
- —
- Metro
- —
- State GDP YoY
- ▲ 2.90%
- F500 in state
- 18
Industry mix (Fortune 500 HQ in IN)
| Industry | F500 HQs | Revenue |
|---|---|---|
| Industrial Machinery | 2 | $37B |
|
||
| Healthcare | 1 | $177B |
|
||
| Pharmaceuticals | 1 | $45B |
|
||
| Metals / Steel | 1 | $18B |
|
||
| Agriculture | 1 | $17B |
|
||
| Packaging | 1 | $12B |
|
||
Price history
+127.8% since first listed4 events — show timeline
- 2026-05-13 Price Changed $72,900 MIBOR as Distributed by MLS Grid
- 2026-04-16 Price Changed $79,500 MIBOR as Distributed by MLS Grid
- 2026-01-22 Listed $85,000 MIBOR as Distributed by MLS Grid
- 2005-07-05 Sold (Public Records) $32,000 Public Records
Property tax history
+6.2%/yrLatest (2025): $411 · -1.0% YoY. Source: county tax records.
Cash-flow waterfall
monthlySold comps — $/sqft
last 12 mo · ≤1 miLoading sold comps…