 Fourplex
366 8TH St · Jersey City, NJ
Flood risk No data
- FEMA flood zone
- —
- Chance of flooding over 30 yrs
- —
- Est. flood insurance / yr
- —
Fire risk No data
- Est. fire insurance / yr
- —
Heat risk No data
- Hot days now (above threshold)
- —
- Hot days in 30 yrs
- —
Wind risk No data
- Chance of severe wind over 30 yrs
- —
Air-quality risk No data
- Unhealthy air days now
- —
- Unhealthy air days in 30 yrs
- —
Risk factors via First Street. Map © Google.
Why this score? — see what drove the C grade
The composite is a weighted blend of 9 inputs, each scored 0–100. Each bar is that input's sub-score; the figure is the points it added to the 100-point composite (weight × sub-score).
- Cash flow +23.9/30.0
- DSCR +7.7/10.0
- ARV discount +7.5/15.0
- 1% rule +6.2/10.0
- Livability +3.9/5.0
- Rent growth +3.4/5.0
- Schools +2.4/10.0
- Condition / age +1.0/5.0
- Appreciation +0.0/10.0
$1,899,000
🖨 Deal sheet 📄 Offer letter ✓ Due diligence
Multi-family units
County records classify this as Multi-Family (2-4 Unit). Listing-text estimate: 4 units. confirmed
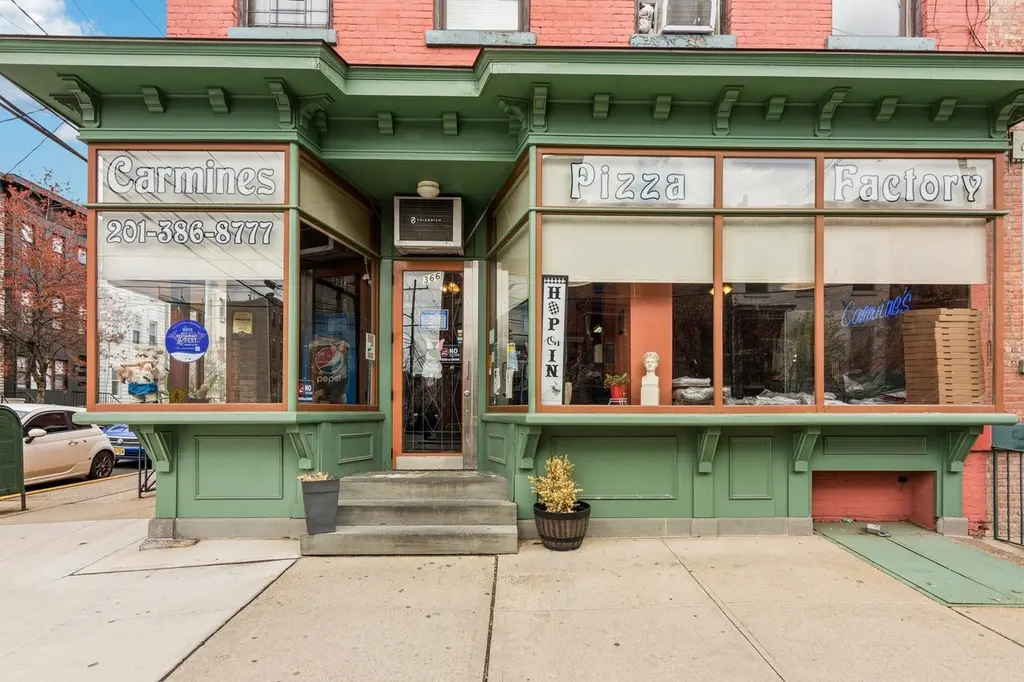
Listing remarks
Prime downtown JC location for a 4 family home with a commercial space on the ground floor. The property features 4/1 bedroom apartments, a 4 car garage and a commercial space on the ground floor. Each unit is beautifully laid out as a railroad style apartment and a well-known and established jersey city pizzeria is located at the street level of this property. This is a great opportunity to own a historic and income producing property in the heart of downtown Jersey City.
Key facts
- Historic property
- Commercial space
- Downtown jc location
Tags
Neighborhood map
What this means for you Summary
Snapshot
- This is a 4 × 4-bed/4.5-bath units multifamily listed at $1.90M. Condition is rated poor.
Deal economics
- At list price, monthly cash flow is $4k ($44k/yr) — positive. Per door: $924/mo.
- The deal already cash-flows at list — no discount required.
- Meets the 1% rule at list price ($21k rent vs $1.90M).
- Recommended offer: $1.84M (3.0% below list) — sets the bar for market timing.
- Cap rate 8.6% vs local median 1.8% in Jersey City — top-decile yield for the area; either an underpriced asset or a hidden risk that comps aren't pricing in. Stress-test before assuming the spread holds.
Location & tenants
- Location reads 77/100 on livability (#116 in NJ, #2,955 nationally) — a middle-class / working-renter tenant base. Strengths: amenities A+, commute A+, employment A+; Watch: crime F, cost of living F.
- Jersey City Public Schools (urban): math 16% / reading 38% proficiency, ranked #369 of 472 in NJ (top 78%) — low school quality limits family demand, transient renter base, plan for 1-2y turnover; 69% free/reduced lunch — lower-income household profile, screen leases tightly.
- Market conditions: Rents rising (+3.4%/yr); 383 active listings in the ZIP; high-income renter base; 5,310 units permitted in Hudson County in 2024 (4,154 in 5+ unit buildings).
- At $21,292/mo this rent would consume 146% of the median local household income ($175k/yr) (locally 2672% of renters already pay >50% of income on rent) — very limited rent-growth headroom before tenants either downsize or default.
Forward outlook
- Local home prices are declining (-3.0%/yr); year-one equity from $13k of loan paydown is wiped out by about $57k of value loss. Plan a longer hold.
- Hudson County population projected at +29% by 2050 — long-run rental-demand tailwind backs the buy-and-hold thesis.
Negotiation context
- It's been on market 34 days — a 3% lower offer ($1.84M) is reasonable based on typical stale-listing flexibility.
- 6 sale attempts with the ask held roughly flat each time — persistent listings suggest the price (not the market) is what's stuck; bring a comps-based counter.
Questions for the listing agent
- It's been on market 34 days. Have you received any prior offers? Is the seller open to a 3% concession, seller financing, or rate buy-down credit?
- Can we see the unit-by-unit rent roll, current vacancy, and any below-market leases? What's the average tenancy length?
- What capital expenditures (roof, boiler, parking lot, exteriors) have been made in the last 5 years, and what's planned in the next 2?
- Have any recent inspections been done? Can we get a copy of the seller's disclosures and any deferred-maintenance estimates?
- Is there a deadline driving the sale (1031 exchange, divorce, estate, relocation)? That informs how much negotiation room exists.
- Schools are B-rated — typically a magnet for longer-tenancy family renters. What's the average tenant stay here, and is there a school-zone premium baked into asking?
- Crime grade is F in this area — have there been break-ins, vandalism, or insurance claims at this property in the last 3 years? What carrier currently insures it and at what premium?
- What's the average days-on-market for RENTAL listings here right now (not sales)? A rising rental-DOM trend means longer vacancies and softer asking-rent achievability than the comps imply.
- What's the recent tenant-quality profile in this submarket — average credit score on applications, eviction rate, late-payment / NSF rate, and stable-employment percentage? A property-management company in the area should have these aggregated.
- How much new apartment / multifamily construction is in the pipeline within 1–3 miles? Heavy new supply (>2% of stock underway) typically softens rents 12–24 months out; light construction supports rent growth.
Investment metrics
- 1% rule
- 1.12% ✓
- Cap rate
- 8.63%
- Cash-on-cash
- 8.34%
- DSCR
- 1.37
- GRM
- 7.4
CMA / ARV
No comps found within radius.
Projected returns pro-forma
-3.0% appreciation · 3.42% rent growth · sell at horizon
- IRR
- -3.1%
- Equity multiple
- 0.88×
- Total profit
- $-62,892
- Equity at exit
- $283,147
- IRR
- 7.0%
- Equity multiple
- 1.54×
- Total profit
- $287,141
- Equity at exit
- $164,191
Cash invested: $531,720 (down + closing). Projections, not guarantees.
Landlord ↔ Tenant lean methodology
- Overall (CITY)
- 6 Strongly Tenant-Friendly
- State New Jersey
- 21 Tenant-Leaning · D+6
- County
- — inherits STATE
- City Jersey City
- 6 Strongly Tenant-Friendly · D+34
ZIP-level market 07302
- Home prices YoY
- -25.1%
- Rents YoY
- 3.4%
- Active inventory
- 383
- Price-to-rent
- 29.7×
Monthly cashflow live
- Estimated rent
- $21,292 high interval (Pro) →
- Mortgage (P&I)
- −$9,959
- Tax est. 1.5%
- −$2,374 /mo · $28,485/yr
- Insurance
- −$791
- HOA
- −$0
- Vacancy / Maint / Mgmt
- −$4,471
- Net cashflow
- $3,697
Break-even live
4-unit breakdown (identical units grouped — click to expand)
| Units | Beds | Baths | Est. rent |
|---|---|---|---|
| 4× units | 4 | 4.5 | $21,292 |
| #1 | 4 | 4.5 | $5,323 |
| #2 | 4 | 4.5 | $5,323 |
| #3 | 4 | 4.5 | $5,323 |
| #4 | 4 | 4.5 | $5,323 |
| Total (4 units) | $21,292 | ||
UW: 25.0% down · 7.5% · 30yr · 1.5% tax · 5.0% vac · 8.0% maint · 8.0% mgmt
Financing live
Cash to close
- Down payment
- $474,750
- Closing costs
- $56,970
- Reserves months
- —
- Total cash needed
- —
Loan-product check · same deal, 3 products live
Conventional
25% down · 7.5% · 30yr
- Down + closing
- —
- Monthly P&I
- —
- Monthly cashflow
- —
- DSCR
- —
- Eligible?
- —
Personal DTI + credit; lowest rate.
DSCR
20% down · 8.5% · 30yr
- Down + closing
- —
- Monthly P&I
- —
- Monthly cashflow
- —
- DSCR
- —
- Eligible?
- —
No personal income docs; deal must DSCR.
Hard money
10% down · 12.0% · 12mo
- Down + closing
- —
- Monthly P&I
- —
- Monthly cashflow
- —
- DSCR
- —
- Eligible?
- —
Short-term bridge; refi at stabilization.
Listing history 14 events
-
2026-04-27status Under Contract
-
2026-03-19historical
-
2026-01-20price $1,899,000
-
2026-01-04$1,990,000 Active
-
2025-12-22historical
-
2025-11-26status Back On Market
-
2025-10-31$1,995,000 Active
-
2025-10-28historical
-
2025-09-24historical
-
2025-06-23price $1,995,000
-
2025-06-23status Active
-
2025-06-13historical
-
2025-04-25$2,200,000 Active
-
2025-03-24$1,899,000 Active
ⓘ Source: listings_history table (triggers on properties + properties_extension) + one-shot
backfill from property_details.listing_events for pre-trigger history.
Nearby sold comps map
Loading sold comps map…
Walkable amenities ~0.75 mi
Loading nearby amenities…
Taxation est. · year 1
- Rental income
- $255,504
- − Mortgage interest
- −$106,374
- − Property taxes
- −$28,485
- − Insurance
- −$9,495
- − Repairs & maintenance
- −$20,440
- − Management
- −$20,440
- − Depreciation
- −$55,244
- Taxable income
- $15,026
- Est. tax owed @ 24.0%
- −$3,606
- After-tax cash flow
- $40,759/yr
For passive investors: Depreciation is non-cash, so a rental often shows a tax loss while cash-flowing — sheltering income. Rental losses are passive: they offset passive income freely, and up to $25,000/yr can offset ordinary (W-2) income if you actively participate and your MAGI is under $100k (phasing out to $0 by $150k); unused losses carry forward. On sale, claimed depreciation is recaptured at up to 25%, and gains may owe capital-gains tax (a 1031 exchange can defer both). Figures are a year-1 estimate at your 24.0% rate — not tax advice; consult a CPA.
Condition & rehab AI · 1 photo
This 4-unit multi-family property in Jersey City, NJ, requires extensive repairs and updates to its roof, exterior, landscaping, and interior. The property's poor condition and lack of maintenance make it a significant investment opportunity for an investor looking to renovate and increase its value.
Repairs flagged
- Major roof — The roof appears to be old and possibly leaking.
- Major exterior siding — The exterior siding is in poor condition, with visible wear and tear.
- Major exterior paint — The exterior paint is peeling and in poor condition.
- Major landscaping — The landscaping is overgrown and in poor condition, with no visible curb appeal or maintenance.
- Major interior walls/paint — The condition of the exterior suggests the interior may also be in poor condition, with no visible walls or paint in the photos.
- Major systems — The condition of the exterior suggests the interior may also be in poor condition, with no visible systems in the photos.
- Major flooring — The condition of the exterior suggests the interior may also be in poor condition, with no visible flooring in the photos.
Value-add opportunities
- Both roof replacement — Replacing the roof would improve the overall condition of the property and make it more attractive to potential buyers or renters.
- Both exterior siding and paint — Updating the exterior siding and paint would improve the curb appeal and make the property more attractive to potential buyers or renters.
- Both landscaping — Maintaining the landscaping would improve the curb appeal and make the property more attractive to potential buyers or renters.
- Both interior repairs and updates — Updating the interior walls, paint, and flooring would improve the overall condition of the property and make it more attractive to potential buyers or renters.
- Both systems upgrades — Upgrading the systems would improve the overall condition of the property and make it more attractive to potential buyers or renters.
- Both commercial space improvements — Improving the commercial space on the ground floor would increase the property's rental income and make it more attractive to potential buyers or renters.
Renovation cost estimate screening
| Repair item | Severity | Est. cost |
|---|---|---|
| roof · The roof appears to be old and possibly leaking. | Major | $15,000–50,000 |
| exterior siding · The exterior siding is in poor condition, with visible wear and tear. | Major | $15,000–50,000 |
| exterior paint · The exterior paint is peeling and in poor condition. | Major | $15,000–50,000 |
| landscaping · The landscaping is overgrown and in poor condition, with no visible curb appeal or maintenance. | Major | $15,000–50,000 |
| interior walls/paint · The condition of the exterior suggests the interior may also be in poor condition, with no visible walls or paint in the photos. | Major | $15,000–50,000 |
| systems · The condition of the exterior suggests the interior may also be in poor condition, with no visible systems in the photos. | Major | $15,000–50,000 |
| flooring · The condition of the exterior suggests the interior may also be in poor condition, with no visible flooring in the photos. | Major | $15,000–50,000 |
| Total estimated repair cost · 7 items | $105,000–350,000 |
Value-add ROI direction
- Both roof replacement — Replacing the roof would improve the overall condition of the property and make it more attractive to potential buyers or renters. ↑
- Both exterior siding and paint — Updating the exterior siding and paint would improve the curb appeal and make the property more attractive to potential buyers or renters. ↑
- Both landscaping — Maintaining the landscaping would improve the curb appeal and make the property more attractive to potential buyers or renters. ↑
- Both interior repairs and updates — Updating the interior walls, paint, and flooring would improve the overall condition of the property and make it more attractive to potential buyers or renters. ↑
- Both systems upgrades — Upgrading the systems would improve the overall condition of the property and make it more attractive to potential buyers or renters. ↑
- Both commercial space improvements — Improving the commercial space on the ground floor would increase the property's rental income and make it more attractive to potential buyers or renters. ↑
ⓘ Cost ranges are severity-bucket heuristics (US national rule-of-thumb). Get contractor quotes + a written scope before underwriting a rehab budget.
Schools (NCES district)
- District
- Jersey City Public Schools
- NCES district ID
- 3407830
- Math proficiency
- 16% ▼ -17.00%
- Reading proficiency
- 38% ▼ -11.00%
- Median HH income
- $58,431
- Composite
- 24.43/100
- National rank
- #7678
- State rank
- #369 of 472 in NJ
Livability — Jersey City
- Score
- 77/100
- State rank
- #116
- US rank
- #2955
Category grades
Schools grade is shown separately in the Schools card above.
Census & demographics
- Census place
- Jersey City, NJ
- County
- Hudson County · 718,323 people
- City population
- 294,078
- Metro
- New York-Newark-Jersey City, NY-NJ-PA
- Population (ZIP)
- 56,220
- Household income
- $175,077
- Rent vs Own
- Severe rent burden
- 2672.0
Population outlook (Hudson County) Hauer SSP2
- Today (2025)
- 771,834 people
- By 2030
- 818,028 · +6.0%
- By 2040
- 907,866 · +17.6%
- By 2050
- 994,480 · +28.8%
- By 2075
- 1,163,301 · +50.7%
- By 2100
- 1,254,703 · +62.6%
Race, ethnicity, and origin ACS 2023
- Neighborhood character
- Highly diverse neighborhood (Simpson 0.70)
- Race & ethnicity
- White 39% Asian 34% Hispanic / Latino 15% Two or more races 11% Black 7%
- Hispanic origin (detail)
- Mexican 1% Puerto Rican 5% Dominican 2%
- Common ancestry
- Romanian 4% Scotch-Irish 2% Lithuanian 2%
- Foreign-born
- 40% · China, Canada, South Korea
- Languages at home
- 55% English-only · Other Indo-European 14% Spanish 10% Chinese 9%
Political lean MEDSL · Hudson
- 2024 margin
- Strong D (+28.1) · D 62.6% · R 34.6% · Other 2.8%
- 2008→2024 swing
- -18.7pp toward R · 2008: 46.7pp · 2024: 28.1pp
- All cycles
- 2024: D+28.1 2020: D+46.2 2016: D+51.8 2012: D+55.7 2008: D+46.7
Not yet ingested
- Civics
- —
Market trends
- HPI YoY
- ▼ -160.49%
- Current HPI
- 479.7768
- Rent YoY
- ▲ 3.42%
- Metro
- New York-Newark-Jersey City, NY-NJ-PA
- State GDP YoY
- ▲ 2.05%
- F500 in state
- 34
Industry mix (Fortune 500 HQ in NJ)
| Industry | F500 HQs | Revenue |
|---|---|---|
| Consumer Goods | 3 | $31B |
|
||
| Pharmaceuticals | 2 | $153B |
|
||
| Technology | 2 | $21B |
|
||
| Insurance | 2 | $20B |
|
||
| Healthcare | 2 | $19B |
|
||
| Financial Services | 1 | $70B |
|
||
Price history
+0.0% since first listed14 events — show timeline
- 2026-04-27 Pending — HCMLS
- 2026-03-19 Listing Removed — HCMLS
- 2026-01-20 Price Changed $1,899,000 HCMLS
- 2026-01-04 Listed $1,990,000 HCMLS
- 2025-12-22 Listing Removed — HCMLS
- 2025-11-26 Relisted — HCMLS
- 2025-10-31 Listed $1,995,000 HCMLS
- 2025-10-28 Listing Removed — HCMLS
- 2025-09-24 Listing Removed — HCMLS
- 2025-06-23 Price Changed $1,995,000 HCMLS
- 2025-06-23 Relisted — HCMLS
- 2025-06-13 Listing Removed — HCMLS
- 2025-04-25 Listed $2,200,000 HCMLS
- 2025-03-24 Listed $1,899,000 HCMLS
Cash-flow waterfall
monthlySold comps — $/sqft
last 12 mo · ≤1 miLoading sold comps…