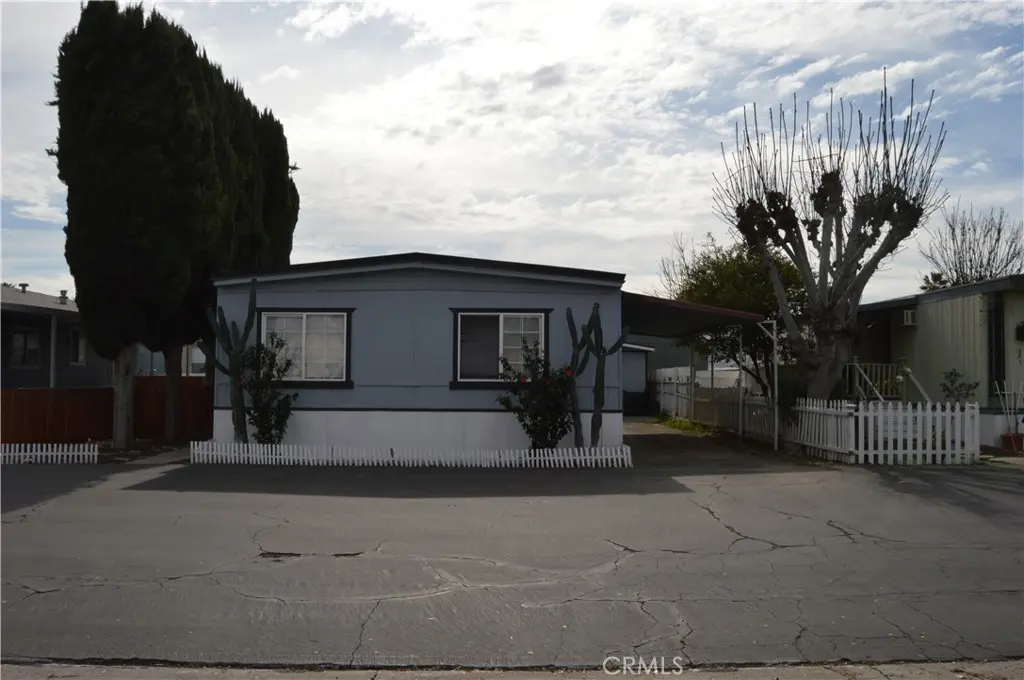
15050 Monte Vista Ave #126 · Chino Hills, CA
Flood risk 1/10 · Minimal
- FEMA flood zone
- X (unshaded)
- Chance of flooding over 30 yrs
- 0.0%
- Est. flood insurance / yr
- $507 – $1,088
Fire risk 6/10 · Moderate
- Est. fire insurance / yr
- $659 – $1,223
Heat risk 7/10 · Major
- Hot days now (above 100°F)
- 6 days/yr
- Hot days in 30 yrs
- 18 days/yr
Wind risk 1/10 · Minimal
- Chance of severe wind over 30 yrs
- —
Air-quality risk 7/10 · Major
- Unhealthy air days now
- 15 days/yr
- Unhealthy air days in 30 yrs
- 17 days/yr
Risk factors via First Street. Map © Google.
Why this score? — see what drove the B+ grade
The composite is a weighted blend of 9 inputs, each scored 0–100. Each bar is that input's sub-score; the figure is the points it added to the 100-point composite (weight × sub-score).
- Cash flow +30.0/30.0
- ARV discount +15.0/15.0
- 1% rule +10.0/10.0
- DSCR +10.0/10.0
- Schools +5.0/10.0
- Livability +3.4/5.0
- Rent growth +2.6/5.0
- Condition / age +2.5/5.0
- Appreciation +0.0/10.0
$125,000
🖨 Deal sheet 📄 Offer letter ✓ Due diligence
Listing remarks MLS
Here is an amazing opportunity in all-age community park! this manufactured home offers an open floor plan with 4 bedrooms, 2 bathrooms, and spacious yard, 2 cars or 3 small cars carport. The park offers Off-Street Parking, playground, Swimming Pool, basketball court, clubhouse, recreational facilities, for your convenience the manufactured home is across from the pool and the park office.
Key facts
- Spacious yard
- Open floor plan
- Clubhouse
Tags
Neighborhood map
What this means for you Summary
Snapshot
- This is a 3-bed/2.0-bath manufactured listed at $125k.
Deal economics
- At list price, monthly cash flow is $2k ($23k/yr) — positive.
- The deal already cash-flows at list — no discount required.
- Meets the 1% rule at list price ($4k rent vs $125k).
- Recommended offer: $110k (12.0% below list) — sets the bar for market timing.
- Cap rate 25.0% vs local median 2.1% in Chino Hills — top-decile yield for the area; either an underpriced asset or a hidden risk that comps aren't pricing in. Stress-test before assuming the spread holds.
Location & tenants
- Location reads 68/100 on livability (#299 in CA) — a middle-class / working-renter tenant base. Strengths: employment A+, schools A, crime A; Watch: health & safety D, commute F, cost of living F.
- Chino Valley Unified (suburban): math 46% / reading 58% proficiency, ranked #334 of 1,400 in CA (top 24%) — acceptable for families but not a draw, mixed tenant base, ~2y average lease.
- Market conditions: Rents flat; 187 active listings in the ZIP; 16 comparable units currently listed for rent nearby; rentals at typical pace (median 17d on market — plan ~3-4 weeks tenant-placement turnaround); high-income renter base; 5,458 units permitted in San Bernardino County in 2024 (1,500 in 5+ unit buildings).
- This rent runs 34% of the median local income ($126k/yr) — at the standard rent-burdened threshold; future hikes will face affordability resistance.
Forward outlook
- Local home prices are declining (-3.0%/yr); year-one equity from $864 of loan paydown is wiped out by about $4k of value loss. Plan a longer hold.
- San Bernardino County population projected at +15% by 2050 — modest demand growth; plan on rents tracking national, not racing it.
- At projected returns (-3.0% appreciation + 0.2% rent growth), your $35k cash investment doubles in ~2 years — after that, you're playing with house money.
Negotiation context
- It's been on market 132 days — a 12% lower offer ($110k) is reasonable based on typical stale-listing flexibility.
- 8 sale attempts since 21y ago; this cycle's ask has dropped $35k (22%) from the opening price — seller is motivated, your offer sets the floor, not the list.
- Current owner paid $65k; list at $125k implies a 92% gain — meaningful room to come down on a strong offer.
Risks & watch-outs
- Climate carrying-cost: major wildfire risk; extreme-heat days projected 6→18/yr by 2055 (HVAC capex compounding) — expect insurance premiums to compound above CPI over the hold.
Questions for the listing agent
- It's been on market 132 days. Have you received any prior offers? Is the seller open to a 12% concession, seller financing, or rate buy-down credit?
- Built in 1973 — when were the roof, HVAC, electrical panel, plumbing, and water heater last replaced?
- Why hasn't it sold? Are there any deal-killer items the seller is aware of (foundation, flood, title, zoning, code violations)?
- Is there a deadline driving the sale (1031 exchange, divorce, estate, relocation)? That informs how much negotiation room exists.
- Schools are A-rated — typically a magnet for longer-tenancy family renters. What's the average tenant stay here, and is there a school-zone premium baked into asking?
- What's the average days-on-market for RENTAL listings here right now (not sales)? A rising rental-DOM trend means longer vacancies and softer asking-rent achievability than the comps imply.
- What's the recent tenant-quality profile in this submarket — average credit score on applications, eviction rate, late-payment / NSF rate, and stable-employment percentage? A property-management company in the area should have these aggregated.
- How much new for-sale + rental construction is in the pipeline within 1–3 miles? Heavy new supply typically softens prices + rents 12–24 months out; constrained supply supports both.
Investment metrics
- 1% rule
- 2.84% ✓
- Cap rate
- 24.96%
- Cash-on-cash
- 66.66%
- DSCR
- 3.97
- GRM
- 2.9
CMA / ARV
- ARV (median comp)
- $217,485
- List price
- $125,000
- Delta
- -42.52%
- Verdict
- UNDERPRICED
- Comps
- 18 within 1.0 mi
Show comp detail 12 sales within ~0.75 mi
| Address | Dist | Beds/Ba | Sqft | Sold | Price | $/sf | Match |
|---|---|---|---|---|---|---|---|
| 15050 Monte Vista Ave #144 | 0.06mi | 3/2.0 | 1,440 (0%) | 10mo | $221,500 | $154 | 89 |
| 15050 Monte Vista Ave #101 | 0.00mi | 4/2.0 (+1) | 1,392 (-3%) | 6mo | $173,500 | $125 | 84 |
| 15050 Monte Vista Ave #125 | 0.12mi | 3/2.0 | 1,440 (0%) | 16mo | $139,900 | $97 | 81 |
| 15050 Monte Vista Ave #26 | 0.06mi | 4/2.0 (+1) | 1,482 (+3%) | 9mo | $245,000 | $165 | 80 |
| 15050 Monte Vista Ave #32 | 0.06mi | 3/2.0 | 1,344 (-7%) | 13mo | $191,500 | $142 | 75 |
| 15050 Monte Vista Ave #44 | 0.06mi | 3/2.0 | 1,260 (-12%) | 6mo | $199,000 | $158 | 71 |
| 15050 Monte Vista Ave #188 | 0.06mi | 4/2.0 (+1) | 1,344 (-7%) | 14mo | $242,000 | $180 | 69 |
| 15050 Monte Vista Ave #224 | 0.06mi | 4/2.0 (+1) | 1,320 (-8%) | 12mo | $153,000 | $116 | 68 |
| 15050 Monte Vista Ave #197 | 0.06mi | 3/2.0 | 1,272 (-12%) | 13mo | $180,000 | $142 | 67 |
| 15050 Monte Vista Ave #21 | 0.06mi | 3/2.0 | 1,248 (-13%) | 12mo | $210,000 | $168 | 65 |
| 15050 Monte Vista Ave #185 | 0.06mi | 3/2.0 | 1,232 (-14%) | 16mo | $173,500 | $141 | 59 |
| 15111 Pipeline Ave #24 | 0.69mi | 2/2.0 (-1) | 1,440 (0%) | 9mo | $110,000 | $76 | 55 |
Match score weights: distance 35% · size 25% · config 20% · recency 20%. Top-matched comps best support the ARV.
Projected returns pro-forma
-3.0% appreciation · 0.2% rent growth · sell at horizon
- IRR
- 62.7%
- Equity multiple
- 3.68×
- Total profit
- $93,881
- Equity at exit
- $18,638
- IRR
- 66.3%
- Equity multiple
- 6.82×
- Total profit
- $203,615
- Equity at exit
- $10,808
Cash invested: $35,000 (down + closing). Projections, not guarantees.
Landlord ↔ Tenant lean methodology
- Overall (STATE)
- 18 Strongly Tenant-Friendly
- State California
- 18 Strongly Tenant-Friendly · D+13
- County
- — inherits STATE
- City
- — inherits STATE
ZIP-level market 91709
- Home prices YoY
- -28.5%
- Rents YoY
- 0.2%
- Active inventory
- 187
- Price-to-rent
- 2.9×
Monthly cashflow live
- Estimated rent
- $3,554 high interval (Pro) →
- Mortgage (P&I)
- −$656
- Tax est. 1.5%
- −$156 /mo · $1,875/yr
- Insurance
- −$52
- HOA
- −$0
- Vacancy / Maint / Mgmt
- −$746
- Net cashflow
- $1,944
Break-even live
Sensitivity live
| Price | -10% $2,031 | -5% $1,987 | +0% $1,944 | +5% $1,901 | +10% $1,858 |
|---|---|---|---|---|---|
| Rent | -10% $1,663 | -5% $1,804 | +0% $1,944 | +5% $2,085 | +10% $2,225 |
| Rate | -1.0pp $2,007 | -0.5pp $1,976 | base $1,944 | +0.5pp $1,912 | +1.0pp $1,879 |
UW: 25.0% down · 7.5% · 30yr · 1.5% tax · 5.0% vac · 8.0% maint · 8.0% mgmt
Financing live
Cash to close
- Down payment
- $31,250
- Closing costs
- $3,750
- Reserves months
- —
- Total cash needed
- —
Loan-product check · same deal, 3 products live
Conventional
25% down · 7.5% · 30yr
- Down + closing
- —
- Monthly P&I
- —
- Monthly cashflow
- —
- DSCR
- —
- Eligible?
- —
Personal DTI + credit; lowest rate.
DSCR
20% down · 8.5% · 30yr
- Down + closing
- —
- Monthly P&I
- —
- Monthly cashflow
- —
- DSCR
- —
- Eligible?
- —
No personal income docs; deal must DSCR.
Hard money
10% down · 12.0% · 12mo
- Down + closing
- —
- Monthly P&I
- —
- Monthly cashflow
- —
- DSCR
- —
- Eligible?
- —
Short-term bridge; refi at stabilization.
Rent comps 16 comps
| Address | Beds | Baths | Sqft | Rent | $/sqft | DOM | Units | Dist |
|---|---|---|---|---|---|---|---|---|
| 15101 Fairfield Ranch Rd Chino Hills, CA | 1.0–3.0 | 1.0–2.0 | 1053 | $3,600 | $3.42 | 2d | 19 | 0.22mi |
| 4628 Bird Farm Rd Chino Hills, CA | 3.0 | 2.0 | 1152 | $3,250 | $2.82 | 44d | 1 | 0.30mi |
| 15345 Murray Ave Chino Hills, CA | 3.0 | 2.0 | 1527 | $3,395 | $2.22 | 3d | 1 | 0.32mi |
| 15447 Pomona Rincon Rd Chino Hills, CA | 3.0 | 2.5 | 1397 | $3,350 | $2.40 | 15d | 2 | 0.42mi |
| 4432 Lilac Cir Chino Hills, CA | 3.0 | 3.5 | 1695 | $3,200 | $1.89 | 5d | 1 | 0.55mi |
| 4361 Los Serranos Blvd Chino Hills, CA | 3.0 | 2.0 | 1256 | $3,200 | $2.55 | 17d | 1 | 0.70mi |
| 15040 Beechwood Ln Chino Hills, CA | 4.0 | 2.0 | 1640 | $3,600 | $2.20 | 44d | 1 | 0.97mi |
| 4186 Val Verde Ave Chino Hills, CA | 2.0 | 2.0 | 1000 | $8,000 | $8.00 | 44d | 1 | 1.03mi |
| 15886 Ellington Way Chino Hills, CA | 4.0 | 3.0 | 1848 | $3,300 | $1.79 | 17d | 1 | 1.05mi |
| 15031 Ashwood Ln Chino Hills, CA | 4.0 | 2.0 | 1800 | $3,500 | $1.94 | 44d | 1 | 1.09mi |
| 15996 Mihaylo Ct Chino Hills, CA | 3.0 | 2.5 | 1541 | $3,850 | $2.50 | 44d | 1 | 1.18mi |
| 15920 Pomona Rincon Rd Chino Hills, CA | 1.0–3.0 | 1.5–3.5 | 1376 | $3,999 | $2.91 | 1d | 10 | 1.23mi |
| 16143 Talbot Ct Chino Hills, CA | 3.0 | 2.5 | 1548 | $3,495 | $2.26 | 15d | 1 | 1.31mi |
| 15924 Windswept Rd Chino Hills, CA | 4.0 | 2.5 | 1848 | $3,300 | $1.79 | 2d | 1 | 1.37mi |
| 3724 Alder Pl Chino Hills, CA | 3.0 | 2.0 | 1240 | $3,600 | $2.90 | 22d | 1 | 1.42mi |
| 5560 Barclay Ct Chino Hills, CA | 3.0 | 3.0 | 1597 | $3,500 | $2.19 | 44d | 1 | 1.47mi |
Listing history 38 events
-
2026-06-18days on market $125,000 Active 132 DOM
-
2026-06-17days on market $125,000 Active 131 DOM
-
2026-06-16days on market $125,000 Active 130 DOM
-
2026-06-15days on market $125,000 Active 129 DOM
-
2026-06-13days on market $125,000 Active 127 DOM
-
2026-06-09days on market $125,000 Active 123 DOM
-
2026-06-08days on market $125,000 Active 122 DOM
-
2026-06-07days on market $125,000 Active 121 DOM
-
2026-06-04days on market $125,000 Active 118 DOM
-
2026-06-03days on market $125,000 Active 117 DOM
-
2026-06-02days on market $125,000 Active 116 DOM
-
2026-06-01days on market $125,000 Active 115 DOM
-
2026-05-31days on market $125,000 Active 114 DOM
-
2026-02-06$159,999 Active 392-char remark
Show marketing remark (392 chars)
Here is an amazing opportunity in all-age community park! this manufactured home offers an open floor plan with 4 bedrooms, 2 bathrooms, and spacious yard, 2 cars or 3 small cars carport. The park offers Off-Street Parking, playground, Swimming Pool, basketball court, clubhouse, recreational facilities, for your convenience the manufactured home is across from the pool and the park office.
-
2026-01-01historical
-
2025-08-14price $164,000
-
2025-07-25price $164,900
-
2025-06-22price $164,990
-
2025-06-13price $164,999
-
2025-05-25price $174,000
-
2025-05-19price $174,900
-
2025-05-01price $174,990
-
2025-04-19price $174,999
-
2025-03-27$199,999 Active
-
2025-03-21historical
-
2025-01-06historical
-
2024-08-06$220,000 Active
-
2024-05-14$250,000 Active
-
2020-04-20historical Hold Do Not Show
-
2019-12-12$70,000 Active
-
2019-08-31historical
-
2019-07-23price $70,000
-
2019-05-03price $75,000
-
2019-02-27$78,000 Active
-
2013-12-19historical
-
2013-06-19$50,000 Active
-
2005-11-29soldstatus $65,000
-
2005-08-26$89,000
ⓘ Source: listings_history table (triggers on properties + properties_extension) + one-shot
backfill from property_details.listing_events for pre-trigger history.
Climate risk First Street
- Flood 1/10 Low FEMA zone X (unshaded) · 0% chance over 30 yrs
- Wildfire 6/10 Major
- Heat 7/10 Severe 6 d/yr ≥100°F today · 18 d/yr by 30 yrs out
- Wind 1/10 Low
- Air quality 7/10 Severe 15 unhealthy d/yr today · 17 by 30 yrs out
Nearby sold comps map
Loading sold comps map…
Walkable amenities ~0.75 mi
Loading nearby amenities…
Taxation est. · year 1
- Rental income
- $42,653
- − Mortgage interest
- −$7,002
- − Property taxes
- −$1,875
- − Insurance
- −$625
- − Repairs & maintenance
- −$3,412
- − Management
- −$3,412
- − Depreciation
- −$3,636
- Taxable income
- $22,690
- Est. tax owed @ 24.0%
- −$5,446
- After-tax cash flow
- $17,884/yr
For passive investors: Depreciation is non-cash, so a rental often shows a tax loss while cash-flowing — sheltering income. Rental losses are passive: they offset passive income freely, and up to $25,000/yr can offset ordinary (W-2) income if you actively participate and your MAGI is under $100k (phasing out to $0 by $150k); unused losses carry forward. On sale, claimed depreciation is recaptured at up to 25%, and gains may owe capital-gains tax (a 1031 exchange can defer both). Figures are a year-1 estimate at your 24.0% rate — not tax advice; consult a CPA.
Schools (NCES district)
- District
- Chino Valley Unified
- NCES district ID
- 0608460
- Math proficiency
- 46% ▲ 1.00%
- Reading proficiency
- 58% ▲ 1.00%
- Median HH income
- $83,575
- Composite
- 49.56/100
- National rank
- #4275
- State rank
- #334 of 1400 in CA
Livability — Chino Hills
- Score
- 68/100
- State rank
- #299
- US rank
- #9993
Category grades
Schools grade is shown separately in the Schools card above.
Census & demographics
- Census place
- Chino Hills, CA
- County
- San Bernardino County · 2,030,291 people
- City population
- 78,006
- Metro
- Riverside-San Bernardino-Ontario, CA
- Population (ZIP)
- 78,006
- Household income
- $126,350
- Rent vs Own
- Severe rent burden
- 1964.0
Population outlook (San Bernardino County) Hauer SSP2
- Today (2025)
- 2,300,329 people
- By 2030
- 2,378,907 · +3.4%
- By 2040
- 2,523,137 · +9.7%
- By 2050
- 2,642,388 · +14.9%
- By 2075
- 2,880,769 · +25.2%
- By 2100
- 2,909,436 · +26.5%
Race, ethnicity, and origin ACS 2023
- Neighborhood character
- Highly diverse neighborhood (Simpson 0.70)
- Race & ethnicity
- Asian 40% Hispanic / Latino 28% White 24% Two or more races 14% Black 5%
- Hispanic origin (detail)
- Mexican 22%
- Common ancestry
- Italian 2% Lithuanian 1% Romanian 1%
- Foreign-born
- 33% · China, Canada, South Korea
- Languages at home
- 52% English-only · Chinese 18% Spanish 14% Tagalog/Filipino 5%
Political lean MEDSL · San Bernardino
- 2024 margin
- Toss-up / Even · D 47.5% · R 49.7% · Other 2.8%
- 2008→2024 swing
- -8.5pp toward R · 2008: 6.3pp · 2024: -2.1pp
- All cycles
- 2024: R+2.1 2020: D+10.7 2016: D+9.8 2012: D+5.4 2008: D+6.3
Not yet ingested
- Civics
- —
Market trends
- HPI YoY
- ▼ -152.62%
- Current HPI
- 383.5042
- Rent YoY
- ▲ 0.20%
- Metro
- Riverside-San Bernardino-Ontario, CA
- State GDP YoY
- ▲ 3.21%
- F500 in state
- 116
Industry mix (Fortune 500 HQ in CA)
| Industry | F500 HQs | Revenue |
|---|---|---|
| Technology | 27 | $1,492B |
|
||
| Financial Services | 3 | $174B |
|
||
| Retail | 3 | $44B |
|
||
| Insurance | 3 | $26B |
|
||
| Media / Entertainment | 2 | $115B |
|
||
| Pharmaceuticals / Biotech | 2 | $62B |
|
||
Price history
+79.8% since first listed25 events — show timeline
- 2026-02-06 Listed $159,999 CRMLS
- 2026-01-01 Listing Removed — SDMLS
- 2025-08-14 Price Changed $164,000 SDMLS
- 2025-07-25 Price Changed $164,900 SDMLS
- 2025-06-22 Price Changed $164,990 SDMLS
- 2025-06-13 Price Changed $164,999 SDMLS
- 2025-05-25 Price Changed $174,000 SDMLS
- 2025-05-19 Price Changed $174,900 SDMLS
- 2025-05-01 Price Changed $174,990 SDMLS
- 2025-04-19 Price Changed $174,999 SDMLS
- 2025-03-27 Listed $199,999 SDMLS
- 2025-03-21 Coming Soon — SDMLS
- 2025-01-06 Listing Removed — CRMLS
- 2024-08-06 Listed $220,000 CRMLS
- 2024-05-14 Listed $250,000 CRMLS
- 2020-04-20 Delisted — CRMLS
- 2019-12-12 Listed $70,000 CRMLS
- 2019-08-31 Listing Removed — CRMLS
- 2019-07-23 Price Changed $70,000 CRMLS
- 2019-05-03 Price Changed $75,000 CRMLS
- 2019-02-27 Listed $78,000 CRMLS
- 2013-12-19 Listing Removed — CRMLS
- 2013-06-19 Listed $50,000 CRMLS
- 2005-11-29 Sold (MLS) $65,000 CRMLS
- 2005-08-26 Listed $89,000 CRMLS
Property tax history
+0.3%/yrLatest (2012): $131 · -0.3% YoY. Source: county tax records.
Cash-flow waterfall
monthlySold comps — $/sqft
last 12 mo · ≤1 miLoading sold comps…