 Duplex
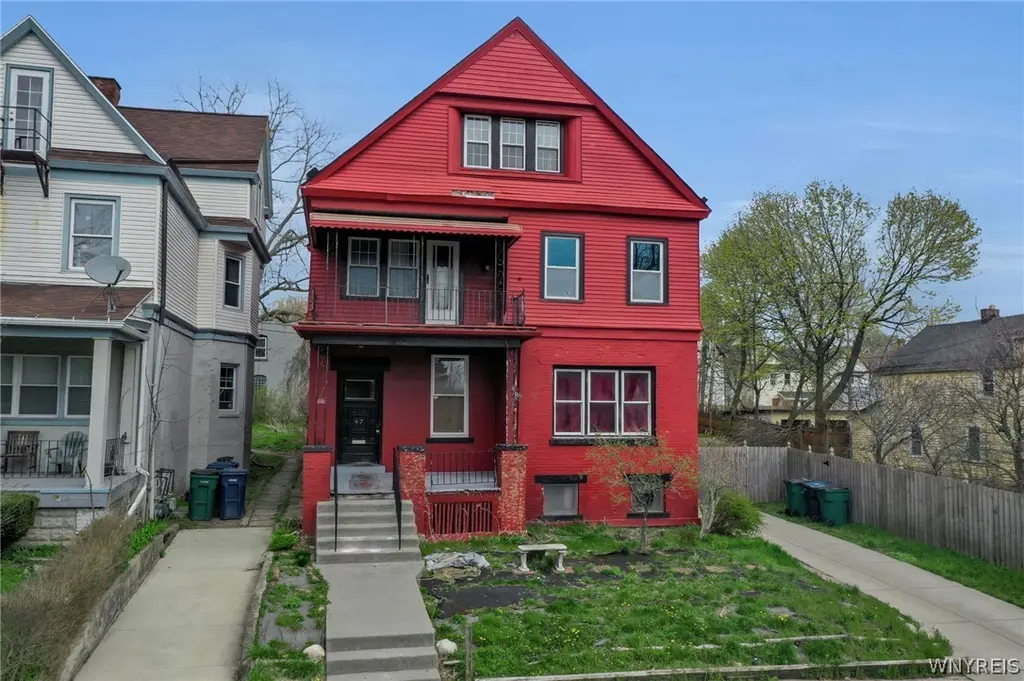
47 Fargo Ave · Buffalo, NY
Flood risk 1/10 · Minimal
- FEMA flood zone
- X (unshaded)
- Chance of flooding over 30 yrs
- 0.0%
- Est. flood insurance / yr
- $507 – $1,088
Fire risk 1/10 · Minimal
- Est. fire insurance / yr
- $691 – $1,283
Heat risk 3/10 · Minor
- Hot days now (above 91°F)
- 7 days/yr
- Hot days in 30 yrs
- 15 days/yr
Wind risk 1/10 · Minimal
- Chance of severe wind over 30 yrs
- —
Air-quality risk 4/10 · Minor
- Unhealthy air days now
- 4 days/yr
- Unhealthy air days in 30 yrs
- 9 days/yr
Risk factors via First Street. Map © Google.
Why this score? — see what drove the B- grade
The composite is a weighted blend of 9 inputs, each scored 0–100. Each bar is that input's sub-score; the figure is the points it added to the 100-point composite (weight × sub-score).
- Cash flow +25.9/30.0
- ARV discount +15.0/15.0
- DSCR +8.7/10.0
- 1% rule +5.6/10.0
- Livability +3.9/5.0
- Rent growth +3.6/5.0
- Schools +3.3/10.0
- Condition / age +2.5/5.0
- Appreciation +0.0/10.0
$419,900
🖨 Deal sheet 📄 Offer letter ✓ Due diligence
Multi-family units
County records classify this as Multi-Family (2-4 Unit). Listing-text estimate: 2 units. confirmed
Listing remarks MLS
Truly Unique!!! This stately home is situated on more than 1/3 of an acre in the Fargo Estate Preservation district! Incredibly well maintained this 2 Family home boasts 3 Bedrooms and 1 bath in each unit with a 2 story upper unit utilizing the finished attic for an incredible amount of bonus living space. Too Many Pluses to list: Hardwood floors, original tile, and period details throughout, renovated upper kitchen, Second Story Laundry, Separate Utilities. The grounds of this property features a fully fenced yard, coy pond, chicken coop, duck habitat, off street parking, front and rear porches. First Showings at Open House on 5/4 from 1-3. Tear off Roof(2015) Exterior Paint(2015) Concrete Driveway and Entry Stairs(2015) Shed(2018) Upper Rear Deck(2017) Second Story Laundry(2017)
Key facts
- Multiple balconies
- Double lot
- Large kitchen
Tags
Property features AI
Finance
- Financial info: Owner pays water; rent includes water; Operating expense details: see remarks; One unit reported with $1,400 actual monthly rent (other unit rent listed as 0)
Exterior
- Parking: Concrete parking area
- Utilities: Public water connected; Sewer connected
- Home design: 2-story multifamily building; Resale property
- Construction: Existing structure; Construction details: see remarks
- Exterior features: Rectangular residential lot; Near public transit; City street frontage
Interior
- Kitchen: Each unit includes an eat-in kitchen
- Bedrooms: Two separate 3-bedroom units (each unit listed as having 3 bedrooms)
- Flooring: Hardwood; Tile; Varies by area
- Bathrooms: Each unit has 1 full bathroom (2 full bathrooms total)
- Heating & cooling: Gas forced-air heating
- Interior features: Hardwood and tile flooring throughout; flooring varies by area; Full basement
- Laundry & utility: Gas water heater
Neighborhood map
What this means for you Summary
Snapshot
- This is a 2 × 3-bed/1.0-bath units multifamily listed at $420k.
Deal economics
- At list price, monthly cash flow is $1k ($12k/yr) — positive. Per door: $513/mo.
- The deal already cash-flows at list — no discount required.
- Meets the 1% rule at list price ($4k rent vs $420k).
- Recommended offer: $407k (3.0% below list) — sets the bar for market timing.
Location & tenants
- Location reads 77/100 on livability (#195 in NY, #3,011 nationally) — a middle-class / working-renter tenant base. Strengths: commute A+, housing A+, health & safety A+; Watch: crime F, employment D-.
- Buffalo City School District (urban): math 41% / reading 40% proficiency, ranked #535 of 590 in NY (top 91%) — families likely to look elsewhere, expect single-tenant / working-renter base with shorter leases; 75% free/reduced lunch — lower-income household profile, screen leases tightly.
- Market conditions: Rents rising fast (+4.3%/yr); 56 active listings in the ZIP; lower-income renter base — watch delinquency; 1,244 units permitted in Erie County in 2024 (563 in 5+ unit buildings).
- At $4,437/mo this rent would consume 131% of the median local household income ($41k/yr) (locally 1213% of renters already pay >50% of income on rent) — very limited rent-growth headroom before tenants either downsize or default.
Forward outlook
- Local home prices are declining (-3.0%/yr); year-one equity from $3k of loan paydown is wiped out by about $13k of value loss. Plan a longer hold.
- At projected returns (-3.0% appreciation + 4.3% rent growth), your $118k cash investment doubles in ~10 years — after that, you're playing with house money.
Negotiation context
- It's been on market 53 days — a 3% lower offer ($407k) is reasonable based on typical stale-listing flexibility.
- 3 sale attempts since 7y ago; this cycle's ask has dropped $60k (13%) from the opening price — seller is motivated, your offer sets the floor, not the list.
Risks & watch-outs
- Watch-outs: built in 1900 — expect roof / HVAC / electrical / plumbing capex.
Questions for the listing agent
- It's been on market 53 days. Have you received any prior offers? Is the seller open to a 3% concession, seller financing, or rate buy-down credit?
- Can we see the unit-by-unit rent roll, current vacancy, and any below-market leases? What's the average tenancy length?
- What capital expenditures (roof, boiler, parking lot, exteriors) have been made in the last 5 years, and what's planned in the next 2?
- Built in 1900 — when were the roof, HVAC, electrical panel, plumbing, and water heater last replaced?
- Is there a deadline driving the sale (1031 exchange, divorce, estate, relocation)? That informs how much negotiation room exists.
- Crime grade is F in this area — have there been break-ins, vandalism, or insurance claims at this property in the last 3 years? What carrier currently insures it and at what premium?
- What's the average days-on-market for RENTAL listings here right now (not sales)? A rising rental-DOM trend means longer vacancies and softer asking-rent achievability than the comps imply.
- What's the recent tenant-quality profile in this submarket — average credit score on applications, eviction rate, late-payment / NSF rate, and stable-employment percentage? A property-management company in the area should have these aggregated.
- How much new apartment / multifamily construction is in the pipeline within 1–3 miles? Heavy new supply (>2% of stock underway) typically softens rents 12–24 months out; light construction supports rent growth.
Investment metrics
- 1% rule
- 1.06% ✓
- Cap rate
- 9.23%
- Cash-on-cash
- 10.47%
- DSCR
- 1.47
- GRM
- 7.9
CMA / ARV
- ARV (median comp)
- $596,478
- List price
- $419,900
- Delta
- -29.60%
- Verdict
- UNDERPRICED
- Comps
- 20 within 1.0 mi
Show comp detail 7 sales within ~0.75 mi
| Address | Dist | Beds/Ba | Sqft | Sold | Price | $/sf | Match |
|---|---|---|---|---|---|---|---|
| 328 Pennsylvania St | 0.15mi | 6/4.0 (-1) | 4,161 (+5%) | 6mo | $449,000 | $108 | 66 |
| 258 Hudson St | 0.08mi | 6/2.0 (-1) | 3,359 (-15%) | 1mo | $150,000 | $45 | 65 |
| 62 Park St | 0.51mi | 7/4.0 | 4,266 (+8%) | 7mo | $450,000 | $105 | 49 |
| 181 Richmond Ave | 0.62mi | 8/3.0 (+1) | 4,002 (+1%) | 17mo | $655,000 | $164 | 46 |
| 243 Niagara St | 0.57mi | 7/3.0 | 3,720 (-6%) | 18mo | $325,000 | $87 | 45 |
| 574 West Ave | 0.63mi | 7/3.0 | 3,360 (-15%) | 11mo | $425,000 | $126 | 32 |
| 761 Prospect Ave | 0.73mi | 8/3.0 (+1) | 3,476 (-12%) | 16mo | $160,000 | $46 | 24 |
Match score weights: distance 35% · size 25% · config 20% · recency 20%. Top-matched comps best support the ARV.
Projected returns pro-forma
-3.0% appreciation · 4.28% rent growth · sell at horizon
- IRR
- 0.6%
- Equity multiple
- 1.02×
- Total profit
- $2,910
- Equity at exit
- $62,608
- IRR
- 11.4%
- Equity multiple
- 1.94×
- Total profit
- $110,283
- Equity at exit
- $36,305
Cash invested: $117,572 (down + closing). Projections, not guarantees.
Landlord ↔ Tenant lean methodology
- Overall (STATE)
- 15 Strongly Tenant-Friendly
- State New York
- 15 Strongly Tenant-Friendly · D+10
- County
- — inherits STATE
- City
- — inherits STATE
ZIP-level market 14201
- Home prices YoY
- -19.1%
- Rents YoY
- 4.3%
- Active inventory
- 56
- Price-to-rent
- 15.8×
Monthly cashflow live
- Estimated rent
- $4,437 high interval (Pro) →
- Mortgage (P&I)
- −$2,202
- Tax from tax record
- −$102 /mo · $1,225/yr
- Insurance
- −$175
- HOA
- −$0
- Vacancy / Maint / Mgmt
- −$932
- Net cashflow
- $1,026
Break-even live
2-unit breakdown (identical units grouped — click to expand)
| Units | Beds | Baths | Est. rent |
|---|---|---|---|
| 2× units | 3 | 1 | $4,436 |
| #1 | 3 | 1 | $2,218 |
| #2 | 3 | 1 | $2,218 |
| Total (2 units) | $4,437 | ||
UW: 25.0% down · 7.5% · 30yr · 1.5% tax · 5.0% vac · 8.0% maint · 8.0% mgmt
Financing live
Cash to close
- Down payment
- $104,975
- Closing costs
- $12,597
- Reserves months
- —
- Total cash needed
- —
Loan-product check · same deal, 3 products live
Conventional
25% down · 7.5% · 30yr
- Down + closing
- —
- Monthly P&I
- —
- Monthly cashflow
- —
- DSCR
- —
- Eligible?
- —
Personal DTI + credit; lowest rate.
DSCR
20% down · 8.5% · 30yr
- Down + closing
- —
- Monthly P&I
- —
- Monthly cashflow
- —
- DSCR
- —
- Eligible?
- —
No personal income docs; deal must DSCR.
Hard money
10% down · 12.0% · 12mo
- Down + closing
- —
- Monthly P&I
- —
- Monthly cashflow
- —
- DSCR
- —
- Eligible?
- —
Short-term bridge; refi at stabilization.
Listing history 22 events
-
2026-06-18days on market $419,900 Active 53 DOM
-
2026-06-17days on market $419,900 Active 52 DOM
-
2026-06-16days on market $419,900 Active 51 DOM
-
2026-06-15days on market $419,900 Active 50 DOM
-
2026-06-13days on market $419,900 Active 48 DOM
-
2026-06-13days on market $419,900 Active 47 DOM
-
2026-06-10days on market $419,900 Active 45 DOM
-
2026-06-09days on market $419,900 Active 44 DOM
-
2026-06-08days on market $419,900 Active 43 DOM
-
2026-06-07pricedays on market $419,900 Active 42 DOM
-
2026-06-03days on market $449,900 Active 38 DOM
-
2026-06-02days on market $449,900 Active 37 DOM
-
2026-06-01days on market $449,900 Active 36 DOM
-
2026-05-31days on market $449,900 Active 35 DOM
-
2026-04-26$479,900 Active 1600-char remark
-
2025-06-05historical
-
2025-05-20price $499,900
-
2025-04-02$549,900 Active
-
2019-08-16soldstatus $370,650 Closed Sale or Rented
Show marketing remark (796 chars)
Truly Unique!!! This stately home is situated on more than 1/3 of an acre in the Fargo Estate Preservation district! Incredibly well maintained this 2 Family home boasts 3 Bedrooms and 1 bath in each unit with a 2 story upper unit utilizing the finished attic for an incredible amount of bonus living space. Too Many Pluses to list: Hardwood floors, original tile, and period details throughout, renovated upper kitchen, Second Story Laundry, Separate Utilities. The grounds of this property features a fully fenced yard, coy pond, chicken coop, duck habitat, off street parking, front and rear porches. First Showings at Open House on 5/4 from 1-3. Tear off Roof(2015) Exterior Paint(2015) Concrete Driveway and Entry Stairs(2015) Shed(2018) Upper Rear Deck(2017) Second Story Laundry(2017)
-
2019-05-09status Under Contract- Do Not Show
Show marketing remark (796 chars)
Truly Unique!!! This stately home is situated on more than 1/3 of an acre in the Fargo Estate Preservation district! Incredibly well maintained this 2 Family home boasts 3 Bedrooms and 1 bath in each unit with a 2 story upper unit utilizing the finished attic for an incredible amount of bonus living space. Too Many Pluses to list: Hardwood floors, original tile, and period details throughout, renovated upper kitchen, Second Story Laundry, Separate Utilities. The grounds of this property features a fully fenced yard, coy pond, chicken coop, duck habitat, off street parking, front and rear porches. First Showings at Open House on 5/4 from 1-3. Tear off Roof(2015) Exterior Paint(2015) Concrete Driveway and Entry Stairs(2015) Shed(2018) Upper Rear Deck(2017) Second Story Laundry(2017)
-
2019-04-29$349,900 Active
Show marketing remark (796 chars)
Truly Unique!!! This stately home is situated on more than 1/3 of an acre in the Fargo Estate Preservation district! Incredibly well maintained this 2 Family home boasts 3 Bedrooms and 1 bath in each unit with a 2 story upper unit utilizing the finished attic for an incredible amount of bonus living space. Too Many Pluses to list: Hardwood floors, original tile, and period details throughout, renovated upper kitchen, Second Story Laundry, Separate Utilities. The grounds of this property features a fully fenced yard, coy pond, chicken coop, duck habitat, off street parking, front and rear porches. First Showings at Open House on 5/4 from 1-3. Tear off Roof(2015) Exterior Paint(2015) Concrete Driveway and Entry Stairs(2015) Shed(2018) Upper Rear Deck(2017) Second Story Laundry(2017)
-
1994-08-19soldstatus $56,000
ⓘ Source: listings_history table (triggers on properties + properties_extension) + one-shot
backfill from property_details.listing_events for pre-trigger history.
Tax reassessment forecast NY · Partial reset (capped growth)
- Current annual tax
- $1,225 · $102/mo
- Projected year-2 tax
- $4,161 · $347/mo
- Expected delta
- +$2,936/yr (+$245/mo · 239.6%)
ⓘ Screening estimate from a state-policy table — verify with the county assessor before closing.
Climate risk First Street
- Flood 1/10 Low FEMA zone X (unshaded) · 0% chance over 30 yrs
- Wildfire 1/10 Low
- Heat 3/10 Moderate 7 d/yr ≥91°F today · 15 d/yr by 30 yrs out
- Wind 1/10 Low
- Air quality 4/10 Moderate 4 unhealthy d/yr today · 9 by 30 yrs out
Nearby sold comps map
Loading sold comps map…
Walkable amenities ~0.75 mi
Loading nearby amenities…
Taxation est. · year 1
- Rental income
- $53,244
- − Mortgage interest
- −$23,521
- − Property taxes
- −$1,225
- − Insurance
- −$2,100
- − Repairs & maintenance
- −$4,260
- − Management
- −$4,260
- − Depreciation
- −$12,215
- Taxable income
- $5,664
- Est. tax owed @ 24.0%
- −$1,359
- After-tax cash flow
- $10,955/yr
For passive investors: Depreciation is non-cash, so a rental often shows a tax loss while cash-flowing — sheltering income. Rental losses are passive: they offset passive income freely, and up to $25,000/yr can offset ordinary (W-2) income if you actively participate and your MAGI is under $100k (phasing out to $0 by $150k); unused losses carry forward. On sale, claimed depreciation is recaptured at up to 25%, and gains may owe capital-gains tax (a 1031 exchange can defer both). Figures are a year-1 estimate at your 24.0% rate — not tax advice; consult a CPA.
Schools (NCES district)
- District
- Buffalo City School District
- NCES district ID
- 3605850
- Math proficiency
- 41% ▲ 11.00%
- Reading proficiency
- 40% ▲ 7.00%
- Median HH income
- $31,665
- Composite
- 33.17/100
- National rank
- #5544
- State rank
- #535 of 590 in NY
Livability — Buffalo
- Score
- 77/100
- State rank
- #195
- US rank
- #3011
Category grades
Schools grade is shown separately in the Schools card above.
Census & demographics
- Census place
- Buffalo, NY
- County
- Erie County · 714,559 people
- City population
- 440,021
- Metro
- Buffalo-Cheektowaga, NY
- Population (ZIP)
- 12,369
- Household income
- $40,512
- Rent vs Own
- Severe rent burden
- 1213.0
Population outlook (Erie County) Hauer SSP2
- Today (2025)
- 933,037 people
- By 2030
- 935,181 · +0.2%
- By 2040
- 928,531 · -0.5%
- By 2050
- 905,725 · -2.9%
- By 2075
- 834,037 · -10.6%
- By 2100
- 708,033 · -24.1%
Race, ethnicity, and origin ACS 2023
- Neighborhood character
- Diverse neighborhood (Simpson 0.66)
- Race & ethnicity
- White 42% Hispanic / Latino 36% Black 16% Two or more races 12% Asian 2% Native American 1%
- Hispanic origin (detail)
- Mexican 4% Puerto Rican 30% Dominican 1%
- Common ancestry
- Romanian 7% Subsaharan African 2% Slovak 1%
- Foreign-born
- 8% · Canada, China
- Languages at home
- 69% English-only · Spanish 24% Arabic 2% Other Indo-European 1%
Political lean MEDSL · Erie
- 2024 margin
- Lean D (+9.7) · D 54.8% · R 45.2%
- 2008→2024 swing
- -7.9pp toward R · 2008: 17.5pp · 2024: 9.7pp
- All cycles
- 2024: D+9.7 2020: D+14.7 2016: D+4.8 2012: D+15.6 2008: D+17.5
Not yet ingested
- Civics
- —
Market trends
- HPI YoY
- ▼ -68.73%
- Current HPI
- 290.2643
- Rent YoY
- ▲ 4.28%
- Metro
- Buffalo-Cheektowaga, NY
- State GDP YoY
- ▲ 2.60%
- F500 in state
- 92
Industry mix (Fortune 500 HQ in NY)
| Industry | F500 HQs | Revenue |
|---|---|---|
| Financial Services | 10 | $950B |
|
||
| Consumer Goods | 9 | $162B |
|
||
| Insurance | 4 | $225B |
|
||
| Telecommunications | 2 | $144B |
|
||
| Pharmaceuticals | 2 | $112B |
|
||
| Media / Entertainment | 2 | $69B |
|
||
Price history
+649.8% since first listed10 events — show timeline
- 2026-06-06 Price Changed $419,900 WNYREIS
- 2026-05-27 Price Changed $449,900 WNYREIS
- 2026-04-26 Listed $479,900 WNYREIS
- 2025-06-05 Listing Removed — WNYREIS
- 2025-05-20 Price Changed $499,900 WNYREIS
- 2025-04-02 Listed $549,900 WNYREIS
- 2019-08-16 Sold (MLS) $370,650 WNYREIS
- 2019-05-09 Pending — WNYREIS
- 2019-04-29 Listed $349,900 WNYREIS
- 1994-08-19 Sold (Public Records) $56,000 Public Records
Property tax history
+10.8%/yrLatest (2025): $1,225 · -5.4% YoY. Source: county tax records.
Cash-flow waterfall
monthlySold comps — $/sqft
last 12 mo · ≤1 miLoading sold comps…