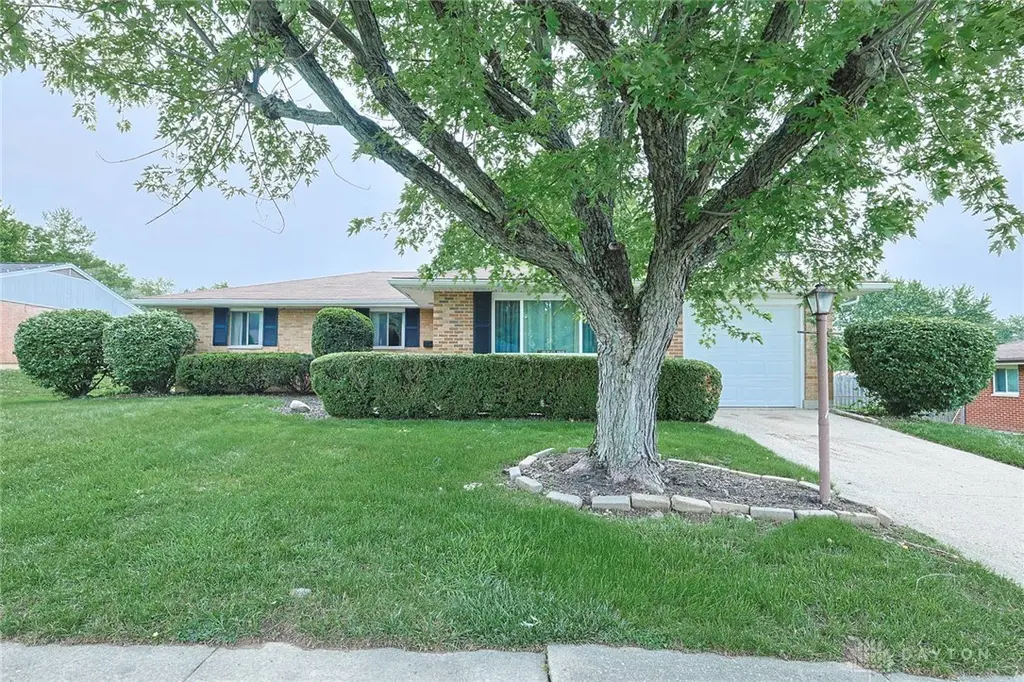
5718 Woodmore Dr · Dayton, OH
Flood risk 1/10 · Minimal
- FEMA flood zone
- X (unshaded)
- Chance of flooding over 30 yrs
- 0.0%
- Est. flood insurance / yr
- $507 – $1,088
Fire risk 1/10 · Minimal
- Est. fire insurance / yr
- $713 – $1,323
Heat risk 3/10 · Minor
- Hot days now (above 103°F)
- 7 days/yr
- Hot days in 30 yrs
- 18 days/yr
Wind risk 2/10 · Minimal
- Chance of severe wind over 30 yrs
- —
Air-quality risk 3/10 · Minor
- Unhealthy air days now
- 2 days/yr
- Unhealthy air days in 30 yrs
- 4 days/yr
Risk factors via First Street. Map © Google.
Why this score? — see what drove the D+ grade
The composite is a weighted blend of 9 inputs, each scored 0–100. Each bar is that input's sub-score; the figure is the points it added to the 100-point composite (weight × sub-score).
- Cash flow +15.8/30.0
- ARV discount +9.3/15.0
- DSCR +4.9/10.0
- Rent growth +4.4/5.0
- 1% rule +4.2/10.0
- Livability +3.2/5.0
- Condition / age +2.5/5.0
- Schools +1.3/10.0
- Appreciation +0.0/10.0
$175,000
🖨 Deal sheet (PDF) 📄 Offer letter ✓ Due diligence
Listing remarks
This charming and well-cared-for brick ranch home, lovingly maintained by the same owner for more than 50 years, is situated on a generously sized lot in Bartley Estates. Inside, natural light fills the living room, creating a warm and calming ambiance. The dining area can also serve as a functional flex space and transitions seamlessly into the eat-in kitchen, offering ample cabinetry and counter space. Just off the kitchen, the half bath/laundry room is conveniently positioned near the back entry, creating an ideal everyday transition space for pets, outdoor activities, and entertaining. Three bedrooms provide comfortable and quiet personal retreats. The hall bathroom features a combined
Key facts
- Ample cabinetry
- Generously sized lot
- Flex space
Tags
Property features AI
Finance
- Other: Not specified
- Financial info: Property is offered for sale
- HOA & community: Not specified
Exterior
- Parking: Attached one-car garage with garage door opener
- Security: Not specified
- Utilities: Not specified
- Home design: Single-story property
- Construction: Brick and vinyl siding exterior; Slab foundation
- Exterior features: Residential zoning; Lot dimensions about 80 x 187; Lot approximately 0.34 acres
Interior
- Kitchen: Not specified
- Bedrooms: Not specified
- Flooring: Not specified
- Bathrooms: 1 full bathroom; 1 half bathroom; 2 bathrooms on the main level
- Heating & cooling: Forced air heating (natural gas); Central air conditioning
- Interior features: 6 total rooms
- Laundry & utility: Not specified
Neighborhood map
What this means for you Summary
Snapshot
- This is a 3-bed/1.5-bath single-family listed at $175k.
Deal economics
- At list price, monthly cash flow is $79 ($950/yr) — positive.
- The deal already cash-flows at list — no discount required.
- To meet the 1% rule (rent ≥ 1% of price), the offer needs to be $162k (7.6% below list).
- Recommended offer: $162k (7.6% below list) — sets the bar for 1% rule.
Location & tenants
- Location reads 65/100 on livability (#716 in OH) — a middle-class / working-renter tenant base. Strengths: cost of living A+, housing A+, health & safety A; Watch: amenities C-, crime F, commute F.
- Northridge Local (suburban): math 11% / reading 22% proficiency, ranked #640 of 656 in OH (top 98%) — low school quality limits family demand, transient renter base, plan for 1-2y turnover; 81% free/reduced lunch — lower-income household profile, screen leases tightly.
- Zoned schools: Northridge Elementary School (math 14% / reading 23%, grade F, #1,323 of 1,584 statewide, top 84%, 734 students, 0% FRL); Northridge Middle School (math 9% / reading 18%, grade F, #639 of 654 statewide, top 98%, 354 students, 0% FRL); Northridge High School (math 8% / reading 27%, grade F, #689 of 781 statewide, top 90%, 422 students, 0% FRL) — zoned schools average 0% FRL vs 81% district-wide (81 pts lower); this property's tenant base skews higher-income than the district average.
- Market conditions: Rents rising fast (+7.4%/yr); 52 active listings in the ZIP; 10 comparable units currently listed for rent nearby; rentals at typical pace (median 16d on market — plan ~3-4 weeks tenant-placement turnaround); 907 units permitted in Montgomery County in 2024 (416 in 5+ unit buildings).
- This rent runs 36% of the median local income ($54k/yr) — at the standard rent-burdened threshold; future hikes will face affordability resistance.
Forward outlook
- Local home prices are declining (-3.0%/yr); year-one equity from $1k of loan paydown is wiped out by about $5k of value loss. Plan a longer hold.
- Montgomery County population projected at -10% by 2050 — secular population decline; favor cash flow + early exit over multi-decade hold.
Negotiation context
- Only 3 days on market — expect competitive offers; lowballing is unlikely to land.
- Current owner paid $40k; list at $175k implies a 338% gain — meaningful room to come down on a strong offer.
Questions for the listing agent
- Built in 1960 — when were the roof, HVAC, electrical panel, plumbing, and water heater last replaced?
- Is there a deadline driving the sale (1031 exchange, divorce, estate, relocation)? That informs how much negotiation room exists.
- Crime grade is F in this area — have there been break-ins, vandalism, or insurance claims at this property in the last 3 years? What carrier currently insures it and at what premium?
- The area grade is low — what's the realistic commute time and amenity access for the typical tenant pool here? Any planned neighborhood developments (good or bad) we should know about?
- What's the average days-on-market for RENTAL listings here right now (not sales)? A rising rental-DOM trend means longer vacancies and softer asking-rent achievability than the comps imply.
- What's the recent tenant-quality profile in this submarket — average credit score on applications, eviction rate, late-payment / NSF rate, and stable-employment percentage? A property-management company in the area should have these aggregated.
- How much new for-sale + rental construction is in the pipeline within 1–3 miles? Heavy new supply typically softens prices + rents 12–24 months out; constrained supply supports both.
Investment metrics
- 1% rule
- 0.92% ✗
- Cap rate
- 6.84%
- Cash-on-cash
- 1.94%
- DSCR
- 1.09
- GRM
- 9.0
CMA / ARV
- ARV (on-the-fly)
- $182,313
- Comps found
- 12
Show comp detail 12 sales within ~0.75 mi
| Address | Dist | Beds/Ba | Sqft | Sold | Price | $/sf | Match |
|---|---|---|---|---|---|---|---|
| 5718 Woodmore Dr | 0.00mi | 3/1.5 | 1,293 (0%) | 0mo | $172,500 | $133 | 100 |
| 2416 Stop 8 Rd | 0.32mi | 3/1.5 | 1,296 (+0%) | 0mo | $190,000 | $147 | 84 |
| 5710 Durand St | 0.13mi | 3/1.5 | 1,350 (+4%) | 9mo | $190,000 | $141 | 79 |
| 5421 Northcutt Pl | 0.35mi | 3/1.5 | 1,226 (-5%) | 0mo | $198,900 | $162 | 75 |
| 2024 Kildare Ave | 0.45mi | 3/2.0 | 1,298 (+0%) | 8mo | $170,000 | $131 | 70 |
| 5563 Fair Valley Rd | 0.37mi | 3/1.0 | 1,210 (-6%) | 2mo | $189,900 | $157 | 69 |
| 2006 High Knoll Dr | 0.39mi | 3/2.0 | 1,160 (-10%) | 3mo | $191,000 | $165 | 60 |
| 2010 Gipsy Dr | 0.55mi | 3/1.0 | 1,373 (+6%) | 6mo | $122,499 | $89 | 57 |
| 6029 Imperial Hills Dr | 0.50mi | 3/2.0 | 1,411 (+9%) | 6mo | $210,000 | $149 | 55 |
| 2021 Cardinal Ave | 0.59mi | 2/1.0 (-1) | 1,238 (-4%) | 8mo | $128,000 | $103 | 52 |
| 2330 Arthur Ave | 0.72mi | 3/1.0 | 1,252 (-3%) | 9mo | $160,000 | $128 | 51 |
| 2159 Gipsy Dr | 0.65mi | 3/1.0 | 1,135 (-12%) | 6mo | $125,000 | $110 | 42 |
Match score weights: distance 35% · size 25% · config 20% · recency 20%. Top-matched comps best support the ARV.
Projected returns pro-forma
-3.0% appreciation · 7.41% rent growth · sell at horizon
- IRR
- -8.4%
- Equity multiple
- 0.68×
- Total profit
- $-15,807
- Equity at exit
- $26,093
- IRR
- 6.1%
- Equity multiple
- 1.54×
- Total profit
- $26,467
- Equity at exit
- $15,131
Cash invested: $49,000 (down + closing). Projections, not guarantees.
Landlord ↔ Tenant lean methodology
- Overall (STATE)
- 73 Landlord-Friendly
- State Ohio
- 73 Landlord-Friendly · R+6
- County
- — inherits STATE
- City
- — inherits STATE
ZIP-level market 45414
- Rents YoY
- 7.4%
- Active inventory
- 52
- Price-to-rent
- 9.0×
Monthly cashflow live
- Estimated rent
- $1,616 high interval (Pro) →
- Mortgage (P&I)
- −$918
- Tax from tax record
- −$207 /mo · $2,484/yr
- Insurance
- −$73
- HOA
- −$0
- Vacancy / Maint / Mgmt
- −$339
- Net cashflow
- $79
Break-even live
Sensitivity live
| Price | -10% $178 | -5% $129 | +0% $79 | +5% $30 | +10% $-20 |
|---|---|---|---|---|---|
| Rent | -10% $-48 | -5% $15 | +0% $79 | +5% $143 | +10% $207 |
| Rate | -1.0pp $167 | -0.5pp $124 | base $79 | +0.5pp $34 | +1.0pp $-12 |
UW: 25.0% down · 7.5% · 30yr · 1.5% tax · 5.0% vac · 8.0% maint · 8.0% mgmt
Financing live
Cash to close
- Down payment
- $43,750
- Closing costs
- $5,250
- Reserves months
- —
- Total cash needed
- —
Loan-product check · same deal, 3 products live
Conventional
25% down · 7.5% · 30yr
- Down + closing
- —
- Monthly P&I
- —
- Monthly cashflow
- —
- DSCR
- —
- Eligible?
- —
Personal DTI + credit; lowest rate.
DSCR
20% down · 8.5% · 30yr
- Down + closing
- —
- Monthly P&I
- —
- Monthly cashflow
- —
- DSCR
- —
- Eligible?
- —
No personal income docs; deal must DSCR.
Hard money
10% down · 12.0% · 12mo
- Down + closing
- —
- Monthly P&I
- —
- Monthly cashflow
- —
- DSCR
- —
- Eligible?
- —
Short-term bridge; refi at stabilization.
Rent comps 10 comps
| Address | Beds | Baths | Sqft | Rent | $/sqft | DOM | Units | Dist |
|---|---|---|---|---|---|---|---|---|
| 2022 Arthur Ave Unit NA Dayton, OH | 3.0 | 1.0 | 1040 | $1,500 | $1.44 | 13d | 1 | 0.45mi |
| 6418 Oakhurst Pl Dayton, OH | 3.0 | 2.0 | 1865 | $1,995 | $1.07 | 45d | 1 | 0.71mi |
| 5208 Brookmill Ct Dayton, OH | 3.0 | 2.0 | 1800 | $2,000 | $1.11 | 4d | 1 | 0.84mi |
| 3006 Benchwood Rd Unit 1 Dayton, OH | 2.0 | 1.5 | 1250 | $1,275 | $1.02 | 25d | 1 | 0.95mi |
| 2991 Benchwood Rd Unit 2993 Dayton, OH | 2.0 | 1.5 | 1063 | $1,295 | $1.22 | 4d | 1 | 0.97mi |
| 3136 Silver Rock Ave Unit 3138 Dayton, OH | 2.0 | 1.5 | 1274 | $1,395 | $1.09 | 21d | 1 | 1.00mi |
| 3097 Silver Rock Ave Unit 3103 Dayton, OH | 2.0 | 1.5 | 1035 | $1,295 | $1.25 | 16d | 1 | 1.04mi |
| 3155 Silver Rock Ave Unit 3157 Dayton, OH | 2.0 | 1.5 | 1200 | $1,500 | $1.25 | 4d | 1 | 1.04mi |
| 3161 Autumn Ridge Ct Unit 3163 Dayton, OH | 2.0 | 1.5 | 1507 | $1,395 | $0.93 | 23d | 1 | 1.13mi |
| 4339 Riverside Dr Dayton, OH | 1.0–3.0 | 1.0–2.0 | 936 | $1,399 | $1.49 | 4d | 12 | 1.46mi |
Listing history 3 events
-
2026-05-31status $175,000 Pending 3 DOM
-
2026-05-05$175,000 Active
-
1987-07-06soldstatus $40,000
ⓘ Source: listings_history table (triggers on properties + properties_extension) + one-shot
backfill from property_details.listing_events for pre-trigger history.
Tax reassessment forecast OH · Partial reset (capped growth)
- Current annual tax
- $2,484 · $207/mo
- Projected year-2 tax
- $2,607 · $217/mo
- Expected delta
- +$123/yr (+$10/mo · 5.0%)
ⓘ Screening estimate from a state-policy table — verify with the county assessor before closing.
Climate risk First Street
- Flood 1/10 Low FEMA zone X (unshaded) · 0% chance over 30 yrs
- Wildfire 1/10 Low
- Heat 3/10 Moderate 7 d/yr ≥103°F today · 18 d/yr by 30 yrs out
- Wind 2/10 Low
- Air quality 3/10 Moderate 2 unhealthy d/yr today · 4 by 30 yrs out
Nearby sold comps map
Loading sold comps map…
Walkable amenities ~0.75 mi
Loading nearby amenities…
Taxation est. · year 1
- Rental income
- $19,395
- − Mortgage interest
- −$9,803
- − Property taxes
- −$2,484
- − Insurance
- −$875
- − Repairs & maintenance
- −$1,552
- − Management
- −$1,552
- − Depreciation
- −$5,091
- Taxable loss
- −$1,961
- Est. tax savings @ 24.0%
- +$471
- After-tax cash flow
- $1,421/yr
For passive investors: Depreciation is non-cash, so a rental often shows a tax loss while cash-flowing — sheltering income. Rental losses are passive: they offset passive income freely, and up to $25,000/yr can offset ordinary (W-2) income if you actively participate and your MAGI is under $100k (phasing out to $0 by $150k); unused losses carry forward. On sale, claimed depreciation is recaptured at up to 25%, and gains may owe capital-gains tax (a 1031 exchange can defer both). Figures are a year-1 estimate at your 24.0% rate — not tax advice; consult a CPA.
Schools (NCES district)
- District
- Northridge Local
- NCES district ID
- 3904873
- Math proficiency
- 11% ▼ -21.00%
- Reading proficiency
- 22% ▼ -16.00%
- Median HH income
- $28,923
- Composite
- 12.95/100
- National rank
- #9576
- State rank
- #640 of 656 in OH
Livability — Dayton
- Score
- 65/100
- State rank
- #716
- US rank
- #12895
Category grades
Schools grade is shown separately in the Schools card above.
Census & demographics
- Census place
- Dayton, OH
- County
- Montgomery County · 459,541 people
- City population
- 164,387
- Metro
- Dayton-Kettering, OH
- Population (ZIP)
- 21,167
- Household income
- $54,485
- Rent vs Own
- Severe rent burden
- 801.0
Population outlook (Montgomery County) Hauer SSP2
- Today (2025)
- 523,241 people
- By 2030
- 514,948 · -1.6%
- By 2040
- 493,378 · -5.7%
- By 2050
- 469,639 · -10.2%
- By 2075
- 418,360 · -20.0%
- By 2100
- 353,315 · -32.5%
Race, ethnicity, and origin ACS 2023
- Neighborhood character
- Predominantly White (75%)
- Race & ethnicity
- White 75% Black 15% Two or more races 6% Hispanic / Latino 4% Asian 1%
- Common ancestry
- Slovak 2% Romanian 2% Italian 2%
- Foreign-born
- 4% · Canada
- Languages at home
- 94% English-only · Spanish 2% Arabic 1% Tagalog/Filipino 1%
Political lean MEDSL · Montgomery
- 2024 margin
- Toss-up / Even · D 49.8% · R 49.3%
- 2008→2024 swing
- -5.8pp toward R · 2008: 6.2pp · 2024: 0.5pp
- All cycles
- 2024: D+0.5 2020: D+2.2 2016: R+1.2 2012: D+3.1 2008: D+6.2
Not yet ingested
- Civics
- —
Market trends
- HPI YoY
- ▼ -142.46%
- Current HPI
- 183.1124
- Rent YoY
- ▲ 7.41%
- Metro
- Dayton-Kettering, OH
- State GDP YoY
- ▲ 1.98%
- F500 in state
- 48
Industry mix (Fortune 500 HQ in OH)
| Industry | F500 HQs | Revenue |
|---|---|---|
| Insurance | 3 | $145B |
|
||
| Industrial Machinery | 3 | $49B |
|
||
| Financial Services | 3 | $24B |
|
||
| Consumer Goods | 2 | $93B |
|
||
| Aerospace / Defense | 2 | $47B |
|
||
| Utilities | 2 | $33B |
|
||
Price history
+337.5% since first listed2 events — show timeline
- 2026-05-05 Listed $175,000 Dayton MLS
- 1987-07-06 Sold (Public Records) $40,000 Public Records
Property tax history
+0.4%/yrLatest (2025): $2,484 · -10.6% YoY. Source: county tax records.
Cash-flow waterfall
monthlySold comps — $/sqft
last 12 mo · ≤1 miLoading sold comps…