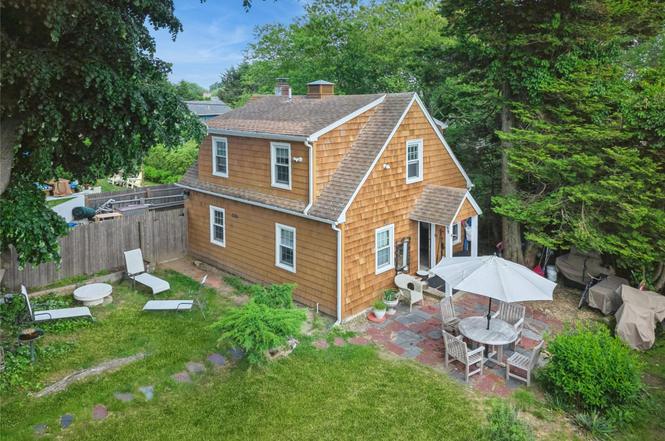
89 S Elroy Dr · Montauk, NY
Flood risk 1/10 · Minimal
- FEMA flood zone
- X (unshaded)
- Chance of flooding over 30 yrs
- 0.0%
- Est. flood insurance / yr
- $473 – $860
Fire risk 1/10 · Minimal
- Est. fire insurance / yr
- $691 – $1,283
Heat risk 4/10 · Minor
- Hot days now (above 88°F)
- 8 days/yr
- Hot days in 30 yrs
- 22 days/yr
Wind risk 8/10 · Major
- Chance of severe wind over 30 yrs
- 80.0%
Air-quality risk 2/10 · Minimal
- Unhealthy air days now
- 2 days/yr
- Unhealthy air days in 30 yrs
- 2 days/yr
Risk factors via First Street. Map © Google.
Why this score? — see what drove the B grade
The composite is a weighted blend of 9 inputs, each scored 0–100. Each bar is that input's sub-score; the figure is the points it added to the 100-point composite (weight × sub-score).
- Cash flow +28.0/30.0
- DSCR +9.9/10.0
- 1% rule +7.7/10.0
- ARV discount +7.5/15.0
- Schools +5.1/10.0
- Appreciation +4.1/10.0
- Livability +3.5/5.0
- Rent growth +2.5/5.0
- Condition / age +2.5/5.0
$1,500,000
🖨 Deal sheet 📄 Offer letter ✓ Due diligence
Listing remarks
This recently renovated and turn key 3 bedroom, 1.5 bath beach house is located in Montauk’s historic Shepherd’s Neck. Close proximity to town, local restaurants and Hither Hills Beach.
Key facts
- 3,294 sq ft lot
- Built 1956
Property features AI
Exterior
- Parking: Driveway
- Utilities: Septic tank; Cable connected; Electricity connected; Water connected
- Home design: Single family residence
- Construction: Shake siding construction
- Exterior features: Shake siding; Not waterfront
Interior
- Kitchen: Dishwasher; Microwave; Oven; Refrigerator; Stainless steel appliances; Granite counters
- Bedrooms: Bedroom on the first floor
- Bathrooms: 1 full bathroom; 1 half bathroom
- Heating & cooling: Baseboard heating; Hot air heating; Ductless cooling
- Interior features: First-floor bedroom; Granite countertops; Open kitchen layout; 8 rooms total; No basement; No attic
- Laundry & utility: Washer; Dryer; Oil water heater
Neighborhood map
What this means for you Summary
Snapshot
- This is a 3-bed/1.5-bath single-family listed at $1.50M.
Deal economics
- At list price, monthly cash flow is $5k ($56k/yr) — positive.
- The deal already cash-flows at list — no discount required.
- Meets the 1% rule at list price ($19k rent vs $1.50M).
- Cap rate 10.0% vs local median 7.9% in Montauk — meaningfully above typical; check what's discounted (condition, days-on-market, listing class) to confirm the premium yield is real.
Location & tenants
- Location reads 69/100 on livability (#474 in NY) — a middle-class / working-renter tenant base. Strengths: crime A+, employment A+, health & safety A; Watch: housing C-, amenities F, commute F.
- Montauk Union Free School District (town): math 50% / reading 60% proficiency, ranked #311 of 755 in NY (top 41%) — acceptable for families but not a draw, mixed tenant base, ~2y average lease.
- Zoned schools: Montauk School (math 62% / reading 82%, grade A-, #378 of 2,108 statewide, top 20%, 303 students, 0% FRL) — zoned schools average 0% FRL vs 21% district-wide (21 pts lower); this property's tenant base skews higher-income than the district average.
- Zoned-school proficiency averages 72% at this address vs 55% district-wide (+17 pts) — the actual schools serving this property are materially stronger than the Montauk Union Free School District average implies; a family-tenant draw the district grade alone would hide.
- Market conditions: 39 active listings in the ZIP; high-income renter base; 1,366 units permitted in Suffolk County in 2024 (216 in 5+ unit buildings).
- At $19,019/mo this rent would consume 160% of the median local household income ($143k/yr) (locally 20% of renters already pay >50% of income on rent) — very limited rent-growth headroom before tenants either downsize or default.
Forward outlook
- Local home prices are declining (-1.8%/yr); year-one equity from $10k of loan paydown is wiped out by about $27k of value loss. Plan a longer hold.
- Suffolk County population projected to shrink 5% by 2050 — rents likely to lag national; underwrite the cash flow, not the appreciation.
- At projected returns (-1.8% appreciation + 3.0% rent growth), your $420k cash investment doubles in ~8 years — after that, you're playing with house money.
Negotiation context
- Only 1 days on market — expect competitive offers; lowballing is unlikely to land.
Risks & watch-outs
- Watch-outs: built in 1956 — expect roof / HVAC / electrical / plumbing capex.
- Climate carrying-cost: severe wind risk, 80% chance of damaging wind over 30y — expect insurance premiums to compound above CPI over the hold.
Questions for the listing agent
- Built in 1956 — when were the roof, HVAC, electrical panel, plumbing, and water heater last replaced?
- Is there a deadline driving the sale (1031 exchange, divorce, estate, relocation)? That informs how much negotiation room exists.
- What's the average days-on-market for RENTAL listings here right now (not sales)? A rising rental-DOM trend means longer vacancies and softer asking-rent achievability than the comps imply.
- What's the recent tenant-quality profile in this submarket — average credit score on applications, eviction rate, late-payment / NSF rate, and stable-employment percentage? A property-management company in the area should have these aggregated.
- How much new for-sale + rental construction is in the pipeline within 1–3 miles? Heavy new supply typically softens prices + rents 12–24 months out; constrained supply supports both.
Investment metrics
- 1% rule
- 1.27% ✓
- Cap rate
- 10.02%
- Cash-on-cash
- 13.31%
- DSCR
- 1.59
- GRM
- 6.6
CMA / ARV
No comps found within radius.
Projected returns pro-forma
-1.78% appreciation · 3.0% rent growth · sell at horizon
- IRR
- 7.4%
- Equity multiple
- 1.31×
- Total profit
- $131,940
- Equity at exit
- $306,611
- IRR
- 14.8%
- Equity multiple
- 2.35×
- Total profit
- $568,492
- Equity at exit
- $276,755
Cash invested: $420,000 (down + closing). Projections, not guarantees.
Landlord ↔ Tenant lean methodology
- Overall (STATE)
- 15 Strongly Tenant-Friendly
- State New York
- 15 Strongly Tenant-Friendly · D+10
- County
- — inherits STATE
- City
- — inherits STATE
ZIP-level market 11954
- Home prices YoY
- -0.3%
- Active inventory
- 39
- Price-to-rent
- 6.6×
Monthly cashflow live
- Estimated rent
- $19,019 medium interval (Pro) →
- Mortgage (P&I)
- −$7,866
- Tax est. 1.5%
- −$1,875 /mo · $22,500/yr
- Insurance
- −$625
- HOA
- −$0
- Vacancy / Maint / Mgmt
- −$3,994
- Net cashflow
- $4,659
Break-even live
UW: 25.0% down · 7.5% · 30yr · 1.5% tax · 5.0% vac · 8.0% maint · 8.0% mgmt
Financing live
Cash to close
- Down payment
- $375,000
- Closing costs
- $45,000
- Reserves months
- —
- Total cash needed
- —
Loan-product check · same deal, 3 products live
Conventional
25% down · 7.5% · 30yr
- Down + closing
- —
- Monthly P&I
- —
- Monthly cashflow
- —
- DSCR
- —
- Eligible?
- —
Personal DTI + credit; lowest rate.
DSCR
20% down · 8.5% · 30yr
- Down + closing
- —
- Monthly P&I
- —
- Monthly cashflow
- —
- DSCR
- —
- Eligible?
- —
No personal income docs; deal must DSCR.
Hard money
10% down · 12.0% · 12mo
- Down + closing
- —
- Monthly P&I
- —
- Monthly cashflow
- —
- DSCR
- —
- Eligible?
- —
Short-term bridge; refi at stabilization.
Listing history 2 events
-
2026-06-18remarks 185-char remark
-
2026-06-18$1,500,000 Active 1 DOM
ⓘ Source: listings_history table (triggers on properties + properties_extension) + one-shot
backfill from property_details.listing_events for pre-trigger history.
Climate risk First Street
- Flood 1/10 Low FEMA zone X (unshaded) · 0% chance over 30 yrs
- Wildfire 1/10 Low
- Heat 4/10 Moderate 8 d/yr ≥88°F today · 22 d/yr by 30 yrs out
- Wind 8/10 Severe 80% chance of damaging wind over 30 yrs
- Air quality 2/10 Low 2 unhealthy d/yr today · 2 by 30 yrs out
Nearby sold comps map
Loading sold comps map…
Walkable amenities ~0.75 mi
Loading nearby amenities…
Taxation est. · year 1
- Rental income
- $228,231
- − Mortgage interest
- −$84,023
- − Property taxes
- −$22,500
- − Insurance
- −$7,500
- − Repairs & maintenance
- −$18,259
- − Management
- −$18,259
- − Depreciation
- −$43,636
- Taxable income
- $34,055
- Est. tax owed @ 24.0%
- −$8,173
- After-tax cash flow
- $47,736/yr
For passive investors: Depreciation is non-cash, so a rental often shows a tax loss while cash-flowing — sheltering income. Rental losses are passive: they offset passive income freely, and up to $25,000/yr can offset ordinary (W-2) income if you actively participate and your MAGI is under $100k (phasing out to $0 by $150k); unused losses carry forward. On sale, claimed depreciation is recaptured at up to 25%, and gains may owe capital-gains tax (a 1031 exchange can defer both). Figures are a year-1 estimate at your 24.0% rate — not tax advice; consult a CPA.
Schools (NCES district)
- District
- Montauk Union Free School District
- NCES district ID
- 3619710
- Math proficiency
- 50% ▼ -10.00%
- Reading proficiency
- 60% ▬ 0.00%
- Median HH income
- $73,702
- Composite
- 50.99/100
- National rank
- #3831
- State rank
- #311 of 755 in NY
Livability — Montauk
- Score
- 69/100
- State rank
- #474
- US rank
- #8373
Category grades
Schools grade is shown separately in the Schools card above.
Census & demographics
- Census place
- Montauk, NY
- County
- Suffolk County · 679,920 people
- City population
- 4,223
- Metro
- New York-Newark-Jersey City, NY-NJ-PA
- Population (ZIP)
- 4,223
- Household income
- $142,961
- Rent vs Own
- Severe rent burden
- 20.0
Population outlook (Suffolk County) Hauer SSP2
- Today (2025)
- 1,505,262 people
- By 2030
- 1,498,318 · -0.5%
- By 2040
- 1,471,101 · -2.3%
- By 2050
- 1,424,848 · -5.3%
- By 2075
- 1,337,157 · -11.2%
- By 2100
- 1,217,720 · -19.1%
Race, ethnicity, and origin ACS 2023
- Neighborhood character
- Predominantly White (89%)
- Race & ethnicity
- White 89% Hispanic / Latino 6% Two or more races 4% Black 1%
- Hispanic origin (detail)
- Mexican 2% Dominican 1%
- Common ancestry
- Romanian 4% Scotch-Irish 3% Italian 3%
- Foreign-born
- 10% · Canada, Jamaica
- Languages at home
- 90% English-only · Spanish 4% Russian/Polish/Slavic 4% Other Indo-European 1%
Political lean MEDSL · Suffolk
- 2024 margin
- Lean R (+10.0) · D 45.0% · R 55.0%
- 2008→2024 swing
- -16.0pp toward R · 2008: 6.0pp · 2024: -10.0pp
- All cycles
- 2024: R+10.0 2020: R+0.0 2016: R+8.2 2012: D+2.9 2008: D+6.0
Not yet ingested
- Civics
- —
Market trends
- HPI YoY
- ▼ -1.78%
- Current HPI
- 577.7344
- Rent YoY
- —
- Metro
- New York-Newark-Jersey City, NY-NJ-PA
- State GDP YoY
- ▲ 2.60%
- F500 in state
- 92
Industry mix (Fortune 500 HQ in NY)
| Industry | F500 HQs | Revenue |
|---|---|---|
| Financial Services | 10 | $950B |
|
||
| Consumer Goods | 9 | $162B |
|
||
| Insurance | 4 | $225B |
|
||
| Telecommunications | 2 | $144B |
|
||
| Pharmaceuticals | 2 | $112B |
|
||
| Media / Entertainment | 2 | $69B |
|
||
Price history
-3.2% since first listed2 events — show timeline
- 2026-06-18 Price Changed $1,500,000 OneKey® MLS as Distributed by MLS Grid
- 2026-06-17 Listed $1,550,000 OneKey® MLS as Distributed by MLS Grid
Property tax history
+1.8%/yrLatest (2025): $2,856 · +0.0% YoY. Source: county tax records.
Cash-flow waterfall
monthlySold comps — $/sqft
last 12 mo · ≤1 miLoading sold comps…