20691 Marathona Ct · North Fort Myers, FL
Flood risk 1/10 · Minimal
- FEMA flood zone
- A
- Chance of flooding over 30 yrs
- 0.0%
- Est. flood insurance / yr
- $1,009 – $1,996
Fire risk 8/10 · Major
- Est. fire insurance / yr
- $947 – $1,759
Heat risk 9/10 · Severe
- Hot days now (above 107°F)
- 6 days/yr
- Hot days in 30 yrs
- 25 days/yr
Wind risk 10/10 · Severe
- Chance of severe wind over 30 yrs
- 99.0%
Air-quality risk 2/10 · Minimal
- Unhealthy air days now
- 1 days/yr
- Unhealthy air days in 30 yrs
- 1 days/yr
Risk factors via First Street. Map © Google.
Why this score? — see what drove the C grade
The composite is a weighted blend of 9 inputs, each scored 0–100. Each bar is that input's sub-score; the figure is the points it added to the 100-point composite (weight × sub-score).
- Cash flow +20.8/30.0
- ARV discount +7.5/15.0
- 1% rule +7.3/10.0
- DSCR +6.6/10.0
- Schools +4.1/10.0
- Livability +3.7/5.0
- Rent growth +3.2/5.0
- Condition / age +2.5/5.0
- Appreciation +0.0/10.0
$267,000
🖨 Deal sheet 📄 Offer letter ✓ Due diligence
Listing remarks
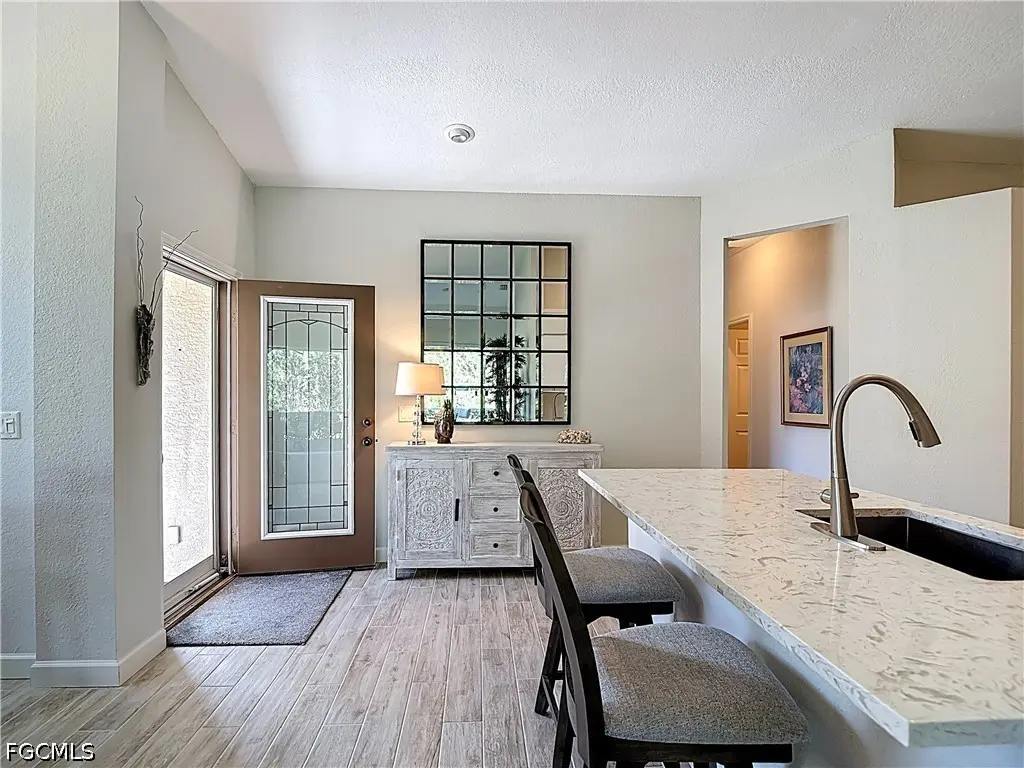
Welcome to Herons Glen Golf & Country Club, a sought-after resident-owned community offering resort-style living in a warm, active setting. With only 26 villas in this area, opportunities to own here are rare. This charming Preserve End-Unit Villa offers 1,100 sq. ft. of living space with 2 bedrooms and a desirable open, airy feel. Step inside through a decorative etched glass front door and immediately notice the high ceilings and abundance of natural light that make this home feel bright and inviting. The updated kitchen features dropped-down quartz countertops, stainless steel appliances, and a functional layout perfect for everyday living and entertaining. Enjoy easy maintenance w
Key facts
- Custom closet system
- High ceilings
- Tile plank flooring
Tags
Property features AI
Finance
- Other: Community size: approximately 1,370 units; Community pool
- Financial info: Pets allowed conditionally (call); maximum 3 pets
- HOA & community: Homeowners association (quarterly fees apply); Association amenities include clubhouse, fitness center, pool, spa/hot tub, tennis and pickleball courts, bocce, shuffleboard, putting greens, golf course and restaurant; Association services cover cable TV, internet, irrigation water, grounds maintenance, road maintenance, sewer, street lights, security and trash; Community features: golf, gated, tennis courts, street lights
Exterior
- Parking: Attached 2-car garage with garage door opener; Assigned parking; Driveway; Paved parking; Two covered spaces
- Security: Gated community with guard and security gate; Security guard; Smoke detectors; Community security included in association
- Utilities: Cable available; High-speed internet available; Underground utilities; Sewer assessment paid; Water assessment paid
- Home design: Single-story; Entry level: 1; Resale property; Faces east; Has a view
- Construction: Block, concrete and stucco construction; Tile roof; Built with standard foundation
- Exterior features: Lanai (screened porch); Porch; Screened porch; Sprinkler/irrigation system (automatic); West exposure; Private road frontage; Private maintained road; Rectangular lot on a cul-de-sac
Interior
- Kitchen: Dishwasher; Freezer; Icemaker; Microwave; Range; Self-cleaning oven; Refrigerator with ice maker; Disposal; Pantry; Kitchen island
- Bedrooms: Primary bedroom on main level; Guest quarters
- Flooring: Tile flooring
- Bathrooms: 2 full bathrooms; Separate shower
- Heating & cooling: Central electric heating; Central electric cooling (central air)
- Interior features: Furnished; Attic with pull-down stairs; Dual sinks; Kitchen island; Open living/dining area; Main-level primary bedroom; Pantry; Separate shower (shower only); Cable TV available; High-speed internet available; Walk-in closets; Split bedroom floorplan; Double-hung windows; Tile flooring
- Laundry & utility: Washer and dryer included; Washer hookup; Dryer hookup; Laundry tub in garage
Neighborhood map
What this means for you Summary
Snapshot
- This is a 2-bed/2.0-bath condo listed at $267k.
Deal economics
- At list price, monthly cash flow is $244 ($3k/yr) — positive.
- The deal already cash-flows at list — no discount required.
- Meets the 1% rule at list price ($3k rent vs $267k).
- Cap rate 8.0% vs local median 3.6% in North Fort Myers — top-decile yield for the area; either an underpriced asset or a hidden risk that comps aren't pricing in. Stress-test before assuming the spread holds.
Location & tenants
- Location reads 74/100 on livability (#269 in FL, #4,409 nationally) — a middle-class / working-renter tenant base. Strengths: cost of living A+, housing A+, health & safety A+; Watch: employment C-, amenities F, commute F.
- Lee (suburban): math 47% / reading 50% proficiency, ranked #42 of 73 in FL (top 58%) — families likely to look elsewhere, expect single-tenant / working-renter base with shorter leases.
- Market conditions: Rents rising (+2.6%/yr); 841 active listings in the ZIP; 9 comparable units currently listed for rent nearby; rentals at typical pace (median 24d on market — plan ~3-4 weeks tenant-placement turnaround); 15,411 units permitted in Lee County in 2024 (4,686 in 5+ unit buildings).
- At $3,275/mo this rent would consume 71% of the median local household income ($55k/yr) (locally 775% of renters already pay >50% of income on rent) — very limited rent-growth headroom before tenants either downsize or default.
Forward outlook
- Local home prices are declining (-3.0%/yr); year-one equity from $2k of loan paydown is wiped out by about $8k of value loss. Plan a longer hold.
- Lee County population projected at +44% by 2050 — long-run rental-demand tailwind backs the buy-and-hold thesis.
Negotiation context
- Only 13 days on market — expect competitive offers; lowballing is unlikely to land.
- 2 sale attempts since 20y ago with the ask held roughly flat each time — persistent listings suggest the price (not the market) is what's stuck; bring a comps-based counter.
- Current owner paid $180k; 48% above their basis — modest negotiation headroom, anchor on the comps not their cost.
Risks & watch-outs
- Watch-outs: flood insurance adds $125/mo.
- Climate carrying-cost: in FEMA flood zone A (mandatory federal flood insurance); severe wind risk, 99% chance of damaging wind over 30y; severe wildfire risk; extreme-heat days projected 6→25/yr by 2055 (HVAC capex compounding) — expect insurance premiums to compound above CPI over the hold.
Questions for the listing agent
- What's the actual annual flood-insurance premium (NFIP or private), and is the property in a SFHA with mandatory coverage?
- What does the HOA fee cover, when was the last increase, and are there any pending special assessments or reserve-fund shortfalls?
- Any open or pending special assessments — roof, HVAC, plumbing, elevator, façade? What's the per-unit balance and payoff schedule, and is the seller paying it off at close or rolling it to the buyer?
- Is there a deadline driving the sale (1031 exchange, divorce, estate, relocation)? That informs how much negotiation room exists.
- What's the average days-on-market for RENTAL listings here right now (not sales)? A rising rental-DOM trend means longer vacancies and softer asking-rent achievability than the comps imply.
- What's the recent tenant-quality profile in this submarket — average credit score on applications, eviction rate, late-payment / NSF rate, and stable-employment percentage? A property-management company in the area should have these aggregated.
- How much new apartment / multifamily construction is in the pipeline within 1–3 miles? Heavy new supply (>2% of stock underway) typically softens rents 12–24 months out; light construction supports rent growth.
Investment metrics
- 1% rule
- 1.23% ✓
- Cap rate
- 7.95%
- Cash-on-cash
- 5.92%
- DSCR
- 1.26
- GRM
- 6.8
CMA / ARV
No comps found within radius.
Projected returns pro-forma
-3.0% appreciation · 2.63% rent growth · sell at horizon
- IRR
- -10.5%
- Equity multiple
- 0.62×
- Total profit
- $-28,614
- Equity at exit
- $39,811
- IRR
- -1.7%
- Equity multiple
- 0.89×
- Total profit
- $-8,447
- Equity at exit
- $23,085
Cash invested: $74,760 (down + closing). Projections, not guarantees.
Landlord ↔ Tenant lean methodology
- Overall (STATE)
- 87 Strongly Landlord-Friendly
- State Florida
- 87 Strongly Landlord-Friendly · R+3
- County
- — inherits STATE
- City
- — inherits STATE
ZIP-level market 33917
- Home prices YoY
- -30.2%
- Rents YoY
- 2.6%
- Active inventory
- 841
- Price-to-rent
- 6.8×
Monthly cashflow live
- Estimated rent
- $3,275 high interval (Pro) →
- Mortgage (P&I)
- −$1,400
- Tax from tax record
- −$366 /mo · $4,392/yr
- Insurance
- −$111
- Flood insurance flood zone
- −$125 /mo · $1,502/yr
- HOA
- −$341
- Vacancy / Maint / Mgmt
- −$688
- Net cashflow
- $244
Break-even live
UW: 25.0% down · 7.5% · 30yr · 1.5% tax · 5.0% vac · 8.0% maint · 8.0% mgmt
Financing live
Cash to close
- Down payment
- $66,750
- Closing costs
- $8,010
- Reserves months
- —
- Total cash needed
- —
Loan-product check · same deal, 3 products live
Conventional
25% down · 7.5% · 30yr
- Down + closing
- —
- Monthly P&I
- —
- Monthly cashflow
- —
- DSCR
- —
- Eligible?
- —
Personal DTI + credit; lowest rate.
DSCR
20% down · 8.5% · 30yr
- Down + closing
- —
- Monthly P&I
- —
- Monthly cashflow
- —
- DSCR
- —
- Eligible?
- —
No personal income docs; deal must DSCR.
Hard money
10% down · 12.0% · 12mo
- Down + closing
- —
- Monthly P&I
- —
- Monthly cashflow
- —
- DSCR
- —
- Eligible?
- —
Short-term bridge; refi at stabilization.
Rent comps 9 comps
| Address | Beds | Baths | Sqft | Rent | $/sqft | DOM | Units | Dist |
|---|---|---|---|---|---|---|---|---|
| 2481 Palo Duro Blvd North Fort Myers, FL | 3.0 | 2.0 | 1450 | $4,000 | $2.76 | 21d | 1 | 0.19mi |
| 2481 Palo Duro Blvd North Fort Myers, FL | 3.0 | 2.0 | 1450 | $4,000 | $2.76 | 15d | 1 | 0.19mi |
| 2130 Rio Nuevo Dr Unit 1546442P North Fort Myers, FL | 2.0 | 2.0 | 1248 | $4,682 | $3.75 | 14d | 1 | 0.51mi |
| 2300 Valparaiso Blvd North Fort Myers, FL | 2.0 | 2.0 | 1237 | $4,000 | $3.23 | 23d | 1 | 0.52mi |
| 2300 Valparaiso Blvd North Fort Myers, FL | 2.0 | 2.0 | 1237 | $3,000 | $2.43 | 15d | 1 | 0.52mi |
| 1900 Corona del Sire Dr North Fort Myers, FL | 2.0 | 2.0 | 1449 | $2,400 | $1.66 | 23d | 1 | 0.75mi |
| 20919 Villareal Way North Fort Myers, FL | 2.0 | 2.0 | 1428 | $4,000 | $2.80 | 23d | 1 | 0.88mi |
| 10401 Circle Pine Rd North Fort Myers, FL | 2.0 | 2.0 | 1294 | $3,000 | $2.32 | 23d | 1 | 1.29mi |
| 19621 N Tamiami Trl North Fort Myers, FL | 3.0 | 2.0 | 1205 | $1,300 | $1.08 | 23d | 1 | 1.30mi |
HOA detail condo
- Monthly dues
- $341 · $4,092/yr
- Assessments
- None detected in remarks — confirm with the listing agent.
Listing history 4 events
-
2026-05-04status Pending
-
2026-04-21$267,000 Active
-
2006-06-29soldstatus $179,900
-
2006-01-10$199,900
ⓘ Source: listings_history table (triggers on properties + properties_extension) + one-shot
backfill from property_details.listing_events for pre-trigger history.
Tax reassessment forecast FL · Resets to sale price
- Current annual tax
- $4,392 · $366/mo
- Projected year-2 tax
- $4,392 · $366/mo
- Expected delta
- $0/yr ($0/mo · 0.0%)
ⓘ Screening estimate from a state-policy table — verify with the county assessor before closing.
Climate risk First Street
- Flood 1/10 Low FEMA zone A · 0% chance over 30 yrs
- Wildfire 8/10 Severe
- Heat 9/10 Extreme 6 d/yr ≥107°F today · 25 d/yr by 30 yrs out
- Wind 10/10 Extreme 99% chance of damaging wind over 30 yrs
- Air quality 2/10 Low 1 unhealthy d/yr today · 1 by 30 yrs out
Nearby sold comps map
Loading sold comps map…
Walkable amenities ~0.75 mi
Loading nearby amenities…
Taxation est. · year 1
- Rental income
- $39,298
- − Mortgage interest
- −$14,956
- − Property taxes
- −$4,392
- − Insurance
- −$2,838
- − Repairs & maintenance
- −$3,144
- − Management
- −$3,144
- − HOA
- −$4,092
- − Depreciation
- −$7,767
- Taxable loss
- −$1,034
- Est. tax savings @ 24.0%
- +$248
- After-tax cash flow
- $3,170/yr
For passive investors: Depreciation is non-cash, so a rental often shows a tax loss while cash-flowing — sheltering income. Rental losses are passive: they offset passive income freely, and up to $25,000/yr can offset ordinary (W-2) income if you actively participate and your MAGI is under $100k (phasing out to $0 by $150k); unused losses carry forward. On sale, claimed depreciation is recaptured at up to 25%, and gains may owe capital-gains tax (a 1031 exchange can defer both). Figures are a year-1 estimate at your 24.0% rate — not tax advice; consult a CPA.
Schools (NCES district)
- District
- Lee
- NCES district ID
- 1201080
- Math proficiency
- 47% ▼ -11.00%
- Reading proficiency
- 50% ▼ -4.00%
- Median HH income
- $49,518
- Composite
- 41.49/100
- National rank
- #3458
- State rank
- #42 of 73 in FL
Livability — North Fort Myers
- Score
- 74/100
- State rank
- #269
- US rank
- #4409
Category grades
Schools grade is shown separately in the Schools card above.
Census & demographics
- Census place
- North Fort Myers, FL
- County
- Lee County · 788,662 people
- City population
- 57,035
- Metro
- Cape Coral-Fort Myers, FL
- Population (ZIP)
- 33,380
- Household income
- $55,000
- Rent vs Own
- Severe rent burden
- 775.0
Population outlook (Lee County) Hauer SSP2
- Today (2025)
- 871,946 people
- By 2030
- 955,468 · +9.6%
- By 2040
- 1,113,587 · +27.7%
- By 2050
- 1,256,891 · +44.1%
- By 2075
- 1,560,270 · +78.9%
- By 2100
- 1,726,848 · +98.0%
Race, ethnicity, and origin ACS 2023
- Neighborhood character
- Predominantly White (85%)
- Race & ethnicity
- White 85% Hispanic / Latino 10% Two or more races 7% Asian 1% Black 1%
- Hispanic origin (detail)
- Mexican 2% Puerto Rican 1% Cuban 3%
- Common ancestry
- Lithuanian 3% Romanian 3% Slovak 2%
- Foreign-born
- 10% · Canada
- Languages at home
- 88% English-only · Spanish 9% Other Indo-European 1% Russian/Polish/Slavic 1%
Political lean MEDSL · Lee
- 2024 margin
- Strong R (+28.4) · D 35.5% · R 63.9%
- 2008→2024 swing
- -18.0pp toward R · 2008: -10.4pp · 2024: -28.4pp
- All cycles
- 2024: R+28.4 2020: R+19.2 2016: R+20.4 2012: R+16.6 2008: R+10.4
Not yet ingested
- Civics
- —
Market trends
- HPI YoY
- ▼ -122.28%
- Current HPI
- 282.2895
- Rent YoY
- ▲ 2.63%
- Metro
- Cape Coral-Fort Myers, FL
- State GDP YoY
- ▲ 3.28%
- F500 in state
- 36
Industry mix (Fortune 500 HQ in FL)
| Industry | F500 HQs | Revenue |
|---|---|---|
| Industrial Technology | 2 | $29B |
|
||
| Insurance | 2 | $17B |
|
||
| Retail | 1 | $60B |
|
||
| Technology Distribution | 1 | $58B |
|
||
| Homebuilding | 1 | $35B |
|
||
| Technology Manufacturing | 1 | $35B |
|
||
Price history
+33.6% since first listed4 events — show timeline
- 2026-05-04 Pending — FORTMLS
- 2026-04-21 Listed $267,000 FORTMLS
- 2006-06-29 Sold (Public Records) $179,900 Public Records
- 2006-01-10 Listed $199,900 FORTMLS
Property tax history
+3.8%/yrLatest (2025): $4,392 · +0.4% YoY. Source: county tax records.
Cash-flow waterfall
monthlySold comps — $/sqft
last 12 mo · ≤1 miLoading sold comps…