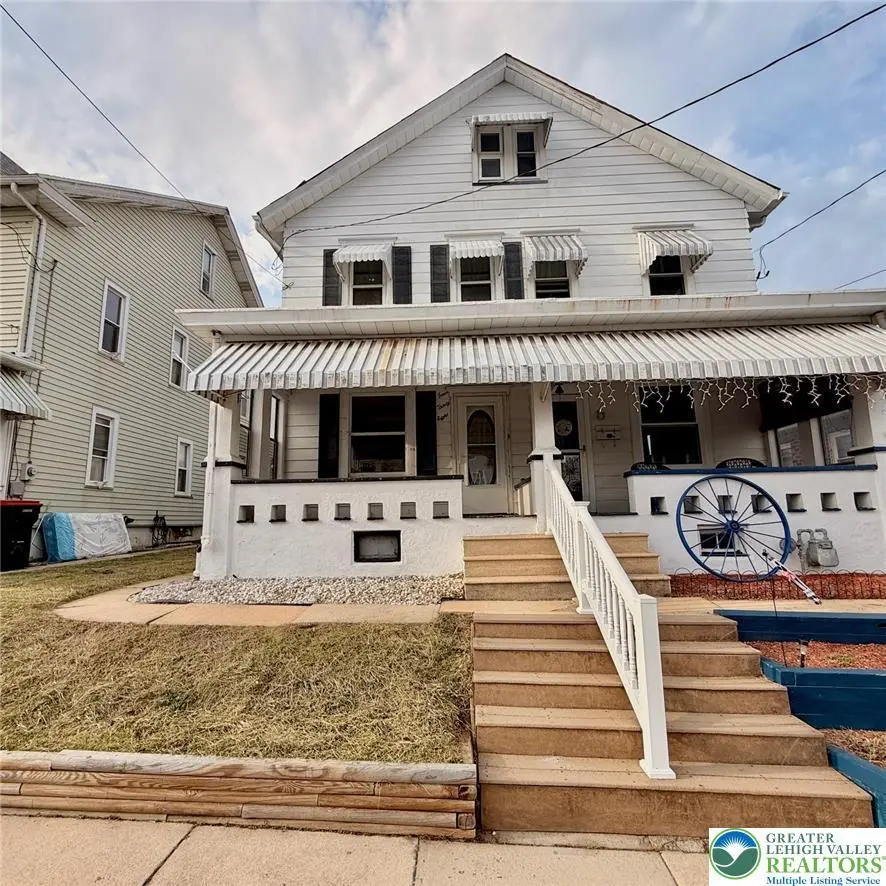
438 Coal St · Lehighton, PA
Flood risk 1/10 · Minimal
- FEMA flood zone
- X (unshaded)
- Chance of flooding over 30 yrs
- 0.0%
- Est. flood insurance / yr
- $507 – $1,088
Fire risk 1/10 · Minimal
- Est. fire insurance / yr
- $511 – $949
Heat risk 4/10 · Minor
- Hot days now (above 98°F)
- 7 days/yr
- Hot days in 30 yrs
- 16 days/yr
Wind risk 4/10 · Minor
- Chance of severe wind over 30 yrs
- 9.0%
Air-quality risk 2/10 · Minimal
- Unhealthy air days now
- 1 days/yr
- Unhealthy air days in 30 yrs
- 2 days/yr
Risk factors via First Street. Map © Google.
Why this score? — see what drove the C+ grade
The composite is a weighted blend of 9 inputs, each scored 0–100. Each bar is that input's sub-score; the figure is the points it added to the 100-point composite (weight × sub-score).
- Cash flow +21.5/30.0
- ARV discount +13.7/15.0
- DSCR +6.9/10.0
- 1% rule +6.0/10.0
- Livability +3.9/5.0
- Schools +3.5/10.0
- Rent growth +2.5/5.0
- Condition / age +2.5/5.0
- Appreciation +0.0/10.0
$140,000
🖨 Deal sheet 📄 Offer letter ✓ Due diligence
Listing remarks MLS
Welcome to 438 Coal Street in Lehighton—a charming semi-detached home offering comfort, convenience, and small-town appeal. This 3-bedroom, 1-bathroom property is ideal for anyone seeking a cozy residence in an established in-town neighborhood. Inside, you’ll find a functional layout with ample natural light and comfortable living spaces. Step outside to enjoy the rear deck—perfect for relaxing or entertaining—overlooking a private yard that offers space for gardening, play, or pets. A detached one-car garage provides added storage and off-street parking convenience. Situated in a well-established neighborhood, this home offers easy access to local amenities, schools, and parks, making it a great opportunity for homeowners or investors alike. Don’t miss your chance to own a property with both charm and potential in the heart of Lehighton.
Key facts
- Garage
- Built 1912
- Listed 50 days
Neighborhood map
What this means for you Summary
Snapshot
- This is a 3-bed/1.0-bath townhouse listed at $140k.
Deal economics
- At list price, monthly cash flow is $211 ($3k/yr) — positive.
- The deal already cash-flows at list — no discount required.
- Meets the 1% rule at list price ($2k rent vs $140k).
- Recommended offer: $136k (3.0% below list) — sets the bar for market timing.
- Cap rate 8.1% vs local median 4.7% in Lehighton — top-decile yield for the area; either an underpriced asset or a hidden risk that comps aren't pricing in. Stress-test before assuming the spread holds.
Location & tenants
- Location reads 77/100 on livability (#321 in PA, #2,848 nationally) — a middle-class / working-renter tenant base. Strengths: cost of living A+, health & safety A+, crime A-; Watch: employment D, commute F.
- Lehighton Area SD (suburban): math 32% / reading 50% proficiency, ranked #336 of 539 in PA (top 62%) — families likely to look elsewhere, expect single-tenant / working-renter base with shorter leases.
- Market conditions: 139 active listings in the ZIP; 4 comparable units currently listed for rent nearby; rentals leasing fast (median 3d on market — plan ~1-2 weeks tenant-placement turnaround); 180 units permitted in Carbon County in 2024 (10 in 5+ unit buildings).
Forward outlook
- Local home prices are declining (-3.0%/yr); year-one equity from $968 of loan paydown is wiped out by about $4k of value loss. Plan a longer hold.
- Carbon County population projected at -18% by 2050 — secular population decline; favor cash flow + early exit over multi-decade hold.
Negotiation context
- It's been on market 50 days — a 3% lower offer ($136k) is reasonable based on typical stale-listing flexibility.
- Current owner paid $90k; list at $140k implies a 56% gain — meaningful room to come down on a strong offer.
Risks & watch-outs
- Watch-outs: built in 1912 — expect roof / HVAC / electrical / plumbing capex.
Questions for the listing agent
- It's been on market 50 days. Have you received any prior offers? Is the seller open to a 3% concession, seller financing, or rate buy-down credit?
- Built in 1912 — when were the roof, HVAC, electrical panel, plumbing, and water heater last replaced?
- Is there a deadline driving the sale (1031 exchange, divorce, estate, relocation)? That informs how much negotiation room exists.
- What's the average days-on-market for RENTAL listings here right now (not sales)? A rising rental-DOM trend means longer vacancies and softer asking-rent achievability than the comps imply.
- What's the recent tenant-quality profile in this submarket — average credit score on applications, eviction rate, late-payment / NSF rate, and stable-employment percentage? A property-management company in the area should have these aggregated.
- How much new for-sale + rental construction is in the pipeline within 1–3 miles? Heavy new supply typically softens prices + rents 12–24 months out; constrained supply supports both.
Investment metrics
- 1% rule
- 1.10% ✓
- Cap rate
- 8.10%
- Cash-on-cash
- 6.45%
- DSCR
- 1.29
- GRM
- 7.6
CMA / ARV
- ARV (median comp)
- $162,249
- List price
- $140,000
- Delta
- -13.71%
- Verdict
- UNDERPRICED
- Comps
- 20 within 1.0 mi
Show comp detail 12 sales within ~0.75 mi
| Address | Dist | Beds/Ba | Sqft | Sold | Price | $/sf | Match |
|---|---|---|---|---|---|---|---|
| 215 N 4th St | 0.12mi | 3/1.5 | 1,416 (+3%) | 6mo | $133,000 | $94 | 82 |
| 208 N Third St | 0.17mi | 3/2.0 | 1,400 (+2%) | 11mo | $205,000 | $146 | 76 |
| 336 N 5th St | 0.06mi | 3/1.5 | 1,288 (-6%) | 12mo | $175,000 | $136 | 74 |
| 234 Carbon St | 0.30mi | 3/1.0 | 1,420 (+3%) | 13mo | $169,000 | $119 | 70 |
| 339 N 2nd St | 0.26mi | 2/1.0 (-1) | 1,273 (-8%) | 2mo | $128,000 | $101 | 69 |
| 522 Iron St | 0.39mi | 3/1.5 | 1,322 (-4%) | 6mo | $200,000 | $151 | 68 |
| 230 Carbon St | 0.31mi | 4/2.0 (+1) | 1,431 (+4%) | 5mo | $225,000 | $157 | 66 |
| 238 S 2nd St | 0.51mi | 4/1.0 (+1) | 1,368 (-1%) | 9mo | $180,000 | $132 | 62 |
| 223 N 3rd St | 0.19mi | 3/2.0 | 1,535 (+12%) | 8mo | $215,000 | $140 | 61 |
| 236 S 2nd St | 0.51mi | 4/2.0 (+1) | 1,368 (-1%) | 6mo | $115,000 | $84 | 61 |
| 337 N 3rd St | 0.18mi | 2/1.0 (-1) | 1,182 (-14%) | 14mo | $150,000 | $127 | 51 |
| 118 Bridge St | 0.70mi | 3/1.5 | 1,308 (-5%) | 11mo | $105,000 | $80 | 47 |
Match score weights: distance 35% · size 25% · config 20% · recency 20%. Top-matched comps best support the ARV.
Projected returns pro-forma
-3.0% appreciation · 3.0% rent growth · sell at horizon
- IRR
- -6.3%
- Equity multiple
- 0.76×
- Total profit
- $-9,229
- Equity at exit
- $20,874
- IRR
- 3.3%
- Equity multiple
- 1.24×
- Total profit
- $9,422
- Equity at exit
- $12,105
Cash invested: $39,200 (down + closing). Projections, not guarantees.
Landlord ↔ Tenant lean methodology
- Overall (STATE)
- 62 Landlord-Friendly
- State Pennsylvania
- 62 Landlord-Friendly · EVEN
- County
- — inherits STATE
- City
- — inherits STATE
ZIP-level market 18235
- Home prices YoY
- -27.1%
- Active inventory
- 139
- Price-to-rent
- 7.6×
Monthly cashflow live
- Estimated rent
- $1,540 medium interval (Pro) →
- Mortgage (P&I)
- −$734
- Tax from tax record
- −$214 /mo · $2,567/yr
- Insurance
- −$58
- HOA
- −$0
- Vacancy / Maint / Mgmt
- −$323
- Net cashflow
- $211
Break-even live
UW: 25.0% down · 7.5% · 30yr · 1.5% tax · 5.0% vac · 8.0% maint · 8.0% mgmt
Financing live
Cash to close
- Down payment
- $35,000
- Closing costs
- $4,200
- Reserves months
- —
- Total cash needed
- —
Loan-product check · same deal, 3 products live
Conventional
25% down · 7.5% · 30yr
- Down + closing
- —
- Monthly P&I
- —
- Monthly cashflow
- —
- DSCR
- —
- Eligible?
- —
Personal DTI + credit; lowest rate.
DSCR
20% down · 8.5% · 30yr
- Down + closing
- —
- Monthly P&I
- —
- Monthly cashflow
- —
- DSCR
- —
- Eligible?
- —
No personal income docs; deal must DSCR.
Hard money
10% down · 12.0% · 12mo
- Down + closing
- —
- Monthly P&I
- —
- Monthly cashflow
- —
- DSCR
- —
- Eligible?
- —
Short-term bridge; refi at stabilization.
Rent comps 4 comps
| Address | Beds | Baths | Sqft | Rent | $/sqft | DOM | Units | Dist |
|---|---|---|---|---|---|---|---|---|
| 204 N 2nd St Lehighton, PA | 3.0 | 1.0 | 1000 | $1,600 | $1.60 | 2d | 1 | 0.22mi |
| 339 N 2nd St Lehighton, PA | 3.0 | 1.0 | 1073 | $1,700 | $1.58 | 2d | 1 | 0.24mi |
| 206 N 2nd St Lehighton, PA | 3.0 | 1.0 | 1000 | $1,450 | $1.45 | 2d | 1 | 0.25mi |
| 318 Bridge St Unit A Weissport, PA | 2.0 | 1.0 | 900 | $975 | $1.08 | 2d | 1 | 0.80mi |
Listing history 7 events
-
2026-06-02status $140,000 Pending 50 DOM
-
2026-06-01days on market $140,000 Active 50 DOM
-
2026-05-31days on market $140,000 Active 49 DOM
-
2026-05-31days on market $140,000 Active 48 DOM
-
2026-05-14price $140,000 880-char remark
Show marketing remark (880 chars)
Welcome to 438 Coal Street in Lehighton—a charming semi-detached home offering comfort, convenience, and small-town appeal. This 3-bedroom, 1-bathroom property is ideal for anyone seeking a cozy residence in an established in-town neighborhood. Inside, you’ll find a functional layout with ample natural light and comfortable living spaces. Step outside to enjoy the rear deck—perfect for relaxing or entertaining—overlooking a private yard that offers space for gardening, play, or pets. A detached one-car garage provides added storage and off-street parking convenience. Situated in a well-established neighborhood, this home offers easy access to local amenities, schools, and parks, making it a great opportunity for homeowners or investors alike. Don’t miss your chance to own a property with both charm and potential in the heart of Lehighton.
-
2026-04-10$150,000 Active 880-char remark
Show marketing remark (880 chars)
Welcome to 438 Coal Street in Lehighton—a charming semi-detached home offering comfort, convenience, and small-town appeal. This 3-bedroom, 1-bathroom property is ideal for anyone seeking a cozy residence in an established in-town neighborhood. Inside, you’ll find a functional layout with ample natural light and comfortable living spaces. Step outside to enjoy the rear deck—perfect for relaxing or entertaining—overlooking a private yard that offers space for gardening, play, or pets. A detached one-car garage provides added storage and off-street parking convenience. Situated in a well-established neighborhood, this home offers easy access to local amenities, schools, and parks, making it a great opportunity for homeowners or investors alike. Don’t miss your chance to own a property with both charm and potential in the heart of Lehighton.
-
2005-11-03soldstatus $90,000
ⓘ Source: listings_history table (triggers on properties + properties_extension) + one-shot
backfill from property_details.listing_events for pre-trigger history.
Tax reassessment forecast PA · Partial reset (capped growth)
- Current annual tax
- $2,567 · $214/mo
- Projected year-2 tax
- $2,567 · $214/mo
- Expected delta
- $0/yr ($0/mo · 0.0%)
ⓘ Screening estimate from a state-policy table — verify with the county assessor before closing.
Climate risk First Street
- Flood 1/10 Low FEMA zone X (unshaded) · 0% chance over 30 yrs
- Wildfire 1/10 Low
- Heat 4/10 Moderate 7 d/yr ≥98°F today · 16 d/yr by 30 yrs out
- Wind 4/10 Moderate 9% chance of damaging wind over 30 yrs
- Air quality 2/10 Low 1 unhealthy d/yr today · 2 by 30 yrs out
Nearby sold comps map
Loading sold comps map…
Walkable amenities ~0.75 mi
Loading nearby amenities…
Taxation est. · year 1
- Rental income
- $18,485
- − Mortgage interest
- −$7,842
- − Property taxes
- −$2,567
- − Insurance
- −$700
- − Repairs & maintenance
- −$1,479
- − Management
- −$1,479
- − Depreciation
- −$4,073
- Taxable income
- $346
- Est. tax owed @ 24.0%
- −$83
- After-tax cash flow
- $2,443/yr
For passive investors: Depreciation is non-cash, so a rental often shows a tax loss while cash-flowing — sheltering income. Rental losses are passive: they offset passive income freely, and up to $25,000/yr can offset ordinary (W-2) income if you actively participate and your MAGI is under $100k (phasing out to $0 by $150k); unused losses carry forward. On sale, claimed depreciation is recaptured at up to 25%, and gains may owe capital-gains tax (a 1031 exchange can defer both). Figures are a year-1 estimate at your 24.0% rate — not tax advice; consult a CPA.
Schools (NCES district)
- District
- Lehighton Area SD
- NCES district ID
- 4213500
- Math proficiency
- 32% ▼ -7.00%
- Reading proficiency
- 50% ▼ -11.00%
- Median HH income
- $51,115
- Composite
- 35.36/100
- National rank
- #4958
- State rank
- #336 of 539 in PA
Livability — Lehighton
- Score
- 77/100
- State rank
- #321
- US rank
- #2848
Category grades
Schools grade is shown separately in the Schools card above.
Census & demographics
- Census place
- Lehighton, PA
- Population (ZIP)
- 19,121
Population outlook (Carbon County) Hauer SSP2
- Today (2025)
- 61,643 people
- By 2030
- 59,840 · -2.9%
- By 2040
- 55,413 · -10.1%
- By 2050
- 50,843 · -17.5%
- By 2075
- 43,326 · -29.7%
- By 2100
- 37,126 · -39.8%
Race, ethnicity, and origin ACS 2023
- Neighborhood character
- Predominantly White (94%)
- Race & ethnicity
- White 94% Two or more races 4% Hispanic / Latino 3%
- Common ancestry
- Romanian 6% Polish 5% Iranian 3%
- Foreign-born
- 2% · Canada, China
- Languages at home
- 96% English-only · Spanish 2% Russian/Polish/Slavic 1%
Political lean MEDSL · Carbon
- 2024 margin
- Solid R (+34.8) · D 32.2% · R 67.0%
- 2008→2024 swing
- -36.7pp toward R · 2008: 1.9pp · 2024: -34.8pp
- All cycles
- 2024: R+34.8 2020: R+32.0 2016: R+34.1 2012: R+6.9 2008: D+1.9
Not yet ingested
- Civics
- —
Market trends
- HPI YoY
- ▼ -69.77%
- Current HPI
- 187.4645
- Rent YoY
- —
- Metro
- —
- State GDP YoY
- ▲ 1.68%
- F500 in state
- 34
Industry mix (Fortune 500 HQ in PA)
| Industry | F500 HQs | Revenue |
|---|---|---|
| Healthcare | 2 | $309B |
|
||
| Insurance | 2 | $27B |
|
||
| Telecommunications / Media | 1 | $124B |
|
||
| Industrial Distribution | 1 | $22B |
|
||
| Financial Services | 1 | $20B |
|
||
| Chemicals / Materials | 1 | $18B |
|
||
Price history
+55.6% since first listed3 events — show timeline
- 2026-05-14 Price Changed $140,000 GLVRMLS
- 2026-04-10 Listed $150,000 GLVRMLS
- 2005-11-03 Sold (Public Records) $90,000 Public Records
Property tax history
+2.0%/yrLatest (2026): $2,567 · +2.3% YoY. Source: county tax records.
Cash-flow waterfall
monthlySold comps — $/sqft
last 12 mo · ≤1 miLoading sold comps…