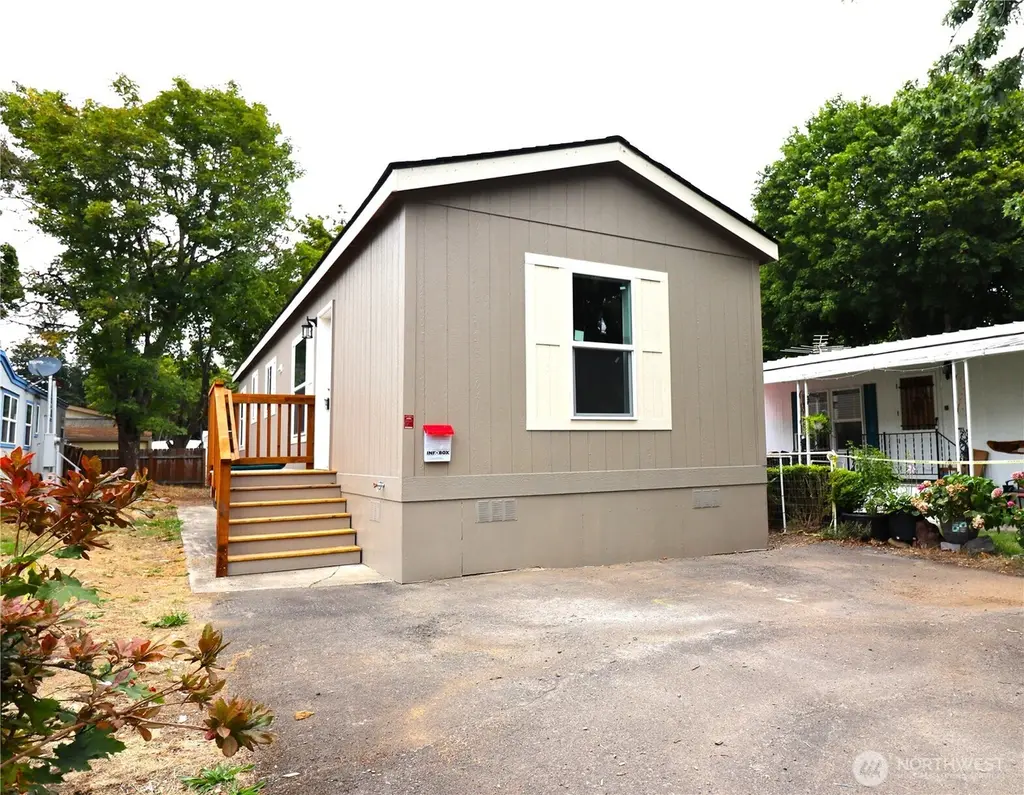
3909 E 4th Plain Blvd #47 · Vancouver, WA
Flood risk No data
- FEMA flood zone
- —
- Chance of flooding over 30 yrs
- —
- Est. flood insurance / yr
- —
Fire risk No data
- Est. fire insurance / yr
- —
Heat risk No data
- Hot days now (above threshold)
- —
- Hot days in 30 yrs
- —
Wind risk No data
- Chance of severe wind over 30 yrs
- —
Air-quality risk No data
- Unhealthy air days now
- —
- Unhealthy air days in 30 yrs
- —
Risk factors via First Street. Map © Google.
Why this score? — see what drove the B- grade
The composite is a weighted blend of 9 inputs, each scored 0–100. Each bar is that input's sub-score; the figure is the points it added to the 100-point composite (weight × sub-score).
- Cash flow +30.0/30.0
- 1% rule +10.0/10.0
- DSCR +10.0/10.0
- Schools +4.3/10.0
- Livability +4.1/5.0
- Condition / age +4.0/5.0
- Rent growth +3.0/5.0
- ARV discount +0.0/15.0
- Appreciation +0.0/10.0
$99,975
🖨 Deal sheet 📄 Offer letter ✓ Due diligence
Listing remarks
Buyer Bonus: 3-months lot rent included! New Singlewide for sale at Totem Pole Mobile Estates (55+). 2 bed / 1 bath / 750 Square feet. Be the first to live in this beautiful home. Enjoy a kitchen with plenty of storage and an island countertop, W/ D hookups, and off-street parking. Totem Pole Mobile Estates is conveniently located and close to everything Vancouver has to offer. Come make it yours!
Key facts
- Island countertop
- Conveniently located
- Built 2024
Tags
Neighborhood map
What this means for you Summary
Snapshot
- This is a 2-bed/1.0-bath manufactured listed at $100k. Condition is rated good.
Deal economics
- At list price, monthly cash flow is $607 ($7k/yr) — positive.
- The deal already cash-flows at list — no discount required.
- Meets the 1% rule at list price ($2k rent vs $100k).
- Recommended offer: $88k (12.0% below list) — sets the bar for market timing.
- Cap rate 13.6% vs local median 2.7% in Vancouver — top-decile yield for the area; either an underpriced asset or a hidden risk that comps aren't pricing in. Stress-test before assuming the spread holds.
Location & tenants
- Location reads 82/100 on livability (#62 in WA, #1,133 nationally) — a professional / high-income tenant draw. Strengths: amenities A+, commute A+, housing A+; Watch: crime F, cost of living D-.
- Vancouver School District (suburban): math 43% / reading 53% proficiency, ranked #156 of 291 in WA (top 54%) — families likely to look elsewhere, expect single-tenant / working-renter base with shorter leases.
- Market conditions: Rents rising (+2.0%/yr); 266 active listings in the ZIP; 40 comparable units currently listed for rent nearby; rentals at typical pace (median 18d on market — plan ~3-4 weeks tenant-placement turnaround); solid renter incomes; 3,547 units permitted in Clark County in 2024 (1,361 in 5+ unit buildings).
Forward outlook
- Local home prices are declining (-3.0%/yr); year-one equity from $691 of loan paydown is wiped out by about $3k of value loss. Plan a longer hold.
- Clark County population projected at +29% by 2050 — long-run rental-demand tailwind backs the buy-and-hold thesis.
- At projected returns (-3.0% appreciation + 2.0% rent growth), your $28k cash investment doubles in ~5 years — after that, you're playing with house money.
Negotiation context
- It's been on market 331 days — a 12% lower offer ($88k) is reasonable based on typical stale-listing flexibility.
Questions for the listing agent
- It's been on market 331 days. Have you received any prior offers? Is the seller open to a 12% concession, seller financing, or rate buy-down credit?
- Why hasn't it sold? Are there any deal-killer items the seller is aware of (foundation, flood, title, zoning, code violations)?
- Is there a deadline driving the sale (1031 exchange, divorce, estate, relocation)? That informs how much negotiation room exists.
- Crime grade is F in this area — have there been break-ins, vandalism, or insurance claims at this property in the last 3 years? What carrier currently insures it and at what premium?
- What's the average days-on-market for RENTAL listings here right now (not sales)? A rising rental-DOM trend means longer vacancies and softer asking-rent achievability than the comps imply.
- What's the recent tenant-quality profile in this submarket — average credit score on applications, eviction rate, late-payment / NSF rate, and stable-employment percentage? A property-management company in the area should have these aggregated.
- How much new for-sale + rental construction is in the pipeline within 1–3 miles? Heavy new supply typically softens prices + rents 12–24 months out; constrained supply supports both.
Investment metrics
- 1% rule
- 1.58% ✓
- Cap rate
- 13.58%
- Cash-on-cash
- 26.01%
- DSCR
- 2.16
- GRM
- 5.3
CMA / ARV
- ARV (median comp)
- $73,297
- List price
- $99,975
- Delta
- 36.40%
- Verdict
- OVERPRICED
- Comps
- 3 within 1.0 mi
Show comp detail 7 sales within ~0.75 mi
| Address | Dist | Beds/Ba | Sqft | Sold | Price | $/sf | Match |
|---|---|---|---|---|---|---|---|
| 3921 E 4th Plain Blvd #54 | 0.06mi | 2/1.0 | 784 (0%) | 7mo | $58,000 | $74 | 91 |
| 3921 E Fourth Plain Blvd | 0.06mi | 2/1.0 | 840 (+7%) | 6mo | $73,000 | $87 | 80 |
| 3921 E 4th Plain Blvd #37 | 0.06mi | 2/1.0 | 784 (0%) | 23mo | $75,000 | $96 | 78 |
| 3909 E Fourth Plain Blvd #68 | 0.00mi | 2/2.0 | 840 (+7%) | 9mo | $82,000 | $98 | 77 |
| 3921 E Fourth Plain Blvd #41 | 0.06mi | 2/1.0 | 832 (+6%) | 16mo | $104,900 | $126 | 74 |
| 3921 E Fourth Plain Blvd #72 | 0.06mi | 2/1.0 | 880 (+12%) | 20mo | $77,500 | $88 | 60 |
| 3921 E Fourth Plain Blvd #3 | 0.06mi | 2/1.0 | 676 (-14%) | 19mo | $65,000 | $96 | 58 |
Match score weights: distance 35% · size 25% · config 20% · recency 20%. Top-matched comps best support the ARV.
Projected returns pro-forma
-3.0% appreciation · 2.05% rent growth · sell at horizon
- IRR
- 18.7%
- Equity multiple
- 1.75×
- Total profit
- $20,941
- Equity at exit
- $14,907
- IRR
- 26.4%
- Equity multiple
- 3.21×
- Total profit
- $61,949
- Equity at exit
- $8,644
Cash invested: $27,993 (down + closing). Projections, not guarantees.
Landlord ↔ Tenant lean methodology
- Overall (STATE)
- 28 Tenant-Leaning
- State Washington
- 28 Tenant-Leaning · D+8
- County
- — inherits STATE
- City
- — inherits STATE
ZIP-level market 98661
- Rents YoY
- 2.0%
- Active inventory
- 266
- Price-to-rent
- 5.3×
Monthly cashflow live
- Estimated rent
- $1,578 high interval (Pro) →
- Mortgage (P&I)
- −$524
- Tax from tax record
- −$74 /mo · $891/yr
- Insurance
- −$42
- HOA
- −$0
- Vacancy / Maint / Mgmt
- −$331
- Net cashflow
- $607
Break-even live
UW: 25.0% down · 7.5% · 30yr · 1.5% tax · 5.0% vac · 8.0% maint · 8.0% mgmt
Financing live
Cash to close
- Down payment
- $24,994
- Closing costs
- $2,999
- Reserves months
- —
- Total cash needed
- —
Loan-product check · same deal, 3 products live
Conventional
25% down · 7.5% · 30yr
- Down + closing
- —
- Monthly P&I
- —
- Monthly cashflow
- —
- DSCR
- —
- Eligible?
- —
Personal DTI + credit; lowest rate.
DSCR
20% down · 8.5% · 30yr
- Down + closing
- —
- Monthly P&I
- —
- Monthly cashflow
- —
- DSCR
- —
- Eligible?
- —
No personal income docs; deal must DSCR.
Hard money
10% down · 12.0% · 12mo
- Down + closing
- —
- Monthly P&I
- —
- Monthly cashflow
- —
- DSCR
- —
- Eligible?
- —
Short-term bridge; refi at stabilization.
Rent comps 40 comps
| Address | Beds | Baths | Sqft | Rent | $/sqft | DOM | Units | Dist |
|---|---|---|---|---|---|---|---|---|
| 4201 E Fourth Plain Blvd Vancouver, WA | 1.0 | 1.0 | 600 | $1,249 | $2.08 | 2d | 9 | 0.18mi |
| 3700 E Fourth Plain Blvd Vancouver, WA | 2.0 | 1.0 | 700 | $1,409 | $2.01 | 7d | 1 | 0.18mi |
| 3903 E 18th St #13 Vancouver, WA | 2.0 | 1.0 | 900 | $1,495 | $1.66 | 22d | 1 | 0.23mi |
| 1604 Bryant St #13 Vancouver, WA | 2.0 | 1.0 | 780 | $1,475 | $1.89 | 23d | 1 | 0.26mi |
| 4325 E 17th St Unit 1 Vancouver, WA | 2.0 | 1.0 | 700 | $1,489 | $2.13 | 12d | 1 | 0.29mi |
| 2478 Rossiter Ln Vancouver, WA | 2.0–3.0 | 1.0–1.5 | 1100 | $1,749 | $1.59 | 3d | 6 | 0.29mi |
| 4012 E 16th St Unit A Vancouver, WA | 2.0 | 1.0 | 950 | $1,350 | $1.42 | 20d | 1 | 0.31mi |
| 3911 Plomondon St Vancouver, WA | 2.0 | 1.5 | 900 | $1,795 | $1.99 | 23d | 1 | 0.33mi |
| 4706 Sheridan Dr Vancouver, WA | 3.0 | 1.0 | 1000 | $2,300 | $2.30 | 2d | 1 | 0.33mi |
| 3408 E 18th St Unit J Vancouver, WA | 2.0 | 1.0 | 830 | $1,695 | $2.04 | 22d | 1 | 0.34mi |
| 3408 E 18th St Unit 3408-J Vancouver, WA | 2.0 | 1.0 | 830 | $1,695 | $2.04 | 23d | 1 | 0.34mi |
| 2920 Falk Rd Vancouver, WA | 2.0–3.0 | 2.5–3.0 | 1268 | $2,375 | $1.87 | 2d | 1 | 0.38mi |
| 3311 E 21st St Apt 12 Vancouver, WA | 2.0 | 1.0 | 825 | $1,200 | $1.45 | 17d | 1 | 0.39mi |
| 2000 Laurel Pl Vancouver, WA | 1.0 | 1.0 | 570 | $1,195 | $2.10 | 23d | 1 | 0.40mi |
| 3308 E 24th Cir Vancouver, WA | 1.0 | 1.0 | 700 | $1,795 | $2.56 | 17d | 1 | 0.40mi |
| 2615 Neals Ln Vancouver, WA | 2.0 | 1.0 | 850 | $1,390 | $1.64 | 2d | 1 | 0.40mi |
| 2815 Caples Ave Unit 1 Vancouver, WA | 2.0 | 1.0 | 814 | $1,695 | $2.08 | 14d | 1 | 0.40mi |
| 4402 Gibbons St Unit 1 Vancouver, WA | 2.0 | 1.0 | 890 | $1,649 | $1.85 | 23d | 1 | 0.41mi |
| 4601 E 18th St Vancouver, WA | 1.0–3.0 | 1.0–2.0 | 1010 | $1,752 | $1.74 | 2d | 13 | 0.43mi |
| 2900 General Anderson Ave Vancouver, WA | 1.0–3.0 | 1.0–2.0 | 880 | $1,591 | $1.81 | 3d | 5 | 0.43mi |
| 2817 Neals Ln Vancouver, WA | 2.0 | 1.0 | 900 | $1,275 | $1.42 | 23d | 1 | 0.44mi |
| 2009 Norris Rd Unit 6 Vancouver, WA | 2.0 | 1.0 | 850 | $1,295 | $1.52 | 23d | 1 | 0.44mi |
| 4420 Gibbons St Unit B Vancouver, WA | 2.0 | 1.0 | 900 | $1,395 | $1.55 | 12d | 1 | 0.44mi |
| 3100 Falk Rd Vancouver, WA | 2.0–3.0 | 2.0–3.0 | 1234 | $1,649 | $1.34 | 1d | 4 | 0.47mi |
| 2212 Carlson Rd Vancouver, WA | 2.0 | 1.0 | 780 | $1,420 | $1.82 | 11d | 1 | 0.48mi |
| 3622 E 13th St Vancouver, WA | 2.0 | 1.0 | 800 | $1,700 | $2.12 | 20d | 1 | 0.50mi |
| 1530 Ash St Vancouver, WA | 2.0 | 1.5 | 1020 | $1,450 | $1.42 | 14d | 1 | 0.54mi |
| 3212 E 13th St Unit 3214-2 Vancouver, WA | 2.0 | 1.0 | 952 | $1,595 | $1.68 | 23d | 1 | 0.62mi |
| 2815 E 19th St Unit D Vancouver, WA | 2.0 | 1.0 | 850 | $1,395 | $1.64 | 23d | 1 | 0.63mi |
| 2815 E 19th St Apt Q Vancouver, WA | 2.0 | 1.0 | 850 | $1,395 | $1.64 | 22d | 1 | 0.63mi |
| 4918 Plomondon St Vancouver, WA | 2.0 | 2.0 | 1000 | $1,695 | $1.70 | 7d | 1 | 0.63mi |
| 4500 Nicholson Rd Vancouver, WA | 2.0–3.0 | 2.0 | 1034 | $1,549 | $1.50 | 2d | 8 | 0.66mi |
| 2810 Fairmount Ave Vancouver, WA | 1.0 | 1.0 | 650 | $1,650 | $2.54 | 23d | 1 | 0.71mi |
| 5500 NE Fourth Plain Blvd Vancouver, WA | 1.0–2.0 | 1.0–2.0 | 768 | $1,659 | $2.16 | 2d | 4 | 0.73mi |
| 3011 Fairmount Ave Unit 3011 Vancouver, WA | 2.0 | 1.0 | 1000 | $1,725 | $1.73 | 23d | 1 | 0.74mi |
| 5203 Ogden Ct Unit B Vancouver, WA | 2.0 | 2.0 | 1118 | $1,999 | $1.79 | 7d | 1 | 0.75mi |
| 3218 Edgewood Dr Unit 3224 D Vancouver, WA | 2.0 | 1.0 | 890 | $1,495 | $1.68 | 23d | 1 | 0.76mi |
| 2012 Y St Unit 2014 Vancouver, WA | 2.0 | 1.0 | 720 | $1,450 | $2.01 | 10d | 1 | 0.82mi |
| 5114 NE 34th St Vancouver, WA | 2.0 | 2.0 | 998 | $1,595 | $1.60 | 23d | 1 | 0.82mi |
| 2431 E 16th St Vancouver, WA | 2.0 | 1.5 | 1040 | $1,762 | $1.69 | 23d | 1 | 0.85mi |
Listing history 14 events
-
2026-06-18days on market $99,975 Active 331 DOM
-
2026-06-17days on market $99,975 Active 330 DOM
-
2026-06-16days on market $99,975 Active 329 DOM
-
2026-06-15days on market $99,975 Active 328 DOM
-
2026-06-13days on market $99,975 Active 326 DOM
-
2026-06-09days on market $99,975 Active 322 DOM
-
2026-06-08days on market $99,975 Active 321 DOM
-
2026-06-07days on market $99,975 Active 320 DOM
-
2026-06-03days on market $99,975 Active 316 DOM
-
2026-06-02days on market $99,975 Active 315 DOM
-
2026-06-01days on market $99,975 Active 314 DOM
-
2026-05-31days on market $99,975 Active 313 DOM
-
2025-12-04price $99,975
-
2025-07-22$115,000 Active
ⓘ Source: listings_history table (triggers on properties + properties_extension) + one-shot
backfill from property_details.listing_events for pre-trigger history.
Tax reassessment forecast WA · Resets to sale price
- Current annual tax
- $891 · $74/mo
- Projected year-2 tax
- $980 · $82/mo
- Expected delta
- +$89/yr (+$7/mo · 10.0%)
ⓘ Screening estimate from a state-policy table — verify with the county assessor before closing.
Nearby sold comps map
Loading sold comps map…
Walkable amenities ~0.75 mi
Loading nearby amenities…
Taxation est. · year 1
- Rental income
- $18,941
- − Mortgage interest
- −$5,600
- − Property taxes
- −$891
- − Insurance
- −$500
- − Repairs & maintenance
- −$1,515
- − Management
- −$1,515
- − Depreciation
- −$2,908
- Taxable income
- $6,011
- Est. tax owed @ 24.0%
- −$1,443
- After-tax cash flow
- $5,838/yr
For passive investors: Depreciation is non-cash, so a rental often shows a tax loss while cash-flowing — sheltering income. Rental losses are passive: they offset passive income freely, and up to $25,000/yr can offset ordinary (W-2) income if you actively participate and your MAGI is under $100k (phasing out to $0 by $150k); unused losses carry forward. On sale, claimed depreciation is recaptured at up to 25%, and gains may owe capital-gains tax (a 1031 exchange can defer both). Figures are a year-1 estimate at your 24.0% rate — not tax advice; consult a CPA.
Condition & rehab AI · 10 photos
This mobile home is in excellent condition with a fresh paint job and modern updates. It's move-in ready and offers a good return on investment.
Value-add opportunities
- Both Painting exterior — Enhances curb appeal and value
- Both Landscaping — Improves curb appeal and rental value
- Both New flooring in bathrooms — Enhances aesthetics and value
- Both New kitchen backsplash — Modernizes kitchen and adds value
Renovation cost estimate screening
Value-add ROI direction
- Both Painting exterior — Enhances curb appeal and value ↑
- Both Landscaping — Improves curb appeal and rental value ↑
- Both New flooring in bathrooms — Enhances aesthetics and value ↑
- Both New kitchen backsplash — Modernizes kitchen and adds value ↑
ⓘ Cost ranges are severity-bucket heuristics (US national rule-of-thumb). Get contractor quotes + a written scope before underwriting a rehab budget.
Schools (NCES district)
- District
- Vancouver School District
- NCES district ID
- 5309270
- Math proficiency
- 43% ▬ 0.00%
- Reading proficiency
- 53% ▬ 0.00%
- Median HH income
- $52,562
- Composite
- 43.45/100
- National rank
- #6479
- State rank
- #156 of 291 in WA
Livability — Vancouver
- Score
- 82/100
- State rank
- #62
- US rank
- #1133
Category grades
Schools grade is shown separately in the Schools card above.
Census & demographics
- Census place
- Vancouver, WA
- County
- Clark County · 513,189 people
- City population
- 360,195
- Metro
- Portland-Vancouver-Hillsboro, OR-WA
- Population (ZIP)
- 50,743
- Household income
- $76,913
- Rent vs Own
- Severe rent burden
- 2384.0
Population outlook (Clark County) Hauer SSP2
- Today (2025)
- 529,610 people
- By 2030
- 563,242 · +6.4%
- By 2040
- 625,905 · +18.2%
- By 2050
- 681,558 · +28.7%
- By 2075
- 805,967 · +52.2%
- By 2100
- 877,450 · +65.7%
Race, ethnicity, and origin ACS 2023
- Neighborhood character
- Majority White (64%)
- Race & ethnicity
- White 64% Hispanic / Latino 21% Two or more races 14% Black 4% Asian 3% Pacific Islander 2%
- Hispanic origin (detail)
- Mexican 18%
- Common ancestry
- Lithuanian 3% Portuguese 3% Subsaharan African 3%
- Foreign-born
- 15% · Canada, Vietnam
- Languages at home
- 76% English-only · Spanish 14% Russian/Polish/Slavic 4% Other Indo-European 2%
Political lean MEDSL · Clark
- 2024 margin
- Lean D (+7.0) · D 52.1% · R 45.1% · Other 2.8%
- 2008→2024 swing
- +0.9pp no change · 2008: 6.1pp · 2024: 7.0pp
- All cycles
- 2024: D+7.0 2020: D+5.1 2016: D+0.1 2012: D+0.1 2008: D+6.1
Not yet ingested
- Civics
- —
Market trends
- HPI YoY
- ▼ -567.83%
- Current HPI
- 308.3632
- Rent YoY
- ▲ 2.05%
- Metro
- Portland-Vancouver-Hillsboro, OR-WA
- State GDP YoY
- ▲ 4.65%
- F500 in state
- 22
Industry mix (Fortune 500 HQ in WA)
| Industry | F500 HQs | Revenue |
|---|---|---|
| Retail | 2 | $269B |
|
||
| Technology / Retail | 1 | $638B |
|
||
| Technology | 1 | $245B |
|
||
| Telecommunications | 1 | $38B |
|
||
| Food / Beverage | 1 | $36B |
|
||
| Automotive / Trucks | 1 | $34B |
|
||
Price history
-13.1% since first listed2 events — show timeline
- 2025-12-04 Price Changed $99,975 NWMLS as Distributed by MLS Grid
- 2025-07-22 Listed $115,000 NWMLS as Distributed by MLS Grid
Cash-flow waterfall
monthlySold comps — $/sqft
last 12 mo · ≤1 miLoading sold comps…