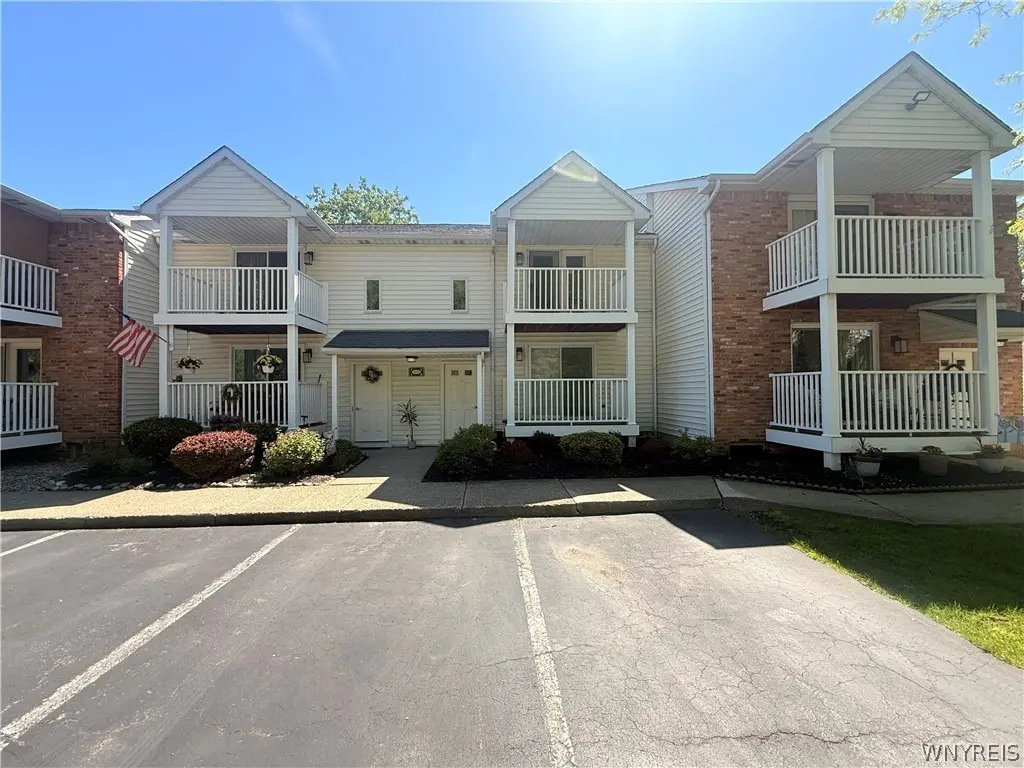
4619 Chestnut Ridge Rd Unit L · University at Buffalo, NY
Flood risk 1/10 · Minimal
- FEMA flood zone
- X (unshaded)
- Chance of flooding over 30 yrs
- 0.0%
- Est. flood insurance / yr
- $473 – $860
Fire risk 1/10 · Minimal
- Est. fire insurance / yr
- $691 – $1,283
Heat risk 3/10 · Minor
- Hot days now (above 94°F)
- 7 days/yr
- Hot days in 30 yrs
- 15 days/yr
Wind risk 1/10 · Minimal
- Chance of severe wind over 30 yrs
- —
Air-quality risk 3/10 · Minor
- Unhealthy air days now
- 2 days/yr
- Unhealthy air days in 30 yrs
- 3 days/yr
Risk factors via First Street. Map © Google.
Why this score? — see what drove the D grade
The composite is a weighted blend of 9 inputs, each scored 0–100. Each bar is that input's sub-score; the figure is the points it added to the 100-point composite (weight × sub-score).
- Cash flow +11.6/30.0
- ARV discount +7.5/15.0
- 1% rule +5.0/10.0
- Schools +4.5/10.0
- Livability +4.4/5.0
- DSCR +3.4/10.0
- Rent growth +2.5/5.0
- Condition / age +2.5/5.0
- Appreciation +0.0/10.0
$174,900
🖨 Deal sheet (PDF) 📄 Offer letter ✓ Due diligence
Listing remarks MLS
Located in the Lake Tree Village Condominiums of Amherst, this two bedroom unit features an open layout for ease in entertaining. A seamless flow between the living, dining and kitchen areas. Natural light abounds due to the large windows, creating a warm and inviting atmosphere. The kitchen is equipped with modern appliances and plenty of counter space, allowing for both casual cooking and entertaining. The second bedroom can serve as a flex space, allowing for a guest room, office or more. French door opens to balcony area. Highlights include a balcony to enjoy your morning coffee and look over the beautifully maintained grounds. Conveniently located near shopping, dining and public transportation, this condominium is perfect for those seeking an effortless lifestyle. Don't miss this wonderful opportunity!
Key facts
- Large windows
- Private balcony
- Modern appliances
Tags
Property features AI
Finance
- Other: Pets not allowed
- HOA & community: Association: Andruschat; Monthly association fee of $269; Association fee covers common area maintenance, common area insurance, insurance, and snow removal
Exterior
- Parking: Assigned detached garage with garage door opener (1 space)
- Utilities: Public water connected; Sewer connected
- Home design: Single-story property; Resale condition
- Construction: Brick and vinyl siding exterior
- Exterior features: Balcony; Near public transit; Rectangular lot
Interior
- Kitchen: Electric cooktop; Microwave; Dishwasher; Refrigerator
- Bedrooms: Total of 5 rooms (includes bedroom spaces and common areas)
- Flooring: Carpet; Vinyl; Varies
- Bathrooms: 1 full bathroom; 1 half bathroom
- Heating & cooling: Forced air heating (gas); Central air conditioning
- Interior features: Entrance foyer; Kitchen/Family room combo
- Laundry & utility: Washer and dryer in basement
Neighborhood map
What this means for you Summary
Snapshot
- This is a 2-bed/1.5-bath single-family listed at $175k.
Deal economics
- At list price, monthly cash flow is $-54 ($-648/yr) — negative.
- To cash-flow at today's rent, offer at most $165k (5.5% below list).
- Meets the 1% rule at list price ($2k rent vs $175k).
- Recommended offer: $165k (5.5% below list) — sets the bar for cash-flow.
- Cap rate 5.9% vs local median 2.8% in University at Buffalo — top-decile yield for the area; either an underpriced asset or a hidden risk that comps aren't pricing in. Stress-test before assuming the spread holds.
Location & tenants
- Location reads 88/100 on livability (#9 in NY, #176 nationally) — a professional / high-income tenant draw. Strengths: amenities A+, commute A+, health & safety A+; Watch: cost of living D+, employment F.
- Sweet Home Central School District (suburban): math 46% / reading 59% proficiency, ranked #342 of 590 in NY (top 58%) — acceptable for families but not a draw, mixed tenant base, ~2y average lease.
- Zoned schools: Willow Ridge Elementary School (math 42% / reading 67%, grade C, #908 of 2,108 statewide, top 46%, 358 students, 38% FRL); Sweet Home Middle School (math 21% / reading 52%, grade F, #464 of 729 statewide, top 64%, 768 students, 54% FRL); Sweet Home Senior High School (math 93% / reading 87%, grade A+, #238 of 1,100 statewide, top 23%, 1,072 students, 46% FRL).
- Market conditions: 95 active listings in the ZIP; 16 comparable units currently listed for rent nearby; rentals leasing fast (median 13d on market — plan ~1-2 weeks tenant-placement turnaround); 1,244 units permitted in Erie County in 2024 (563 in 5+ unit buildings).
Forward outlook
- Local home prices are declining (-3.0%/yr); year-one equity from $1k of loan paydown is wiped out by about $5k of value loss. Plan a longer hold.
Negotiation context
- It's been on market 22 days — a 2% lower offer ($172k) is reasonable based on typical stale-listing flexibility.
- 4 sale attempts since 12y ago with the ask held roughly flat each time — persistent listings suggest the price (not the market) is what's stuck; bring a comps-based counter.
- Current owner paid $150k; 17% above their basis — modest negotiation headroom, anchor on the comps not their cost.
Questions for the listing agent
- What do current leases actually rent for vs. the listed asking? Can we see a recent rent roll and the last 12 months of T-12 income?
- What does the HOA fee cover, when was the last increase, and are there any pending special assessments or reserve-fund shortfalls?
- Is there a deadline driving the sale (1031 exchange, divorce, estate, relocation)? That informs how much negotiation room exists.
- Schools are A-rated — typically a magnet for longer-tenancy family renters. What's the average tenant stay here, and is there a school-zone premium baked into asking?
- The area grade is low — what's the realistic commute time and amenity access for the typical tenant pool here? Any planned neighborhood developments (good or bad) we should know about?
- What's the average days-on-market for RENTAL listings here right now (not sales)? A rising rental-DOM trend means longer vacancies and softer asking-rent achievability than the comps imply.
- What's the recent tenant-quality profile in this submarket — average credit score on applications, eviction rate, late-payment / NSF rate, and stable-employment percentage? A property-management company in the area should have these aggregated.
- How much new for-sale + rental construction is in the pipeline within 1–3 miles? Heavy new supply typically softens prices + rents 12–24 months out; constrained supply supports both.
Investment metrics
- 1% rule
- 1.00% ✓
- Cap rate
- 5.92%
- Cash-on-cash
- -1.32%
- DSCR
- 0.94
- GRM
- 8.3
CMA / ARV
No comps found within radius.
Projected returns pro-forma
-3.0% appreciation · 3.0% rent growth · sell at horizon
- IRR
- -18.4%
- Equity multiple
- 0.35×
- Total profit
- $-31,612
- Equity at exit
- $26,078
- IRR
- -10.5%
- Equity multiple
- 0.36×
- Total profit
- $-31,271
- Equity at exit
- $15,122
Cash invested: $48,972 (down + closing). Projections, not guarantees.
Landlord ↔ Tenant lean methodology
- Overall (STATE)
- 15 Strongly Tenant-Friendly
- State New York
- 15 Strongly Tenant-Friendly · D+10
- County
- — inherits STATE
- City
- — inherits STATE
ZIP-level market 14228
- Home prices YoY
- -31.9%
- Active inventory
- 95
- Price-to-rent
- 8.3×
Monthly cashflow live
- Estimated rent
- $1,755 high interval (Pro) →
- Mortgage (P&I)
- −$917
- Tax from tax record
- −$181 /mo · $2,175/yr
- Insurance
- −$73
- HOA
- −$269
- Vacancy / Maint / Mgmt
- −$369
- Net cashflow
- $-54
Break-even live
Sensitivity live
| Price | -10% $45 | -5% $-5 | +0% $-54 | +5% $-104 | +10% $-153 |
|---|---|---|---|---|---|
| Rent | -10% $-193 | -5% $-123 | +0% $-54 | +5% $15 | +10% $85 |
| Rate | -1.0pp $34 | -0.5pp $-10 | base $-54 | +0.5pp $-99 | +1.0pp $-145 |
UW: 25.0% down · 7.5% · 30yr · 1.5% tax · 5.0% vac · 8.0% maint · 8.0% mgmt
Financing live
Cash to close
- Down payment
- $43,725
- Closing costs
- $5,247
- Reserves months
- —
- Total cash needed
- —
Loan-product check · same deal, 3 products live
Conventional
25% down · 7.5% · 30yr
- Down + closing
- —
- Monthly P&I
- —
- Monthly cashflow
- —
- DSCR
- —
- Eligible?
- —
Personal DTI + credit; lowest rate.
DSCR
20% down · 8.5% · 30yr
- Down + closing
- —
- Monthly P&I
- —
- Monthly cashflow
- —
- DSCR
- —
- Eligible?
- —
No personal income docs; deal must DSCR.
Hard money
10% down · 12.0% · 12mo
- Down + closing
- —
- Monthly P&I
- —
- Monthly cashflow
- —
- DSCR
- —
- Eligible?
- —
Short-term bridge; refi at stabilization.
Rent comps 16 comps
| Address | Beds | Baths | Sqft | Rent | $/sqft | DOM | Units | Dist |
|---|---|---|---|---|---|---|---|---|
| 325 Kaymar Dr Unit 325 Buffalo, NY | 3.0 | 1.0 | 1073 | $1,695 | $1.58 | 45d | 1 | 0.30mi |
| 3948 Ridge Lea Rd Unit D Buffalo, NY | 2.0 | 1.0 | 952 | $1,850 | $1.94 | 3d | 1 | 0.61mi |
| 1880 Sweet Home Rd Buffalo, NY | 1.0–2.0 | 1.0 | 745 | $2,030 | $2.72 | 4d | 6 | 0.68mi |
| 205 Charter Oaks Dr #4 Buffalo, NY | 1.0 | 1.0 | 795 | $1,500 | $1.89 | 3d | 1 | 0.98mi |
| 2071 Sweet Home Rd Buffalo, NY | 3.0–4.0 | 3.0 | 1415 | $2,300 | $1.63 | 3d | 5 | 0.99mi |
| 1525 Amherst Manor Dr Buffalo, NY | 2.0 | 2.0 | 1080 | $1,495 | $1.38 | 3d | 5 | 1.28mi |
| 4765 N Bailey Ave Buffalo, NY | 2.0 | 1.0 | 900 | $2,100 | $2.33 | 45d | 1 | 1.29mi |
| 1335 Millersport Hwy Buffalo, NY | 2.0 | 1.0 | 713 | $1,595 | $2.24 | 13d | 1 | 1.34mi |
| 1335 Millersport Hwy Unit 1335-06 Buffalo, NY | 1.0 | 1.0 | 560 | $1,415 | $2.53 | 45d | 1 | 1.34mi |
| 1335 Millersport Hwy Unit 04 Buffalo, NY | 2.0 | 1.0 | 713 | $1,595 | $2.24 | 3d | 1 | 1.34mi |
| 1357 Millersport Hwy Buffalo, NY | 1.0–2.0 | 1.0 | 636 | $1,595 | $2.51 | 3d | 2 | 1.34mi |
| 1357 Millersport Hwy Unit 1335-06 Buffalo, NY | 1.0 | 1.0 | 560 | $1,415 | $2.53 | 45d | 1 | 1.34mi |
| 1357 Millersport Hwy Unit 1357-03 Buffalo, NY | 2.0 | 1.0 | 713 | $1,595 | $2.24 | 45d | 1 | 1.34mi |
| 427 Emerson Dr Buffalo, NY | 1.0 | 1.0 | 570 | $1,355 | $2.38 | 21d | 1 | 1.36mi |
| 2635 N Forest Rd Unit Type G Getzville, NY | 1.0 | 1.0 | 705 | $1,699 | $2.41 | 3d | 1 | 1.43mi |
| 79 Rosemont Dr Buffalo, NY | 2.0 | 1.0 | 1071 | $2,200 | $2.05 | 45d | 1 | 1.50mi |
HOA detail
- Monthly dues
- $269 · $3,228/yr
- Likely covers
- landscaping
Listing history 13 events
-
2026-06-21days on market $174,900 Active 22 DOM
-
2026-06-18days on market $174,900 Active 19 DOM
-
2026-06-17days on market $174,900 Active 18 DOM
-
2026-06-16days on market $174,900 Active 17 DOM
-
2026-06-15days on market $174,900 Active 16 DOM
-
2026-06-13days on market $174,900 Active 14 DOM
-
2026-06-10days on market $174,900 Active 11 DOM
-
2026-06-09days on market $174,900 Active 10 DOM
-
2026-06-08days on market $174,900 Active 9 DOM
-
2026-06-07days on market $174,900 Active 8 DOM
-
2026-06-03days on market $174,900 Active 4 DOM
-
2026-06-02days on market $174,900 Active 3 DOM
-
2026-06-01days on market $174,900 Active 2 DOM
ⓘ Source: listings_history table (triggers on properties + properties_extension) + one-shot
backfill from property_details.listing_events for pre-trigger history.
Tax reassessment forecast NY · Partial reset (capped growth)
- Current annual tax
- $2,175 · $181/mo
- Projected year-2 tax
- $2,565 · $214/mo
- Expected delta
- +$390/yr (+$33/mo · 18.0%)
ⓘ Screening estimate from a state-policy table — verify with the county assessor before closing.
Climate risk First Street
- Flood 1/10 Low FEMA zone X (unshaded) · 0% chance over 30 yrs
- Wildfire 1/10 Low
- Heat 3/10 Moderate 7 d/yr ≥94°F today · 15 d/yr by 30 yrs out
- Wind 1/10 Low
- Air quality 3/10 Moderate 2 unhealthy d/yr today · 3 by 30 yrs out
Nearby sold comps map
Loading sold comps map…
Walkable amenities ~0.75 mi
Loading nearby amenities…
Taxation est. · year 1
- Rental income
- $21,058
- − Mortgage interest
- −$9,797
- − Property taxes
- −$2,175
- − Insurance
- −$874
- − Repairs & maintenance
- −$1,685
- − Management
- −$1,685
- − HOA
- −$3,228
- − Depreciation
- −$5,088
- Taxable loss
- −$3,474
- Est. tax savings @ 24.0%
- +$834
- After-tax cash flow
- $186/yr
For passive investors: Depreciation is non-cash, so a rental often shows a tax loss while cash-flowing — sheltering income. Rental losses are passive: they offset passive income freely, and up to $25,000/yr can offset ordinary (W-2) income if you actively participate and your MAGI is under $100k (phasing out to $0 by $150k); unused losses carry forward. On sale, claimed depreciation is recaptured at up to 25%, and gains may owe capital-gains tax (a 1031 exchange can defer both). Figures are a year-1 estimate at your 24.0% rate — not tax advice; consult a CPA.
Schools (NCES district)
- District
- Sweet Home Central School District
- NCES district ID
- 3628500
- Math proficiency
- 46% ▼ -12.00%
- Reading proficiency
- 59% ▲ 4.00%
- Median HH income
- $48,509
- Composite
- 44.67/100
- National rank
- #2765
- State rank
- #342 of 590 in NY
Livability — University at Buffalo
- Score
- 88/100
- State rank
- #9
- US rank
- #176
Category grades
Schools grade is shown separately in the Schools card above.
Census & demographics
- County
- Erie County · 714,559 people
- City population
- 5,827
- Metro
- Buffalo-Cheektowaga, NY
- Population (ZIP)
- 25,350
- Household income
- $74,871
- Rent vs Own
- Severe rent burden
- 1566.0
Population outlook (Erie County) Hauer SSP2
- Today (2025)
- 933,037 people
- By 2030
- 935,181 · +0.2%
- By 2040
- 928,531 · -0.5%
- By 2050
- 905,725 · -2.9%
- By 2075
- 834,037 · -10.6%
- By 2100
- 708,033 · -24.1%
Race, ethnicity, and origin ACS 2023
- Neighborhood character
- Predominantly White (74%)
- Race & ethnicity
- White 74% Asian 13% Black 5% Hispanic / Latino 5% Two or more races 5%
- Hispanic origin (detail)
- Puerto Rican 3%
- Common ancestry
- Romanian 13% Scotch-Irish 2% Lithuanian 1%
- Foreign-born
- 17% · China, Canada, South Korea
- Languages at home
- 78% English-only · Chinese 6% Other Indo-European 4% Russian/Polish/Slavic 3%
Political lean MEDSL · Erie
- 2024 margin
- Lean D (+9.7) · D 54.8% · R 45.2%
- 2008→2024 swing
- -7.9pp toward R · 2008: 17.5pp · 2024: 9.7pp
- All cycles
- 2024: D+9.7 2020: D+14.7 2016: D+4.8 2012: D+15.6 2008: D+17.5
Not yet ingested
- Civics
- —
Market trends
- HPI YoY
- ▼ -148.08%
- Current HPI
- 316.3097
- Rent YoY
- —
- Metro
- Buffalo-Cheektowaga, NY
- State GDP YoY
- ▲ 2.60%
- F500 in state
- 92
Industry mix (Fortune 500 HQ in NY)
| Industry | F500 HQs | Revenue |
|---|---|---|
| Financial Services | 10 | $950B |
|
||
| Consumer Goods | 9 | $162B |
|
||
| Insurance | 4 | $225B |
|
||
| Telecommunications | 2 | $144B |
|
||
| Pharmaceuticals | 2 | $112B |
|
||
| Media / Entertainment | 2 | $69B |
|
||
Price history
+16.7% since first listed9 events — show timeline
- 2026-05-30 Listed $174,900 WNYREIS
- 2025-10-16 Sold (Public Records) $150,000 Public Records
- 2025-10-15 Sold (MLS) $150,000 WNYREIS
- 2025-08-24 Pending — WNYREIS
- 2025-08-14 Listed $149,900 WNYREIS
- 2014-09-26 Listing Removed — WNYREIS
- 2014-07-01 Sold (MLS) $950 WNYREIS
- 2014-05-14 Listed $950 WNYREIS
- 2014-02-07 Listed $950 WNYREIS
Property tax history
+1.4%/yrLatest (2025): $2,175 · -23.9% YoY. Source: county tax records.
Cash-flow waterfall
monthlySold comps — $/sqft
last 12 mo · ≤1 miLoading sold comps…