2125 Maple Acres Rd · Princeton, WV
Flood risk 1/10 · Minimal
- FEMA flood zone
- X (unshaded)
- Chance of flooding over 30 yrs
- 0.0%
- Est. flood insurance / yr
- $507 – $1,088
Fire risk 4/10 · Minor
- Est. fire insurance / yr
- $787 – $1,461
Heat risk 2/10 · Minimal
- Hot days now (above 91°F)
- 7 days/yr
- Hot days in 30 yrs
- 21 days/yr
Wind risk 2/10 · Minimal
- Chance of severe wind over 30 yrs
- —
Air-quality risk 1/10 · Minimal
- Unhealthy air days now
- 0 days/yr
- Unhealthy air days in 30 yrs
- 0 days/yr
Risk factors via First Street. Map © Google.
Why this score? — see what drove the B- grade
The composite is a weighted blend of 9 inputs, each scored 0–100. Each bar is that input's sub-score; the figure is the points it added to the 100-point composite (weight × sub-score).
- Cash flow +19.7/30.0
- ARV discount +15.0/15.0
- Appreciation +10.0/10.0
- DSCR +6.2/10.0
- 1% rule +5.2/10.0
- Livability +3.6/5.0
- Schools +2.6/10.0
- Rent growth +2.5/5.0
- Condition / age +2.2/5.0
$100,000
🖨 Deal sheet (PDF) 📄 Offer letter ✓ Due diligence
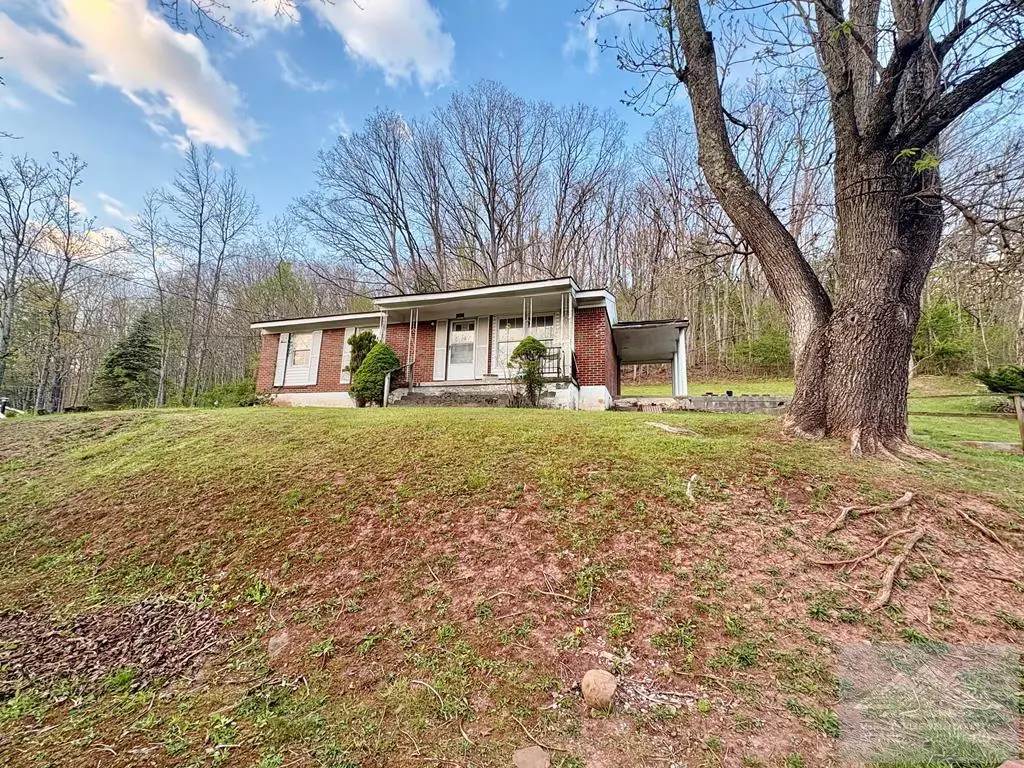
Listing remarks
Opportunity awaits! Situated in a prime location on 2.64 acres, with the perfect blend of privacy and potential. Featuring a charming brick with a covered front porch, a concrete patio, hardwood floors, this home is ready for your vision. The possibilities are endless; this is an ideal location for investors or buyers looking to create their own retreat. Home is fronting Maple Acres road, minutes to HWY 460. All measurements are estimated.
Key facts
- Covered front porch
- Concrete patio
- Hardwood floors
Tags
Property features AI
Exterior
- Parking: Asphalt driveway/parking
- Utilities: Public water; Public sewer
- Home design: Single-family residential; 1 story
- Construction: Brick construction
- Exterior features: Asphalt parking surface; 2.64-acre lot
Interior
- Bathrooms: 1 full bathroom; 1 half bathroom
- Heating & cooling: Baseboard heating
- Interior features: Crawl space basement
Neighborhood map
What this means for you Summary
Snapshot
- This is a 3-bed/1.5-bath single-family listed at $100k. Condition is rated fair.
Deal economics
- At list price, monthly cash flow is $118 ($1k/yr) — positive.
- The deal already cash-flows at list — no discount required.
- Meets the 1% rule at list price ($1k rent vs $100k).
- Recommended offer: $97k (3.0% below list) — sets the bar for market timing.
- Cap rate 7.7% vs local median 3.7% in Princeton — top-decile yield for the area; either an underpriced asset or a hidden risk that comps aren't pricing in. Stress-test before assuming the spread holds.
Location & tenants
- Location reads 72/100 on livability (#53 in WV) — a middle-class / working-renter tenant base. Strengths: cost of living A+, housing A+, crime B+; Watch: amenities D, commute F, employment F.
- Mercer County Schools (town): math 26% / reading 37% proficiency, ranked #28 of 55 in WV (top 51%) — families likely to look elsewhere, expect single-tenant / working-renter base with shorter leases.
- Zoned schools: Glenwood School (K-8) (math 40% / reading 52%, grade D-, #68 of 377 statewide, top 18%, 600 students, 0% FRL); Princeton Senior High School (math 32% / reading 52%, grade F, #14 of 110 statewide, top 16%, 983 students, 0% FRL) — zoned schools average 0% FRL vs 54% district-wide (54 pts lower); this property's tenant base skews higher-income than the district average.
- Zoned-school proficiency averages 44% at this address vs 32% district-wide (+12 pts) — the actual schools serving this property are materially stronger than the Mercer County Schools average implies; a family-tenant draw the district grade alone would hide.
- Market conditions: 22 active listings in the ZIP; 4 units permitted in Mercer County in 2024 (0 in 5+ unit buildings).
Forward outlook
- In year one you build about $11k of equity ($691 loan paydown + $10k appreciation (10.0% local appreciation)).
- Mercer County population projected at -18% by 2050 — secular population decline; favor cash flow + early exit over multi-decade hold.
- At projected returns (10.0% appreciation + 3.0% rent growth), your $28k cash investment doubles in ~3 years — after that, you're playing with house money.
- By year 4, paydown + projected appreciation supports a ~$38k cash-out refi (75% LTV) — recoverable capital for the next deal without selling this one.
Negotiation context
- It's been on market 55 days — a 3% lower offer ($97k) is reasonable based on typical stale-listing flexibility.
Questions for the listing agent
- It's been on market 55 days. Have you received any prior offers? Is the seller open to a 3% concession, seller financing, or rate buy-down credit?
- Have any recent inspections been done? Can we get a copy of the seller's disclosures and any deferred-maintenance estimates?
- Built in 1970 — when were the roof, HVAC, electrical panel, plumbing, and water heater last replaced?
- Is there a deadline driving the sale (1031 exchange, divorce, estate, relocation)? That informs how much negotiation room exists.
- Schools are B-rated — typically a magnet for longer-tenancy family renters. What's the average tenant stay here, and is there a school-zone premium baked into asking?
- What's the average days-on-market for RENTAL listings here right now (not sales)? A rising rental-DOM trend means longer vacancies and softer asking-rent achievability than the comps imply.
- What's the recent tenant-quality profile in this submarket — average credit score on applications, eviction rate, late-payment / NSF rate, and stable-employment percentage? A property-management company in the area should have these aggregated.
- How much new for-sale + rental construction is in the pipeline within 1–3 miles? Heavy new supply typically softens prices + rents 12–24 months out; constrained supply supports both.
Investment metrics
- 1% rule
- 1.02% ✓
- Cap rate
- 7.70%
- Cash-on-cash
- 5.04%
- DSCR
- 1.22
- GRM
- 8.1
CMA / ARV
- ARV (on-the-fly)
- $166,848
- Comps found
- 1
Show comp detail 1 sale within ~0.75 mi
| Address | Dist | Beds/Ba | Sqft | Sold | Price | $/sf | Match |
|---|---|---|---|---|---|---|---|
| 188 Shadetree Cir | 0.11mi | 3/1.0 | 950 (-10%) | 13mo | $150,000 | $158 | 65 |
Match score weights: distance 35% · size 25% · config 20% · recency 20%. Top-matched comps best support the ARV.
Projected returns pro-forma
10.0% appreciation · 3.0% rent growth · sell at horizon
- IRR
- 27.9%
- Equity multiple
- 3.21×
- Total profit
- $61,965
- Equity at exit
- $90,088
- IRR
- 24.4%
- Equity multiple
- 7.31×
- Total profit
- $176,621
- Equity at exit
- $194,278
Cash invested: $28,000 (down + closing). Projections, not guarantees.
Landlord ↔ Tenant lean methodology
- Overall (STATE)
- 83 Strongly Landlord-Friendly
- State West Virginia
- 83 Strongly Landlord-Friendly · R+22
- County
- — inherits STATE
- City
- — inherits STATE
ZIP-level market 24739
- Home prices YoY
- 15.7%
- Active inventory
- 22
- Price-to-rent
- 8.1×
Monthly cashflow live
- Estimated rent
- $1,024 medium interval (Pro) →
- Mortgage (P&I)
- −$524
- Tax est. 1.5%
- −$125 /mo · $1,500/yr
- Insurance
- −$42
- HOA
- −$0
- Vacancy / Maint / Mgmt
- −$215
- Net cashflow
- $118
Break-even live
Sensitivity live
| Price | -10% $187 | -5% $152 | +0% $118 | +5% $83 | +10% $48 |
|---|---|---|---|---|---|
| Rent | -10% $37 | -5% $77 | +0% $118 | +5% $158 | +10% $198 |
| Rate | -1.0pp $168 | -0.5pp $143 | base $118 | +0.5pp $92 | +1.0pp $65 |
UW: 25.0% down · 7.5% · 30yr · 1.5% tax · 5.0% vac · 8.0% maint · 8.0% mgmt
Financing live
Cash to close
- Down payment
- $25,000
- Closing costs
- $3,000
- Reserves months
- —
- Total cash needed
- —
Loan-product check · same deal, 3 products live
Conventional
25% down · 7.5% · 30yr
- Down + closing
- —
- Monthly P&I
- —
- Monthly cashflow
- —
- DSCR
- —
- Eligible?
- —
Personal DTI + credit; lowest rate.
DSCR
20% down · 8.5% · 30yr
- Down + closing
- —
- Monthly P&I
- —
- Monthly cashflow
- —
- DSCR
- —
- Eligible?
- —
No personal income docs; deal must DSCR.
Hard money
10% down · 12.0% · 12mo
- Down + closing
- —
- Monthly P&I
- —
- Monthly cashflow
- —
- DSCR
- —
- Eligible?
- —
Short-term bridge; refi at stabilization.
Listing history 17 events
-
2026-06-19days on market $100,000 Active 55 DOM
-
2026-06-18days on market $100,000 Active 54 DOM
-
2026-06-17days on market $100,000 Active 53 DOM
-
2026-06-16days on market $100,000 Active 52 DOM
-
2026-06-15days on market $100,000 Active 51 DOM
-
2026-06-14days on market $100,000 Active 49 DOM
-
2026-06-12pricestatusdays on market $100,000 Active 48 DOM
-
2026-06-09days on market $130,000 Active Under Contract 45 DOM
-
2026-06-08days on market $130,000 Active Under Contract 44 DOM
-
2026-06-07days on market $130,000 Active Under Contract 43 DOM
-
2026-06-05statusdays on market $130,000 Active Under Contract 40 DOM
-
2026-06-02days on market $130,000 Active 38 DOM
-
2026-06-01days on market $130,000 Active 37 DOM
-
2026-05-31days on market $130,000 Active 36 DOM
-
2026-05-30days on market $130,000 Active 35 DOM
-
2026-05-08price $130,000
-
2026-04-25$139,900 Active
ⓘ Source: listings_history table (triggers on properties + properties_extension) + one-shot
backfill from property_details.listing_events for pre-trigger history.
Climate risk First Street
- Flood 1/10 Low FEMA zone X (unshaded) · 0% chance over 30 yrs
- Wildfire 4/10 Moderate
- Heat 2/10 Low 7 d/yr ≥91°F today · 21 d/yr by 30 yrs out
- Wind 2/10 Low
- Air quality 1/10 Low 0 unhealthy d/yr today · 0 by 30 yrs out
Nearby sold comps map
Loading sold comps map…
Walkable amenities ~0.75 mi
Loading nearby amenities…
Taxation est. · year 1
- Rental income
- $12,283
- − Mortgage interest
- −$5,602
- − Property taxes
- −$1,500
- − Insurance
- −$500
- − Repairs & maintenance
- −$983
- − Management
- −$983
- − Depreciation
- −$2,909
- Taxable loss
- −$193
- Est. tax savings @ 24.0%
- +$46
- After-tax cash flow
- $1,457/yr
For passive investors: Depreciation is non-cash, so a rental often shows a tax loss while cash-flowing — sheltering income. Rental losses are passive: they offset passive income freely, and up to $25,000/yr can offset ordinary (W-2) income if you actively participate and your MAGI is under $100k (phasing out to $0 by $150k); unused losses carry forward. On sale, claimed depreciation is recaptured at up to 25%, and gains may owe capital-gains tax (a 1031 exchange can defer both). Figures are a year-1 estimate at your 24.0% rate — not tax advice; consult a CPA.
Condition & rehab AI · 13 photos
This home requires moderate renovations to update the kitchen and bathroom, repair the roof, and improve the landscaping. The property has a good location and potential for increased value with these updates.
Repairs flagged
- Moderate kitchen cabinets — dated and in need of updating
- Moderate kitchen tile flooring — dated and in need of updating
- Moderate bathroom fixtures — basic and in need of updating
- Moderate roof shingles — visible wear and tear
Value-add opportunities
- Both update kitchen cabinets and flooring — modernizing the kitchen would appeal to both buyers and renters
- Both update bathroom fixtures — modernizing the bathroom would appeal to both buyers and renters
- Both repair/replace roof shingles — repairing the roof would improve the home's curb appeal and increase its value
- Both landscape and improve curb appeal — improving the landscaping would increase the home's curb appeal and attract more buyers and renters
Renovation cost estimate screening
| Repair item | Severity | Est. cost |
|---|---|---|
| kitchen cabinets · dated and in need of updating | Moderate | $3,000–15,000 |
| kitchen tile flooring · dated and in need of updating | Moderate | $3,000–15,000 |
| bathroom fixtures · basic and in need of updating | Moderate | $3,000–15,000 |
| roof shingles · visible wear and tear | Moderate | $3,000–15,000 |
| Total estimated repair cost · 4 items | $12,000–60,000 |
Value-add ROI direction
- Both update kitchen cabinets and flooring — modernizing the kitchen would appeal to both buyers and renters ↑
- Both update bathroom fixtures — modernizing the bathroom would appeal to both buyers and renters ↑
- Both repair/replace roof shingles — repairing the roof would improve the home's curb appeal and increase its value ↑
- Both landscape and improve curb appeal — improving the landscaping would increase the home's curb appeal and attract more buyers and renters ↑
ⓘ Cost ranges are severity-bucket heuristics (US national rule-of-thumb). Get contractor quotes + a written scope before underwriting a rehab budget.
Schools (NCES district)
- District
- Mercer County Schools
- NCES district ID
- 5400840
- Math proficiency
- 26% ▼ -13.00%
- Reading proficiency
- 37% ▼ -6.00%
- Median HH income
- $35,064
- Composite
- 25.98/100
- National rank
- #7325
- State rank
- #28 of 55 in WV
Livability — Princeton
- Score
- 72/100
- State rank
- #53
- US rank
- #6278
Category grades
Schools grade is shown separately in the Schools card above.
Census & demographics
- City population
- 16,498
- Population (ZIP)
- 13,093
Population outlook (Mercer County) Hauer SSP2
- Today (2025)
- 57,860 people
- By 2030
- 55,781 · -3.6%
- By 2040
- 51,365 · -11.2%
- By 2050
- 47,476 · -17.9%
- By 2075
- 38,851 · -32.9%
- By 2100
- 30,053 · -48.1%
Race, ethnicity, and origin ACS 2023
- Neighborhood character
- Predominantly White (94%)
- Race & ethnicity
- White 94% Two or more races 3% Black 2%
- Common ancestry
- Italian 2% Iranian 1% Portuguese 1%
- Foreign-born
- 1%
- Languages at home
- 99% English-only · Spanish 1%
Political lean MEDSL · Mercer
- 2024 margin
- Solid R (+57.3) · D 20.6% · R 77.9% · Other 1.5%
- 2008→2024 swing
- -29.8pp toward R · 2008: -27.6pp · 2024: -57.3pp
- All cycles
- 2024: R+57.3 2020: R+54.4 2016: R+55.3 2012: R+47.1 2008: R+27.6
Not yet ingested
- Civics
- —
Market trends
- HPI YoY
- ▲ 34.51%
- Current HPI
- 253.9239
- Rent YoY
- —
- Metro
- —
- State GDP YoY
- —
- F500 in state
- 0
Price history
-7.1% since first listed2 events — show timeline
- 2026-05-08 Price Changed $130,000 MTCBOR
- 2026-04-25 Listed $139,900 MTCBOR
Cash-flow waterfall
monthlySold comps — $/sqft
last 12 mo · ≤1 miLoading sold comps…