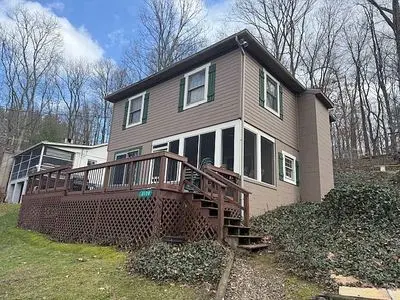
3128 Rockwood Dr SW · Carrollton, OH
Flood risk 1/10 · Minimal
- FEMA flood zone
- X (unshaded)
- Chance of flooding over 30 yrs
- 0.0%
- Est. flood insurance / yr
- $473 – $860
Fire risk 1/10 · Minimal
- Est. fire insurance / yr
- $713 – $1,323
Heat risk 3/10 · Minor
- Hot days now (above 98°F)
- 7 days/yr
- Hot days in 30 yrs
- 17 days/yr
Wind risk 1/10 · Minimal
- Chance of severe wind over 30 yrs
- —
Air-quality risk 2/10 · Minimal
- Unhealthy air days now
- 0 days/yr
- Unhealthy air days in 30 yrs
- 1 days/yr
Risk factors via First Street. Map © Google.
Why this score? — see what drove the C- grade
The composite is a weighted blend of 9 inputs, each scored 0–100. Each bar is that input's sub-score; the figure is the points it added to the 100-point composite (weight × sub-score).
- Cash flow +15.8/30.0
- ARV discount +15.0/15.0
- DSCR +4.9/10.0
- Livability +4.0/5.0
- 1% rule +3.4/10.0
- Schools +3.4/10.0
- Rent growth +2.5/5.0
- Condition / age +2.5/5.0
- Appreciation +0.0/10.0
$250,000
🖨 Deal sheet (PDF) 📄 Offer letter ✓ Due diligence
Listing remarks
& quot; & quot; Carrollton cottage with six lots on Leesville Lake with walking distance to beach and private dock. Includes pontoon and furnishings. HOA includes water trash removal road maintenance and docking decal for boat. & quot; & quot; & quot; & quot; & quot; & quot;
Key facts
- Leesville lake
- Private dock
- Six lots
Tags
Neighborhood map
What this means for you Summary
Snapshot
- This is a 3-bed/1.0-bath single-family listed at $250k.
Deal economics
- At list price, monthly cash flow is $116 ($1k/yr) — positive.
- The deal already cash-flows at list — no discount required.
- To meet the 1% rule (rent ≥ 1% of price), the offer needs to be $209k (16.4% below list).
- Recommended offer: $209k (16.4% below list) — sets the bar for 1% rule.
- Cap rate 6.8% vs local median 4.7% in Carrollton — top-decile yield for the area; either an underpriced asset or a hidden risk that comps aren't pricing in. Stress-test before assuming the spread holds.
Location & tenants
- Location reads 80/100 on livability (#131 in OH, #1,863 nationally) — a professional / high-income tenant draw. Strengths: crime A+, cost of living A+, housing A+; Watch: amenities F, commute F.
- Conotton Valley Union Local (rural): math 37% / reading 42% proficiency, ranked #541 of 656 in OH (top 82%) — families likely to look elsewhere, expect single-tenant / working-renter base with shorter leases.
- Zoned schools: Conotton Valley Elementary (math 42% / reading 52%, grade D-, #942 of 1,584 statewide, top 61%, 288 students, 40% FRL); Conotton Valley High School (math 37% / reading 37%, grade F, #564 of 781 statewide, top 74%, 225 students, 41% FRL) — zoned schools at 40% FRL track the district average.
- Market conditions: 43 active listings in the ZIP; 2 units permitted in Carroll County in 2024 (0 in 5+ unit buildings).
- This rent runs 38% of the median local income ($66k/yr) — at the standard rent-burdened threshold; future hikes will face affordability resistance.
Forward outlook
- Local home prices are declining (-3.0%/yr); year-one equity from $2k of loan paydown is wiped out by about $8k of value loss. Plan a longer hold.
- Carroll County population projected at -25% by 2050 — secular population decline; favor cash flow + early exit over multi-decade hold.
Negotiation context
- It's been on market 26 days — a 2% lower offer ($246k) is reasonable based on typical stale-listing flexibility.
Risks & watch-outs
- Watch-outs: built in 1957 — expect roof / HVAC / electrical / plumbing capex.
Questions for the listing agent
- Built in 1957 — when were the roof, HVAC, electrical panel, plumbing, and water heater last replaced?
- Is there a deadline driving the sale (1031 exchange, divorce, estate, relocation)? That informs how much negotiation room exists.
- Schools are A-rated — typically a magnet for longer-tenancy family renters. What's the average tenant stay here, and is there a school-zone premium baked into asking?
- What's the average days-on-market for RENTAL listings here right now (not sales)? A rising rental-DOM trend means longer vacancies and softer asking-rent achievability than the comps imply.
- What's the recent tenant-quality profile in this submarket — average credit score on applications, eviction rate, late-payment / NSF rate, and stable-employment percentage? A property-management company in the area should have these aggregated.
- How much new for-sale + rental construction is in the pipeline within 1–3 miles? Heavy new supply typically softens prices + rents 12–24 months out; constrained supply supports both.
Investment metrics
- 1% rule
- 0.84% ✗
- Cap rate
- 6.85%
- Cash-on-cash
- 1.98%
- DSCR
- 1.09
- GRM
- 10.0
CMA / ARV
- ARV (on-the-fly)
- $325,248
- Comps found
- 2
Show comp detail 2 sales within ~0.75 mi
| Address | Dist | Beds/Ba | Sqft | Sold | Price | $/sf | Match |
|---|---|---|---|---|---|---|---|
| 3675 Rockwood Dr SW | 0.20mi | 2/3.0 (-1) | 1,344 (0%) | 9mo | $255,000 | $190 | 70 |
| 3237 Parkland Dr SW | 0.37mi | 3/1.0 | 1,344 (0%) | 20mo | $325,000 | $242 | 66 |
Match score weights: distance 35% · size 25% · config 20% · recency 20%. Top-matched comps best support the ARV.
Projected returns pro-forma
-3.0% appreciation · 3.0% rent growth · sell at horizon
- IRR
- -13.2%
- Equity multiple
- 0.53×
- Total profit
- $-33,239
- Equity at exit
- $37,276
- IRR
- -4.3%
- Equity multiple
- 0.72×
- Total profit
- $-19,821
- Equity at exit
- $21,615
Cash invested: $70,000 (down + closing). Projections, not guarantees.
Landlord ↔ Tenant lean methodology
- Overall (STATE)
- 73 Landlord-Friendly
- State Ohio
- 73 Landlord-Friendly · R+6
- County
- — inherits STATE
- City
- — inherits STATE
ZIP-level market 44615
- Active inventory
- 43
- Price-to-rent
- 10.0×
Monthly cashflow live
- Estimated rent
- $2,089 medium interval (Pro) →
- Mortgage (P&I)
- −$1,311
- Tax from tax record
- −$120 /mo · $1,435/yr
- Insurance
- −$104
- HOA
- −$0
- Vacancy / Maint / Mgmt
- −$439
- Net cashflow
- $116
Break-even live
Sensitivity live
| Price | -10% $257 | -5% $186 | +0% $116 | +5% $45 | +10% $-26 |
|---|---|---|---|---|---|
| Rent | -10% $-49 | -5% $33 | +0% $116 | +5% $198 | +10% $281 |
| Rate | -1.0pp $241 | -0.5pp $179 | base $116 | +0.5pp $51 | +1.0pp $-15 |
UW: 25.0% down · 7.5% · 30yr · 1.5% tax · 5.0% vac · 8.0% maint · 8.0% mgmt
Financing live
Cash to close
- Down payment
- $62,500
- Closing costs
- $7,500
- Reserves months
- —
- Total cash needed
- —
Loan-product check · same deal, 3 products live
Conventional
25% down · 7.5% · 30yr
- Down + closing
- —
- Monthly P&I
- —
- Monthly cashflow
- —
- DSCR
- —
- Eligible?
- —
Personal DTI + credit; lowest rate.
DSCR
20% down · 8.5% · 30yr
- Down + closing
- —
- Monthly P&I
- —
- Monthly cashflow
- —
- DSCR
- —
- Eligible?
- —
No personal income docs; deal must DSCR.
Hard money
10% down · 12.0% · 12mo
- Down + closing
- —
- Monthly P&I
- —
- Monthly cashflow
- —
- DSCR
- —
- Eligible?
- —
Short-term bridge; refi at stabilization.
Listing history 17 events
-
2026-06-21days on market $250,000 Active 26 DOM
-
2026-06-21days on market $250,000 Active 25 DOM
-
2026-06-18days on market $250,000 Active 23 DOM
-
2026-06-17days on market $250,000 Active 22 DOM
-
2026-06-16days on market $250,000 Active 21 DOM
-
2026-06-15days on market $250,000 Active 20 DOM
-
2026-06-13days on market $250,000 Active 18 DOM
-
2026-06-12days on market $250,000 Active 17 DOM
-
2026-06-09days on market $250,000 Active 14 DOM
-
2026-06-08days on market $250,000 Active 13 DOM
-
2026-06-08days on market $250,000 Active 12 DOM
-
2026-06-07days on market $250,000 Active 11 DOM
-
2026-06-04days on market $250,000 Active 8 DOM
-
2026-06-02days on market $250,000 Active 7 DOM
-
2026-06-01days on market $250,000 Active 6 DOM
-
2026-05-31days on market $250,000 Active 5 DOM
-
2026-05-26$250,000 Active
ⓘ Source: listings_history table (triggers on properties + properties_extension) + one-shot
backfill from property_details.listing_events for pre-trigger history.
Tax reassessment forecast OH · Partial reset (capped growth)
- Current annual tax
- $1,435 · $120/mo
- Projected year-2 tax
- $2,667 · $222/mo
- Expected delta
- +$1,233/yr (+$103/mo · 85.9%)
ⓘ Screening estimate from a state-policy table — verify with the county assessor before closing.
Climate risk First Street
- Flood 1/10 Low FEMA zone X (unshaded) · 0% chance over 30 yrs
- Wildfire 1/10 Low
- Heat 3/10 Moderate 7 d/yr ≥98°F today · 17 d/yr by 30 yrs out
- Wind 1/10 Low
- Air quality 2/10 Low 0 unhealthy d/yr today · 1 by 30 yrs out
Nearby sold comps map
Loading sold comps map…
Walkable amenities ~0.75 mi
Loading nearby amenities…
Taxation est. · year 1
- Rental income
- $25,068
- − Mortgage interest
- −$14,004
- − Property taxes
- −$1,435
- − Insurance
- −$1,250
- − Repairs & maintenance
- −$2,005
- − Management
- −$2,005
- − Depreciation
- −$7,273
- Taxable loss
- −$2,904
- Est. tax savings @ 24.0%
- +$697
- After-tax cash flow
- $2,084/yr
For passive investors: Depreciation is non-cash, so a rental often shows a tax loss while cash-flowing — sheltering income. Rental losses are passive: they offset passive income freely, and up to $25,000/yr can offset ordinary (W-2) income if you actively participate and your MAGI is under $100k (phasing out to $0 by $150k); unused losses carry forward. On sale, claimed depreciation is recaptured at up to 25%, and gains may owe capital-gains tax (a 1031 exchange can defer both). Figures are a year-1 estimate at your 24.0% rate — not tax advice; consult a CPA.
Schools (NCES district)
- District
- Conotton Valley Union Local
- NCES district ID
- 3904754
- Math proficiency
- 37% ▼ -18.00%
- Reading proficiency
- 42% ▼ -5.00%
- Median HH income
- $45,339
- Composite
- 33.62/100
- National rank
- #5405
- State rank
- #541 of 656 in OH
Livability — Carrollton
- Score
- 80/100
- State rank
- #131
- US rank
- #1863
Category grades
Schools grade is shown separately in the Schools card above.
Census & demographics
- County
- Carroll · 27,595 people
- Metro
- Canton-Massillon, OH
- Population (ZIP)
- 9,830
- Household income
- $66,391
- Rent vs Own
- Severe rent burden
- 7.5
Population outlook (Carroll County) Hauer SSP2
- Today (2025)
- 25,766 people
- By 2030
- 24,481 · -5.0%
- By 2040
- 21,803 · -15.4%
- By 2050
- 19,323 · -25.0%
- By 2075
- 15,205 · -41.0%
- By 2100
- 12,287 · -52.3%
Race, ethnicity, and origin ACS 2023
- Neighborhood character
- Predominantly White (96%)
- Race & ethnicity
- White 96% Two or more races 3% Hispanic / Latino 2%
- Common ancestry
- Slovak 4% Iranian 3% Romanian 2%
- Foreign-born
- 0% · Canada
- Languages at home
- 92% English-only · German/W. Germanic 6% Spanish 1% Other Indo-European 1%
Political lean MEDSL · Carroll
- 2024 margin
- Solid R (+54.7) · D 22.2% · R 77.0%
- 2008→2024 swing
- -49.9pp toward R · 2008: -4.8pp · 2024: -54.7pp
- All cycles
- 2024: R+54.7 2020: R+52.7 2016: R+46.4 2012: R+13.7 2008: R+4.8
Not yet ingested
- Civics
- —
Market trends
- HPI YoY
- ▼ -129.95%
- Current HPI
- 222.0728
- Rent YoY
- —
- Metro
- —
- State GDP YoY
- ▲ 1.98%
- F500 in state
- 48
Industry mix (Fortune 500 HQ in OH)
| Industry | F500 HQs | Revenue |
|---|---|---|
| Insurance | 3 | $145B |
|
||
| Industrial Machinery | 3 | $49B |
|
||
| Financial Services | 3 | $24B |
|
||
| Consumer Goods | 2 | $93B |
|
||
| Aerospace / Defense | 2 | $47B |
|
||
| Utilities | 2 | $33B |
|
||
Price history
1 event — show timeline
- 2026-05-26 Listed $250,000 FSBO.com
Property tax history
+4.5%/yrLatest (2025): $1,435 · +40.0% YoY. Source: county tax records.
Cash-flow waterfall
monthlySold comps — $/sqft
last 12 mo · ≤1 miLoading sold comps…