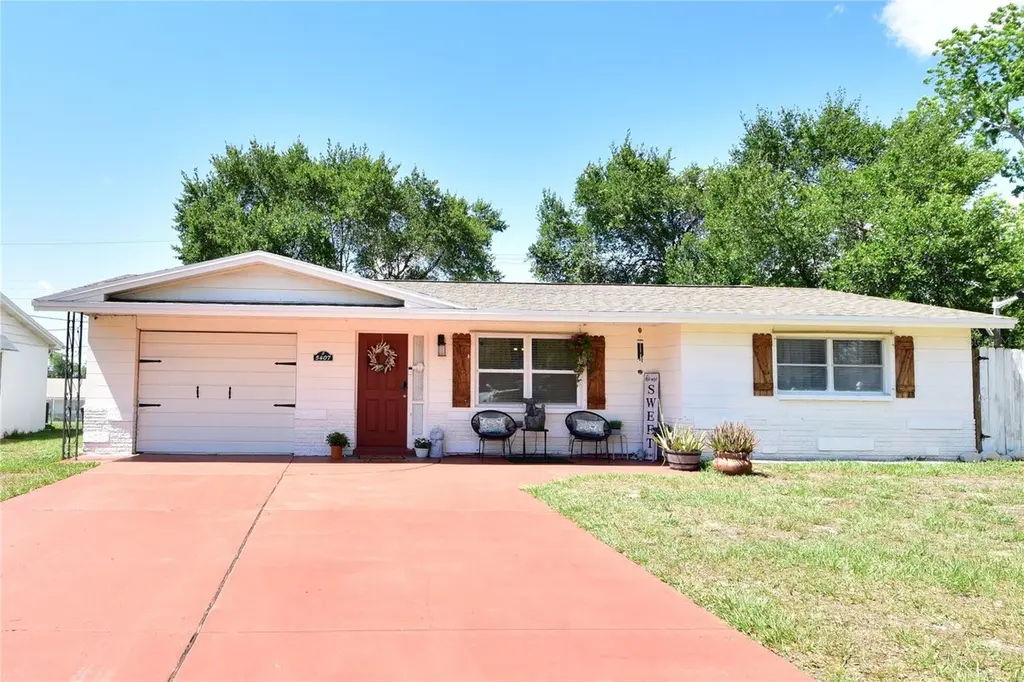
5407 Mac Arthur Ave · Elfers, FL
Flood risk 1/10 · Minimal
- FEMA flood zone
- X (unshaded)
- Chance of flooding over 30 yrs
- 0.0%
- Est. flood insurance / yr
- $507 – $1,088
Fire risk 2/10 · Minimal
- Est. fire insurance / yr
- $947 – $1,759
Heat risk 10/10 · Severe
- Hot days now (above 109°F)
- 7 days/yr
- Hot days in 30 yrs
- 29 days/yr
Wind risk 10/10 · Severe
- Chance of severe wind over 30 yrs
- 99.0%
Air-quality risk 2/10 · Minimal
- Unhealthy air days now
- 1 days/yr
- Unhealthy air days in 30 yrs
- 1 days/yr
Risk factors via First Street. Map © Google.
Why this score? — see what drove the D- grade
The composite is a weighted blend of 9 inputs, each scored 0–100. Each bar is that input's sub-score; the figure is the points it added to the 100-point composite (weight × sub-score).
- Cash flow +12.0/30.0
- ARV discount +6.1/15.0
- Schools +4.3/10.0
- Livability +3.9/5.0
- DSCR +3.5/10.0
- Rent growth +2.7/5.0
- Condition / age +2.5/5.0
- 1% rule +2.1/10.0
- Appreciation +0.0/10.0
$215,000
🖨 Deal sheet (PDF) 📄 Offer letter ✓ Due diligence
Listing remarks
Under contract-accepting backup offers. Welcome Home! Discover the perfect blend of comfort and convenience in this charming 3-bedroom, 1.5-bath home, ideally situated just 2.5 miles away from the vibrant downtown of New Port Richey, With SIMS Park (So many fabulous Festivals there). Amazing restaurants, shopping, and clubs. Did I mention New Port Richey Is a Golf cart friendly town. This stunning home is 1,070 square feet of living space; it is a true gem. Enjoy the ease of access to shopping and beaches, creating a lifestyle that combines relaxation and entertainment. What sets this property apart is its lack of HOA or deed restrictions, and NOT in a flood zone. Allowing you the freedom t
Key facts
- Not in a flood zone
- Lack of hoa
- Tiki bar
Tags
Property features AI
Finance
- Other: Living area approximately 1,070 square feet; Lot on asphalt road; Furnished negotiable
- HOA & community: No association; Street lights in community
Exterior
- Parking: Attached garage (1 car)
- Utilities: Public sewer; Water connected; Electricity connected; Cable connected; Sewer connected; Public utilities
- Home design: Single family residence; One story; South facing; Homestead property
- Construction: Block construction; Shingle roof; Slab foundation; Built on a 0.12-acre lot
- Exterior features: Lighting; Private mailbox; Shade shutters; Storage
Interior
- Kitchen: Cooktop; Dishwasher; Exhaust fan; Freezer; Ice maker; Microwave; Refrigerator; Water purifier; Solid surface counters; Eat-in kitchen
- Bedrooms: 3 bedrooms
- Flooring: Ceramic tile
- Bathrooms: 1 full bathroom; 1 half bathroom
- Heating & cooling: Central heating; Central air
- Interior features: Ceiling fans; Eat-in kitchen; Solid surface counters; Thermostat; Window treatments; Electric fireplace
- Laundry & utility: Washer; Dryer; Laundry area in garage; Electric water heater
Neighborhood map
What this means for you Summary
Snapshot
- This is a 2-bed/2.0-bath single-family listed at $215k.
Deal economics
- At list price, monthly cash flow is $-51 ($-612/yr) — negative.
- To cash-flow at today's rent, offer at most $206k (4.2% below list).
- To meet the 1% rule (rent ≥ 1% of price), the offer needs to be $153k (28.7% below list).
- Recommended offer: $153k (28.7% below list) — sets the bar for 1% rule.
- Cap rate 6.0% vs local median 4.6% in Elfers — top-decile yield for the area; either an underpriced asset or a hidden risk that comps aren't pricing in. Stress-test before assuming the spread holds.
Location & tenants
- Location reads 78/100 on livability (#167 in FL, #2,486 nationally) — a middle-class / working-renter tenant base. Strengths: cost of living A+, housing A+, health & safety A+; Watch: crime C-, employment D+, amenities D-.
- Pasco (suburban): math 50% / reading 52% proficiency, ranked #32 of 73 in FL (top 44%) — acceptable for families but not a draw, mixed tenant base, ~2y average lease.
- Zoned schools: Mittye P. Locke Elementary School (math 35% / reading 39%, grade F, #1,609 of 2,144 statewide, top 77%, 491 students, 89% FRL); Gulf Middle School (math 34% / reading 33%, grade F, #428 of 571 statewide, top 76%, 901 students, 83% FRL); Gulf High School (math 32% / reading 34%, grade F, #406 of 667 statewide, top 61%, 1,465 students, 76% FRL) — zoned schools average 83% FRL vs 48% district-wide (34 pts higher); higher-poverty schools than district average — tighter screening recommended.
- Zoned-school proficiency averages 34% at this address vs 51% district-wide (-16 pts) — the specific schools serving this property underperform the Pasco average; the district grade overstates school quality for this exact location.
- Market conditions: Rents flat; 644 active listings in the ZIP; 40 comparable units currently listed for rent nearby; rentals at typical pace (median 20d on market — plan ~3-4 weeks tenant-placement turnaround); 6,765 units permitted in Pasco County in 2024 (1,250 in 5+ unit buildings).
- This rent runs 32% of the median local income ($57k/yr) — at the standard rent-burdened threshold; future hikes will face affordability resistance.
Forward outlook
- Local home prices are declining (-3.0%/yr); year-one equity from $1k of loan paydown is wiped out by about $6k of value loss. Plan a longer hold.
- Pasco County population projected at +29% by 2050 — long-run rental-demand tailwind backs the buy-and-hold thesis.
Negotiation context
- Only 5 days on market — expect competitive offers; lowballing is unlikely to land.
- 6 sale attempts since 19y ago with the ask held roughly flat each time — persistent listings suggest the price (not the market) is what's stuck; bring a comps-based counter.
- Current owner paid $29k; list at $215k implies a 641% gain — meaningful room to come down on a strong offer.
Risks & watch-outs
- Climate carrying-cost: severe wind risk, 99% chance of damaging wind over 30y; extreme-heat days projected 7→29/yr by 2055 (HVAC capex compounding) — expect insurance premiums to compound above CPI over the hold.
Questions for the listing agent
- What do current leases actually rent for vs. the listed asking? Can we see a recent rent roll and the last 12 months of T-12 income?
- Built in 1967 — when were the roof, HVAC, electrical panel, plumbing, and water heater last replaced?
- Is there a deadline driving the sale (1031 exchange, divorce, estate, relocation)? That informs how much negotiation room exists.
- The area grade is low — what's the realistic commute time and amenity access for the typical tenant pool here? Any planned neighborhood developments (good or bad) we should know about?
- What's the average days-on-market for RENTAL listings here right now (not sales)? A rising rental-DOM trend means longer vacancies and softer asking-rent achievability than the comps imply.
- What's the recent tenant-quality profile in this submarket — average credit score on applications, eviction rate, late-payment / NSF rate, and stable-employment percentage? A property-management company in the area should have these aggregated.
- How much new for-sale + rental construction is in the pipeline within 1–3 miles? Heavy new supply typically softens prices + rents 12–24 months out; constrained supply supports both.
Investment metrics
- 1% rule
- 0.71% ✗
- Cap rate
- 6.01%
- Cash-on-cash
- -1.02%
- DSCR
- 0.95
- GRM
- 11.7
CMA / ARV
- ARV (on-the-fly)
- $208,650
- Comps found
- 12
Show comp detail 12 sales within ~0.75 mi
| Address | Dist | Beds/Ba | Sqft | Sold | Price | $/sf | Match |
|---|---|---|---|---|---|---|---|
| 5407 Mac Arthur Ave | 0.00mi | 3/1.5 (+1) | 1,070 (0%) | 0mo | $213,000 | $199 | 93 |
| 4445 Spring Lake Ct | 0.15mi | 2/1.0 | 1,025 (-4%) | 3mo | $200,000 | $195 | 80 |
| 4526 Annette St | 0.09mi | 3/1.0 (+1) | 1,132 (+6%) | 4mo | $210,000 | $186 | 73 |
| 5753 10th Ave | 0.39mi | 3/1.5 (+1) | 1,088 (+2%) | 2mo | $259,900 | $239 | 70 |
| 5205 Drift Tide Dr | 0.43mi | 3/2.0 (+1) | 1,044 (-2%) | 2mo | $225,000 | $216 | 69 |
| 4437 Terry Loop | 0.39mi | 2/1.5 | 1,180 (+10%) | 2mo | $211,000 | $179 | 61 |
| 4607 Pirate Pl | 0.39mi | 2/1.0 | 960 (-10%) | 4mo | $150,000 | $156 | 57 |
| 4407 Terry Loop | 0.36mi | 2/1.0 | 1,206 (+13%) | 2mo | $119,340 | $99 | 56 |
| 5646 Dahlia Ave | 0.34mi | 2/2.0 | 1,212 (+13%) | 6mo | $195,000 | $161 | 56 |
| 5203 Overton Dr | 0.72mi | 2/1.5 | 1,128 (+5%) | 1mo | $235,000 | $208 | 55 |
| 4615 Irene Loop | 0.64mi | 3/1.5 (+1) | 988 (-8%) | 4mo | $189,950 | $192 | 48 |
| 4173 Highland Loop | 0.59mi | 3/2.0 (+1) | 1,215 (+14%) | 4mo | $243,400 | $200 | 42 |
Match score weights: distance 35% · size 25% · config 20% · recency 20%. Top-matched comps best support the ARV.
Projected returns pro-forma
-3.0% appreciation · 0.72% rent growth · sell at horizon
- IRR
- -20.2%
- Equity multiple
- 0.31×
- Total profit
- $-41,641
- Equity at exit
- $32,057
- IRR
- -18.3%
- Equity multiple
- 0.10×
- Total profit
- $-54,386
- Equity at exit
- $18,589
Cash invested: $60,200 (down + closing). Projections, not guarantees.
Landlord ↔ Tenant lean methodology
- Overall (STATE)
- 87 Strongly Landlord-Friendly
- State Florida
- 87 Strongly Landlord-Friendly · R+3
- County
- — inherits STATE
- City
- — inherits STATE
ZIP-level market 34652
- Home prices YoY
- -26.1%
- Rents YoY
- 0.7%
- Active inventory
- 644
- Price-to-rent
- 11.7×
Monthly cashflow live
- Estimated rent
- $1,533 high interval (Pro) →
- Mortgage (P&I)
- −$1,127
- Tax from tax record
- −$45 /mo · $538/yr
- Insurance
- −$90
- HOA
- −$0
- Vacancy / Maint / Mgmt
- −$322
- Net cashflow
- $-51
Break-even live
Sensitivity live
| Price | -10% $71 | -5% $10 | +0% $-51 | +5% $-112 | +10% $-173 |
|---|---|---|---|---|---|
| Rent | -10% $-172 | -5% $-112 | +0% $-51 | +5% $10 | +10% $70 |
| Rate | -1.0pp $57 | -0.5pp $4 | base $-51 | +0.5pp $-107 | +1.0pp $-163 |
UW: 25.0% down · 7.5% · 30yr · 1.5% tax · 5.0% vac · 8.0% maint · 8.0% mgmt
Financing live
Cash to close
- Down payment
- $53,750
- Closing costs
- $6,450
- Reserves months
- —
- Total cash needed
- —
Loan-product check · same deal, 3 products live
Conventional
25% down · 7.5% · 30yr
- Down + closing
- —
- Monthly P&I
- —
- Monthly cashflow
- —
- DSCR
- —
- Eligible?
- —
Personal DTI + credit; lowest rate.
DSCR
20% down · 8.5% · 30yr
- Down + closing
- —
- Monthly P&I
- —
- Monthly cashflow
- —
- DSCR
- —
- Eligible?
- —
No personal income docs; deal must DSCR.
Hard money
10% down · 12.0% · 12mo
- Down + closing
- —
- Monthly P&I
- —
- Monthly cashflow
- —
- DSCR
- —
- Eligible?
- —
Short-term bridge; refi at stabilization.
Rent comps 40 comps
| Address | Beds | Baths | Sqft | Rent | $/sqft | DOM | Units | Dist |
|---|---|---|---|---|---|---|---|---|
| 4540 Audrey Ln New Port Richey, FL | 2.0 | 1.0 | 750 | $1,150 | $1.53 | 26d | 1 | 0.14mi |
| 4551 Audrey Ln NEW PRT RCHY, FL | 2.0 | 1.0 | 750 | $1,295 | $1.73 | 23d | 1 | 0.14mi |
| 4529 Audrey Ln New Port Richey, FL | 2.0 | 1.0 | 750 | $1,295 | $1.73 | 23d | 1 | 0.16mi |
| 4518 Audrey Ln Unit 4551 New Port Richey, FL | 2.0 | 1.0 | 750 | $1,295 | $1.73 | 23d | 1 | 0.17mi |
| 4746 Azalea Dr Apt 103C Port Richey, FL | 2.0 | 2.0 | 1008 | $1,220 | $1.21 | 26d | 1 | 0.19mi |
| 4744 Azalea Dr #204 New Port Richey, FL | 1.0 | 1.0 | 736 | $1,085 | $1.47 | 0d | 1 | 0.21mi |
| 4747 Azalea Dr #208 New Port Richey, FL | 2.0 | 2.0 | 1128 | $1,200 | $1.06 | 19d | 1 | 0.23mi |
| 4548 Belfast Dr New Port Richey, FL | 3.0 | 1.0 | 1075 | $1,575 | $1.47 | 19d | 1 | 0.27mi |
| 4554 Nimmer Dr New Port Richey, FL | 3.0 | 2.0 | 1180 | $1,600 | $1.36 | 16d | 1 | 0.32mi |
| 5720 Salt Kettle Ct New Port Richey, FL | 3.0 | 2.0 | 1400 | $900 | $0.64 | 19d | 1 | 0.34mi |
| 4938 Azalea Dr New Port Richey, FL | 2.0 | 1.0 | 870 | $2,000 | $2.30 | 26d | 1 | 0.37mi |
| 4737 Alcea St New Port Richey, FL | 3.0 | 2.0 | 1270 | $2,250 | $1.77 | 4d | 1 | 0.38mi |
| 5319 Drift Tide Dr New Port Richey, FL | 2.0 | 1.5 | 1142 | $1,500 | $1.31 | 12d | 1 | 0.38mi |
| 5227 Tangerine Dr New Port Richey, FL | 2.0 | 1.5 | 996 | $1,500 | $1.51 | 14d | 1 | 0.43mi |
| 5403 Tangerine Dr New Port Richey, FL | 2.0 | 1.0 | 962 | $1,750 | $1.82 | 1d | 1 | 0.43mi |
| 4117 Highland Loop New Port Richey, FL | 3.0 | 2.0 | 1384 | $1,599 | $1.16 | 14d | 1 | 0.50mi |
| 4939 Floramar Ter New Port Richey, FL | 2.0 | 2.0 | 1050 | $1,648 | $1.57 | 18d | 3 | 0.55mi |
| 4939 Floramar Ter New Port Richey, FL | 2.0 | 2.0 | 1050 | $1,675 | $1.60 | 26d | 2 | 0.55mi |
| 4939 Floramar Ter New Port Richey, FL | 2.0 | 2.0 | 1050 | $1,600 | $1.52 | 3d | 2 | 0.55mi |
| 5020 Vickers Dr New Port Richey, FL | 2.0 | 1.0 | 863 | $1,495 | $1.73 | 1d | 1 | 0.58mi |
| 4645 Irene Loop New Port Richey, FL | 3.0 | 1.0 | 1158 | $1,700 | $1.47 | 1d | 1 | 0.59mi |
| 4616 Irene Loop New Port Richey, FL | 2.0 | 1.0 | 898 | $1,600 | $1.78 | 21d | 1 | 0.62mi |
| 4540 Irene Loop New Port Richey, FL | 2.0 | 1.0 | 768 | $1,550 | $2.02 | 26d | 1 | 0.63mi |
| 4721 Naftis Ln New Port Richey, FL | 3.0 | 2.0 | 1104 | $1,700 | $1.54 | 14d | 1 | 0.68mi |
| 5197 Silent Loop New Port Richey, FL | 2.0 | 2.0 | 956 | $2,200 | $2.30 | 5d | 1 | 0.71mi |
| 5197 Silent Loop #124 New Port Richey, FL | 2.0 | 2.0 | 956 | $2,200 | $2.30 | 26d | 1 | 0.71mi |
| 4124 Flamingo Dr New Port Richey, FL | 3.0 | 1.0 | 744 | $1,500 | $2.02 | 5d | 1 | 0.72mi |
| 4124 Flamingo Dr New Port Richey, FL | 3.0 | 1.0 | 744 | $1,500 | $2.02 | 16d | 1 | 0.72mi |
| 5132 Amulet Dr #107 New Port Richey, FL | 1.0 | 1.0 | 928 | $1,395 | $1.50 | 14d | 1 | 0.73mi |
| 5154 Turquoise Ln #102 New Port Richey, FL | 1.0 | 1.0 | 708 | $1,250 | $1.77 | 6d | 1 | 0.74mi |
| 4854 Marine Pkwy #103 New Port Richey, FL | 1.0 | 2.0 | 1088 | $1,500 | $1.38 | 26d | 1 | 0.76mi |
| 4847 Elmwood St New Port Richey, FL | 2.0 | 1.0 | 1039 | $1,595 | $1.54 | 0d | 1 | 0.77mi |
| 6036 Chesham Dr #5 New Port Richey, FL | 2.0 | 1.5 | 825 | $1,275 | $1.55 | 6d | 1 | 0.80mi |
| 4754 Marine Pkwy Unit 102-I New Port Richey, FL | 2.0 | 2.0 | 1088 | $1,500 | $1.38 | 26d | 1 | 0.84mi |
| 4754 Marine Pkwy Unit 2 New Port Richey, FL | 3.0 | 2.0 | 1312 | $1,750 | $1.33 | 16d | 1 | 0.84mi |
| 4944 Elkner St New Port Richey, FL | 2.0 | 1.0 | 722 | $1,350 | $1.87 | 23d | 1 | 0.84mi |
| 6141 Chesham Dr #8 New Port Richey, FL | 2.0 | 1.5 | 825 | $1,250 | $1.52 | 26d | 1 | 0.87mi |
| 4948 Getner St New Port Richey, FL | 2.0 | 1.0 | 722 | $1,350 | $1.87 | 26d | 1 | 0.88mi |
| 4852 Pompano Dr New Port Richey, FL | 2.0 | 2.0 | 1104 | $2,900 | $2.63 | 26d | 1 | 0.88mi |
| 4753 Marine Pkwy Unit 4753 New Port Richey, FL | 2.0 | 2.0 | 1100 | $1,600 | $1.45 | 26d | 1 | 0.90mi |
Listing history 12 events
-
2026-05-20status Pending
-
2026-05-15$215,000 Active
-
2023-09-22status Pending
-
2023-09-22historical
-
2023-09-12$236,000 Active
-
2022-09-14$236,000 Active
-
2010-11-12soldstatus $29,000
-
2010-10-20$29,999
-
2007-12-14$84,877
-
2007-12-14historical
-
2007-09-24$94,877
-
2003-11-07soldstatus $72,000
ⓘ Source: listings_history table (triggers on properties + properties_extension) + one-shot
backfill from property_details.listing_events for pre-trigger history.
Tax reassessment forecast FL · Resets to sale price
- Current annual tax
- $538 · $45/mo
- Projected year-2 tax
- $1,784 · $149/mo
- Expected delta
- +$1,247/yr (+$104/mo · 231.8%)
ⓘ Screening estimate from a state-policy table — verify with the county assessor before closing.
Climate risk First Street
- Flood 1/10 Low FEMA zone X (unshaded) · 0% chance over 30 yrs
- Wildfire 2/10 Low
- Heat 10/10 Extreme 7 d/yr ≥109°F today · 29 d/yr by 30 yrs out
- Wind 10/10 Extreme 99% chance of damaging wind over 30 yrs
- Air quality 2/10 Low 1 unhealthy d/yr today · 1 by 30 yrs out
Nearby sold comps map
Loading sold comps map…
Walkable amenities ~0.75 mi
Loading nearby amenities…
Taxation est. · year 1
- Rental income
- $18,393
- − Mortgage interest
- −$12,043
- − Property taxes
- −$538
- − Insurance
- −$1,075
- − Repairs & maintenance
- −$1,471
- − Management
- −$1,471
- − Depreciation
- −$6,255
- Taxable loss
- −$4,461
- Est. tax savings @ 24.0%
- +$1,071
- After-tax cash flow
- $458/yr
For passive investors: Depreciation is non-cash, so a rental often shows a tax loss while cash-flowing — sheltering income. Rental losses are passive: they offset passive income freely, and up to $25,000/yr can offset ordinary (W-2) income if you actively participate and your MAGI is under $100k (phasing out to $0 by $150k); unused losses carry forward. On sale, claimed depreciation is recaptured at up to 25%, and gains may owe capital-gains tax (a 1031 exchange can defer both). Figures are a year-1 estimate at your 24.0% rate — not tax advice; consult a CPA.
Schools (NCES district)
- District
- Pasco
- NCES district ID
- 1201530
- Math proficiency
- 50% ▼ -10.00%
- Reading proficiency
- 52% ▼ -5.00%
- Median HH income
- $45,039
- Composite
- 43.14/100
- National rank
- #3074
- State rank
- #32 of 73 in FL
Livability — Elfers
- Score
- 78/100
- State rank
- #167
- US rank
- #2486
Category grades
Schools grade is shown separately in the Schools card above.
Census & demographics
- Census place
- Elfers, FL
- County
- Pasco County · 524,098 people
- Metro
- Tampa-St. Petersburg-Clearwater, FL
- Population (ZIP)
- 27,444
- Household income
- $56,931
- Rent vs Own
- Severe rent burden
- 1190.0
Population outlook (Pasco County) Hauer SSP2
- Today (2025)
- 570,045 people
- By 2030
- 605,844 · +6.3%
- By 2040
- 674,806 · +18.4%
- By 2050
- 736,022 · +29.1%
- By 2075
- 862,900 · +51.4%
- By 2100
- 906,364 · +59.0%
Race, ethnicity, and origin ACS 2023
- Neighborhood character
- Predominantly White (78%)
- Race & ethnicity
- White 78% Hispanic / Latino 13% Two or more races 9% Black 4%
- Hispanic origin (detail)
- Mexican 3% Puerto Rican 4% Cuban 4%
- Common ancestry
- Romanian 4% Lithuanian 3% Slovak 2%
- Foreign-born
- 9% · Canada
- Languages at home
- 87% English-only · Spanish 9% Other Indo-European 1% Russian/Polish/Slavic 1%
Political lean MEDSL · Pasco
- 2024 margin
- Strong R (+25.2) · D 36.9% · R 62.1% · Other 1.0%
- 2008→2024 swing
- -21.6pp toward R · 2008: -3.6pp · 2024: -25.2pp
- All cycles
- 2024: R+25.2 2020: R+20.1 2016: R+21.6 2012: R+6.7 2008: R+3.6
Not yet ingested
- Civics
- —
Market trends
- HPI YoY
- ▼ -109.49%
- Current HPI
- 310.8347
- Rent YoY
- ▲ 0.72%
- Metro
- Tampa-St. Petersburg-Clearwater, FL
- State GDP YoY
- ▲ 3.28%
- F500 in state
- 36
Industry mix (Fortune 500 HQ in FL)
| Industry | F500 HQs | Revenue |
|---|---|---|
| Industrial Technology | 2 | $29B |
|
||
| Insurance | 2 | $17B |
|
||
| Retail | 1 | $60B |
|
||
| Technology Distribution | 1 | $58B |
|
||
| Homebuilding | 1 | $35B |
|
||
| Technology Manufacturing | 1 | $35B |
|
||
Price history
+198.6% since first listed12 events — show timeline
- 2026-05-20 Pending — Stellar MLS as Distributed by MLS Grid
- 2026-05-15 Listed $215,000 Stellar MLS as Distributed by MLS Grid
- 2023-09-22 Pending — Stellar MLS as Distributed by MLS Grid
- 2023-09-22 Listing Removed — Stellar MLS as Distributed by MLS Grid
- 2023-09-12 Listed $236,000 Stellar MLS as Distributed by MLS Grid
- 2022-09-14 Listed $236,000 Stellar MLS as Distributed by MLS Grid
- 2010-11-12 Sold (MLS) $29,000 Stellar MLS as Distributed by MLS Grid
- 2010-10-20 Listed $29,999 Stellar MLS as Distributed by MLS Grid
- 2007-12-14 Listing Removed — Stellar MLS as Distributed by MLS Grid
- 2007-12-14 Listed $84,877 Stellar MLS as Distributed by MLS Grid
- 2007-09-24 Listed $94,877 Stellar MLS as Distributed by MLS Grid
- 2003-11-07 Sold (Public Records) $72,000 Public Records
Property tax history
-0.4%/yrLatest (2025): $538 · +5.0% YoY. Source: county tax records.
Cash-flow waterfall
monthlySold comps — $/sqft
last 12 mo · ≤1 miLoading sold comps…