 Duplex
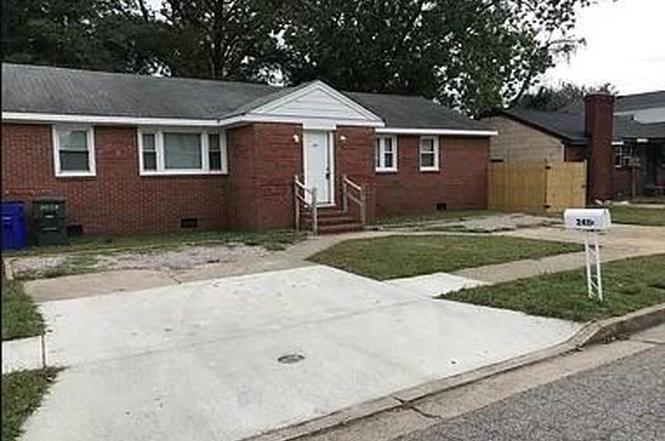
2411 Wyoming Ave · Norfolk, VA
Flood risk 3/10 · Minor
- FEMA flood zone
- X (unshaded)
- Chance of flooding over 30 yrs
- 0.1%
- Est. flood insurance / yr
- $507 – $1,088
Fire risk 1/10 · Minimal
- Est. fire insurance / yr
- $666 – $1,236
Heat risk 9/10 · Severe
- Hot days now (above 105°F)
- 7 days/yr
- Hot days in 30 yrs
- 16 days/yr
Wind risk 8/10 · Major
- Chance of severe wind over 30 yrs
- 80.0%
Air-quality risk 3/10 · Minor
- Unhealthy air days now
- 2 days/yr
- Unhealthy air days in 30 yrs
- 3 days/yr
Risk factors via First Street. Map © Google.
Why this score? — see what drove the C grade
The composite is a weighted blend of 9 inputs, each scored 0–100. Each bar is that input's sub-score; the figure is the points it added to the 100-point composite (weight × sub-score).
- Cash flow +20.3/30.0
- ARV discount +13.0/15.0
- DSCR +6.4/10.0
- 1% rule +5.1/10.0
- Livability +4.2/5.0
- Schools +3.5/10.0
- Rent growth +3.4/5.0
- Condition / age +2.5/5.0
- Appreciation +0.0/10.0
$270,000
🖨 Deal sheet 📄 Offer letter ✓ Due diligence
Multi-family units
County records classify this as Multi-Family (2-4 Unit). Listing-text estimate: 2 units. confirmed
Listing remarks
Back On the Market - NO fault of the Seller! Brick side-by-side duplex. Both sides occupied with good tenants. Great location. Both bathrooms renovated with tile floors and tub surround. Left unit kitchen newer. Brand new roof 2026. Photos were taken before tenants moved in.
Key facts
- Tile floors
- Brand new roof
- Built 1963
Tags
Neighborhood map
What this means for you Summary
Snapshot
- This is a 2 × 2-bed/1.0-bath units multifamily listed at $270k.
Deal economics
- At list price, monthly cash flow is $345 ($4k/yr) — positive. Per door: $173/mo.
- The deal already cash-flows at list — no discount required.
- Meets the 1% rule at list price ($3k rent vs $270k).
- Recommended offer: $254k (6.0% below list) — sets the bar for market timing.
- Cap rate 7.8% vs local median 4.0% in Norfolk — top-decile yield for the area; either an underpriced asset or a hidden risk that comps aren't pricing in. Stress-test before assuming the spread holds.
Location & tenants
- Location reads 83/100 on livability (#43 in VA, #1,026 nationally) — a professional / high-income tenant draw. Strengths: amenities A+, commute A+, health & safety A+; Watch: employment C-, crime F.
- Norfolk City Public School District (urban): math 27% / reading 56% proficiency, ranked #118 of 131 in VA (top 90%) — families likely to look elsewhere, expect single-tenant / working-renter base with shorter leases.
- Zoned schools: Coleman Place Elementary (math 13% / reading 38%, grade F, #1,046 of 1,108 statewide, top 95%, 617 students, 98% FRL); Booker T Washington High (math 26% / reading 70%, grade D, #303 of 319 statewide, top 95%, 947 students, 94% FRL) — zoned schools average 96% FRL vs 59% district-wide (37 pts higher); higher-poverty schools than district average — tighter screening recommended.
- Market conditions: Rents rising (+3.4%/yr); 132 active listings in the ZIP; 32 comparable units currently listed for rent nearby; rentals at typical pace (median 24d on market — plan ~3-4 weeks tenant-placement turnaround); 47% of comp listings sitting > 30 days — soft ceiling on asking rent; 438 units permitted in Norfolk city in 2024 (273 in 5+ unit buildings).
- At $2,731/mo this rent would consume 48% of the median local household income ($68k/yr) (locally 1342% of renters already pay >50% of income on rent) — very limited rent-growth headroom before tenants either downsize or default.
Forward outlook
- Local home prices are declining (-3.0%/yr); year-one equity from $2k of loan paydown is wiped out by about $8k of value loss. Plan a longer hold.
Negotiation context
- It's been on market 86 days — a 6% lower offer ($254k) is reasonable based on typical stale-listing flexibility.
- Current owner paid $100k; list at $270k implies a 170% gain — meaningful room to come down on a strong offer.
Risks & watch-outs
- Climate carrying-cost: severe wind risk, 80% chance of damaging wind over 30y; extreme-heat days projected 7→16/yr by 2055 (HVAC capex compounding) — expect insurance premiums to compound above CPI over the hold.
Questions for the listing agent
- It's been on market 86 days. Have you received any prior offers? Is the seller open to a 6% concession, seller financing, or rate buy-down credit?
- Can we see the unit-by-unit rent roll, current vacancy, and any below-market leases? What's the average tenancy length?
- What capital expenditures (roof, boiler, parking lot, exteriors) have been made in the last 5 years, and what's planned in the next 2?
- Built in 1963 — when were the roof, HVAC, electrical panel, plumbing, and water heater last replaced?
- Why hasn't it sold? Are there any deal-killer items the seller is aware of (foundation, flood, title, zoning, code violations)?
- Is there a deadline driving the sale (1031 exchange, divorce, estate, relocation)? That informs how much negotiation room exists.
- Schools are A-rated — typically a magnet for longer-tenancy family renters. What's the average tenant stay here, and is there a school-zone premium baked into asking?
- Crime grade is F in this area — have there been break-ins, vandalism, or insurance claims at this property in the last 3 years? What carrier currently insures it and at what premium?
- What's the average days-on-market for RENTAL listings here right now (not sales)? A rising rental-DOM trend means longer vacancies and softer asking-rent achievability than the comps imply.
- What's the recent tenant-quality profile in this submarket — average credit score on applications, eviction rate, late-payment / NSF rate, and stable-employment percentage? A property-management company in the area should have these aggregated.
- How much new apartment / multifamily construction is in the pipeline within 1–3 miles? Heavy new supply (>2% of stock underway) typically softens rents 12–24 months out; light construction supports rent growth.
Investment metrics
- 1% rule
- 1.01% ✓
- Cap rate
- 7.83%
- Cash-on-cash
- 5.48%
- DSCR
- 1.24
- GRM
- 8.2
CMA / ARV
- ARV (on-the-fly)
- $307,272
- Comps found
- 6
Show comp detail 6 sales within ~0.75 mi
| Address | Dist | Beds/Ba | Sqft | Sold | Price | $/sf | Match |
|---|---|---|---|---|---|---|---|
| 2517 Nevada Ave | 0.15mi | 4/2.0 | 1,624 (-2%) | 12mo | $275,000 | $169 | 80 |
| 3702 Cape Henry Ave | 0.15mi | 4/2.0 | 1,450 (-12%) | 1mo | $300,000 | $207 | 71 |
| 1523 Rush St | 0.28mi | 4/2.0 | 1,508 (-9%) | 5mo | $260,000 | $172 | 68 |
| 1557 Hemlock St | 0.42mi | 4/2.0 | 1,590 (-4%) | 10mo | $295,000 | $186 | 66 |
| 1553 Hemlock St | 0.43mi | 4/2.0 | 1,590 (-4%) | 10mo | $295,000 | $186 | 65 |
| 1552 Birch St | 0.50mi | 4/2.0 | 1,600 (-3%) | 8mo | $260,000 | $163 | 65 |
Match score weights: distance 35% · size 25% · config 20% · recency 20%. Top-matched comps best support the ARV.
Projected returns pro-forma
-3.0% appreciation · 3.42% rent growth · sell at horizon
- IRR
- -7.3%
- Equity multiple
- 0.73×
- Total profit
- $-20,601
- Equity at exit
- $40,258
- IRR
- 2.7%
- Equity multiple
- 1.20×
- Total profit
- $15,197
- Equity at exit
- $23,345
Cash invested: $75,600 (down + closing). Projections, not guarantees.
Landlord ↔ Tenant lean methodology
- Overall (STATE)
- 55 Moderately Landlord-Leaning
- State Virginia
- 55 Moderately Landlord-Leaning · D+2
- County
- — inherits STATE
- City
- — inherits STATE
ZIP-level market 23513
- Home prices YoY
- -9.3%
- Rents YoY
- 3.4%
- Active inventory
- 132
- Price-to-rent
- 16.5×
Monthly cashflow live
- Estimated rent
- $2,731 high interval (Pro) →
- Mortgage (P&I)
- −$1,416
- Tax from tax record
- −$284 /mo · $3,407/yr
- Insurance
- −$112
- HOA
- −$0
- Vacancy / Maint / Mgmt
- −$574
- Net cashflow
- $345
Break-even live
2-unit breakdown (identical units grouped — click to expand)
| Units | Beds | Baths | Est. rent |
|---|---|---|---|
| 2× units | 2 | 1 | $2,732 |
| #1 | 2 | 1 | $1,366 |
| #2 | 2 | 1 | $1,366 |
| Total (2 units) | $2,731 | ||
UW: 25.0% down · 7.5% · 30yr · 1.5% tax · 5.0% vac · 8.0% maint · 8.0% mgmt
Financing live
Cash to close
- Down payment
- $67,500
- Closing costs
- $8,100
- Reserves months
- —
- Total cash needed
- —
Loan-product check · same deal, 3 products live
Conventional
25% down · 7.5% · 30yr
- Down + closing
- —
- Monthly P&I
- —
- Monthly cashflow
- —
- DSCR
- —
- Eligible?
- —
Personal DTI + credit; lowest rate.
DSCR
20% down · 8.5% · 30yr
- Down + closing
- —
- Monthly P&I
- —
- Monthly cashflow
- —
- DSCR
- —
- Eligible?
- —
No personal income docs; deal must DSCR.
Hard money
10% down · 12.0% · 12mo
- Down + closing
- —
- Monthly P&I
- —
- Monthly cashflow
- —
- DSCR
- —
- Eligible?
- —
Short-term bridge; refi at stabilization.
Rent comps 32 comps
| Address | Beds | Baths | Sqft | Rent | $/sqft | DOM | Units | Dist |
|---|---|---|---|---|---|---|---|---|
| 2531 Vincent Ave Norfolk, VA | 3.0 | 2.0 | 1600 | $2,195 | $1.37 | 43d | 1 | 0.42mi |
| 1531 Spruce St Unit B Norfolk, VA | 3.0 | 2.0 | 1304 | $1,600 | $1.23 | 23d | 1 | 0.54mi |
| 1531 Spruce St Unit B Norfolk, VA | 3.0 | 2.0 | 1304 | $1,600 | $1.23 | 43d | 1 | 0.54mi |
| 2815 Keller Ave Norfolk, VA | 3.0 | 2.0 | 1210 | $2,250 | $1.86 | 4d | 1 | 0.62mi |
| 3126 Marne Ave Norfolk, VA | 5.0 | 2.0 | 1943 | $3,000 | $1.54 | 43d | 1 | 0.78mi |
| 2660 Chesapeake Blvd Norfolk, VA | 3.0 | 2.0 | 1375 | $2,100 | $1.53 | 17d | 1 | 0.80mi |
| 3640 Robin Hood Rd Norfolk, VA | 4.0 | 2.5 | 1400 | $2,999 | $2.14 | 17d | 1 | 0.80mi |
| 3477 E Bonner Dr Norfolk, VA | 3.0 | 1.0 | 1304 | $2,000 | $1.53 | 23d | 1 | 0.82mi |
| 3653 Nottaway St Norfolk, VA | 3.0 | 1.5 | 1564 | $2,200 | $1.41 | 17d | 1 | 0.83mi |
| 4563 Shoshone Ct Norfolk, VA | 3.0 | 2.0 | 1600 | $2,500 | $1.56 | 43d | 1 | 0.92mi |
| 2914 Peronne Ave Norfolk, VA | 4.0 | 2.0 | 1764 | $2,495 | $1.41 | 23d | 1 | 0.95mi |
| 1562 Norcova Ave Norfolk, VA | 3.0 | 1.0 | 1288 | $2,000 | $1.55 | 17d | 1 | 0.95mi |
| 3504 Chesapeake Blvd Norfolk, VA | 3.0 | 2.0 | 1624 | $1,995 | $1.23 | 43d | 1 | 0.99mi |
| 3504 Chesapeake Blvd Norfolk, VA | 3.0 | 2.0 | 1624 | $1,995 | $1.23 | 23d | 1 | 0.99mi |
| 2605 Bapaume Ave Norfolk, VA | 3.0 | 2.0 | 2004 | $2,295 | $1.15 | 43d | 1 | 1.04mi |
| 3541 Chesapeake Blvd Norfolk, VA | 5.0 | 1.0 | 1476 | $1,275 | $0.86 | 7d | 1 | 1.09mi |
| 1323 W Norcova Dr Norfolk, VA | 3.0 | 1.0 | 1410 | $2,500 | $1.77 | 43d | 1 | 1.11mi |
| 2640 Azalea Garden Rd Norfolk, VA | 3.0 | 1.5 | 1100 | $2,150 | $1.95 | 4d | 1 | 1.12mi |
| 2729 Somme Ave Norfolk, VA | 3.0 | 2.5 | 1524 | $2,295 | $1.51 | 14d | 1 | 1.16mi |
| 2201 Pershing Ave Norfolk, VA | 3.0 | 2.5 | 1455 | $2,250 | $1.55 | 4d | 1 | 1.17mi |
| 1403 Lead St Norfolk, VA | 4.0 | 2.5 | 1854 | $2,550 | $1.38 | 43d | 1 | 1.19mi |
| 3521 Brest Ave Norfolk, VA | 3.0 | 2.0 | 1234 | $2,300 | $1.86 | 43d | 1 | 1.21mi |
| 3301 Vimy Ridge Ave Norfolk, VA | 4.0 | 2.0 | 1300 | $2,150 | $1.65 | 4d | 1 | 1.24mi |
| 2700 Myrtle Ave Norfolk, VA | 3.0 | 3.0 | 1888 | $2,600 | $1.38 | 43d | 1 | 1.27mi |
| 1022 Kenton Ave Norfolk, VA | 3.0 | 2.0 | 1400 | $2,400 | $1.71 | 10d | 1 | 1.27mi |
| 1801 Saint Denis Ave Unit 3 Norfolk, VA | 4.0 | 2.0 | 1500 | $2,400 | $1.60 | 23d | 1 | 1.28mi |
| 2529 Tidewater Dr Norfolk, VA | 3.0 | 2.5 | 2025 | $2,370 | $1.17 | 23d | 1 | 1.32mi |
| 1714 Bellevue Ave Norfolk, VA | 3.0 | 1.5 | 1500 | $1,799 | $1.20 | 43d | 1 | 1.33mi |
| 1801 Lasalle Ave Norfolk, VA | 3.0 | 1.0 | 1102 | $1,880 | $1.71 | 44d | 1 | 1.33mi |
| 1751 Fontainebleau Cres Norfolk, VA | 3.0 | 2.0 | 1231 | $2,350 | $1.91 | 43d | 1 | 1.40mi |
| 3414 Tidewater Dr Norfolk, VA | 4.0 | 2.5 | 2200 | $3,000 | $1.36 | 43d | 1 | 1.40mi |
| 1320 Gabriel Dr Norfolk, VA | 4.0 | 1.5 | 1812 | $2,495 | $1.38 | 43d | 1 | 1.41mi |
Listing history 15 events
-
2026-06-10status $270,000 Under Contract 86 DOM
-
2026-06-09days on market $270,000 Active 86 DOM
-
2026-06-08days on market $270,000 Active 85 DOM
-
2026-06-07days on market $270,000 Active 84 DOM
-
2026-06-03days on market $270,000 Active 80 DOM
-
2026-06-02days on market $270,000 Active 79 DOM
-
2026-06-01days on market $270,000 Active 78 DOM
-
2026-05-31days on market $270,000 Active 77 DOM
-
2026-03-22status Under Contract
-
2026-02-21historical Active Under Contract
-
2026-01-30price $270,000
-
2026-01-09$282,000 Active
-
2022-04-04price $725
-
2005-04-19soldstatus $100,000
-
1980-10-30soldstatus $48,000
ⓘ Source: listings_history table (triggers on properties + properties_extension) + one-shot
backfill from property_details.listing_events for pre-trigger history.
Tax reassessment forecast VA · Resets to sale price
- Current annual tax
- $3,407 · $284/mo
- Projected year-2 tax
- $3,407 · $284/mo
- Expected delta
- $0/yr ($0/mo · 0.0%)
ⓘ Screening estimate from a state-policy table — verify with the county assessor before closing.
Climate risk First Street
- Flood 3/10 Moderate FEMA zone X (unshaded) · 10% chance over 30 yrs
- Wildfire 1/10 Low
- Heat 9/10 Extreme 7 d/yr ≥105°F today · 16 d/yr by 30 yrs out
- Wind 8/10 Severe 80% chance of damaging wind over 30 yrs
- Air quality 3/10 Moderate 2 unhealthy d/yr today · 3 by 30 yrs out
Nearby sold comps map
Loading sold comps map…
Walkable amenities ~0.75 mi
Loading nearby amenities…
Taxation est. · year 1
- Rental income
- $32,772
- − Mortgage interest
- −$15,124
- − Property taxes
- −$3,407
- − Insurance
- −$1,350
- − Repairs & maintenance
- −$2,622
- − Management
- −$2,622
- − Depreciation
- −$7,855
- Taxable loss
- −$207
- Est. tax savings @ 24.0%
- +$50
- After-tax cash flow
- $4,192/yr
For passive investors: Depreciation is non-cash, so a rental often shows a tax loss while cash-flowing — sheltering income. Rental losses are passive: they offset passive income freely, and up to $25,000/yr can offset ordinary (W-2) income if you actively participate and your MAGI is under $100k (phasing out to $0 by $150k); unused losses carry forward. On sale, claimed depreciation is recaptured at up to 25%, and gains may owe capital-gains tax (a 1031 exchange can defer both). Figures are a year-1 estimate at your 24.0% rate — not tax advice; consult a CPA.
Schools (NCES district)
- District
- Norfolk City Public School District
- NCES district ID
- 5102670
- Math proficiency
- 27% ▼ -44.00%
- Reading proficiency
- 56% ▼ -10.00%
- Median HH income
- $44,358
- Composite
- 35.08/100
- National rank
- #5026
- State rank
- #118 of 131 in VA
Livability — Norfolk
- Score
- 83/100
- State rank
- #43
- US rank
- #1026
Category grades
Schools grade is shown separately in the Schools card above.
Census & demographics
- Census place
- Norfolk, VA
- County
- Norfolk City · 214,042 people
- City population
- 214,042
- Metro
- Virginia Beach-Norfolk-Newport News, VA-NC
- Population (ZIP)
- 28,628
- Household income
- $68,380
- Rent vs Own
- Severe rent burden
- 1342.0
Population outlook (Norfolk County) Hauer SSP2
- Today (2025)
- 249,032 people
- By 2030
- 252,347 · +1.3%
- By 2040
- 253,644 · +1.9%
- By 2050
- 251,913 · +1.2%
- By 2075
- 245,281 · -1.5%
- By 2100
- 219,548 · -11.8%
Race, ethnicity, and origin ACS 2023
- Neighborhood character
- Diverse neighborhood (Simpson 0.63)
- Race & ethnicity
- Black 55% White 23% Hispanic / Latino 11% Two or more races 7% Asian 5%
- Hispanic origin (detail)
- Mexican 4% Puerto Rican 3%
- Common ancestry
- Romanian 1% Slovak 1% Lithuanian 0%
- Foreign-born
- 10% · Canada
- Languages at home
- 87% English-only · Spanish 6% Tagalog/Filipino 4% French/Haitian/Cajun 1%
Political lean MEDSL · Norfolk
- 2024 margin
- Solid D (+41.5) · D 70.0% · R 28.5% · Other 1.6%
- 2008→2024 swing
- -1.4pp toward R · 2008: 43.0pp · 2024: 41.5pp
- All cycles
- 2024: D+41.5 2020: D+45.6 2016: D+42.0 2012: D+44.0 2008: D+43.0
Not yet ingested
- Civics
- —
Market trends
- HPI YoY
- ▼ -33.67%
- Current HPI
- 329.2241
- Rent YoY
- ▲ 3.42%
- Metro
- Virginia Beach-Norfolk-Newport News, VA-NC
- State GDP YoY
- ▲ 2.40%
- F500 in state
- 50
Industry mix (Fortune 500 HQ in VA)
| Industry | F500 HQs | Revenue |
|---|---|---|
| Aerospace / Defense | 4 | $236B |
|
||
| Technology / Defense | 3 | $32B |
|
||
| Financial Services | 2 | $176B |
|
||
| Utilities | 2 | $27B |
|
||
| Insurance | 2 | $25B |
|
||
| Technology | 2 | $15B |
|
||
Price history
+462.5% since first listed7 events — show timeline
- 2026-03-22 Pending — REINMLS
- 2026-02-21 Contingent — REINMLS
- 2026-01-30 Price Changed $270,000 REINMLS
- 2026-01-09 Listed $282,000 REINMLS
- 2022-04-04 Price Changed $725 RENT.
- 2005-04-19 Sold (Public Records) $100,000 Public Records
- 1980-10-30 Sold (Public Records) $48,000 Public Records
Property tax history
+4.9%/yrLatest (2025): $3,407 · +11.1% YoY. Source: county tax records.
Cash-flow waterfall
monthlySold comps — $/sqft
last 12 mo · ≤1 miLoading sold comps…