1300 22nd St #110 · San Francisco, CA
Flood risk 1/10 · Minimal
- FEMA flood zone
- X (unshaded)
- Chance of flooding over 30 yrs
- 0.0%
- Est. flood insurance / yr
- $507 – $1,088
Fire risk 1/10 · Minimal
- Est. fire insurance / yr
- $659 – $1,223
Heat risk 3/10 · Minor
- Hot days now (above 78°F)
- 7 days/yr
- Hot days in 30 yrs
- 16 days/yr
Wind risk 1/10 · Minimal
- Chance of severe wind over 30 yrs
- —
Air-quality risk 8/10 · Major
- Unhealthy air days now
- 15 days/yr
- Unhealthy air days in 30 yrs
- 15 days/yr
Risk factors via First Street. Map © Google.
Why this score? — see what drove the D grade
The composite is a weighted blend of 9 inputs, each scored 0–100. Each bar is that input's sub-score; the figure is the points it added to the 100-point composite (weight × sub-score).
- ARV discount +15.0/15.0
- Appreciation +7.5/10.0
- Rent growth +5.0/5.0
- Schools +5.0/10.0
- Livability +3.8/5.0
- Condition / age +2.5/5.0
- Cash flow +1.5/30.0
- 1% rule +0.1/10.0
- DSCR +0.0/10.0
$899,000
🖨 Deal sheet (PDF) 📄 Offer letter ✓ Due diligence
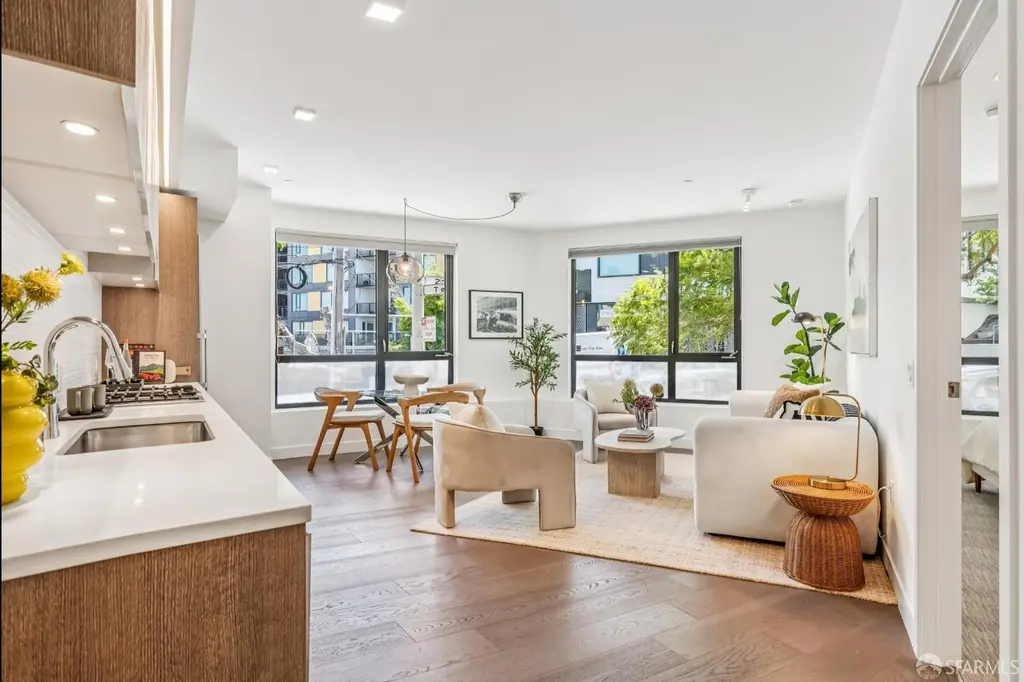
Listing remarks
Luxurious Knox condo with 2 bedrooms and 2 bathrooms in a desirable location by the border of Potrero Hill and Dogpatch. This stunning corner unit features a stylish kitchen with sleek appliances and gorgeous cabinetry and counters. A primary bedroom suite with a walk-in closet and a spacious bathroom with a large walk-in shower. There is a second full bathroom with a tub next to the second bedroom. Great floorplan for hosting guests or having a home office with the bedrooms at each end of the unit. The inviting kitchen, living, and dining area is in between the two bedrooms. The open layout is smart and efficient. Large south and west facing windows provide nice natural light. In-unit laun
Key facts
- Walk-in closet
- Stylish kitchen
- In-unit laundry
Tags
Property features AI
Finance
- HOA & community: HOA with monthly fee; Monthly association fee: $900; HOA covers common areas, door person, gas, insurance on structure, structure maintenance, grounds maintenance, management, roof, sewer, trash, and water; Community amenities include barbecue, gym, recreation facilities, roof deck, and other amenities; Community of 91 units; Pets allowed
Exterior
- Home design: Residential condominium; Built in 2016
- Construction: Built in 2016
- Exterior features: Entry at ground level
Interior
- Kitchen: Includes washer and dryer
- Bedrooms: 2 bedrooms
- Bathrooms: 2 full bathrooms
- Heating & cooling: Central heating; Central air conditioning
- Interior features: Central heating; Central air conditioning; Laundry closet
- Laundry & utility: Washer; Dryer
Neighborhood map
What this means for you Summary
Snapshot
- This is a 1-bed/1.0-bath condo listed at $899k.
Deal economics
- At list price, monthly cash flow is $-4k ($-42k/yr) — negative.
- To cash-flow at today's rent, offer at most $276k (69.3% below list).
- To meet the 1% rule (rent ≥ 1% of price), the offer needs to be $456k (49.2% below list).
- Recommended offer: $276k (69.3% below list) — sets the bar for cash-flow.
- Cap rate 1.6% vs local median 2.1% in San Francisco — below-typical yield; the buyer is paying a premium for something (appreciation thesis, condition, location) that the cap rate doesn't capture.
Location & tenants
- Location reads 76/100 on livability (#90 in CA, #3,143 nationally) — a middle-class / working-renter tenant base. Strengths: amenities A+, commute A+, employment A+; Watch: crime F, cost of living F.
- San Francisco Unified (urban): math 50% / reading 56% proficiency, ranked #322 of 1,400 in CA (top 23%) — acceptable for families but not a draw, mixed tenant base, ~2y average lease.
- Zoned schools: Lilienthal (Claire) Elementary (669 students, 19% FRL); Giannini (A.P.) Middle (1,192 students, 34% FRL); Lowell High (2,632 students, 37% FRL) — zoned schools average 30% FRL vs 49% district-wide (19 pts lower); this property's tenant base skews higher-income than the district average.
- Market conditions: Rents rising fast (+15.6%/yr); 165 active listings in the ZIP; 40 comparable units currently listed for rent nearby; rentals leasing fast (median 10d on market — plan ~1-2 weeks tenant-placement turnaround); solid renter incomes; 750 units permitted in San Francisco County in 2024 (688 in 5+ unit buildings).
- At $4,563/mo this rent would consume 52% of the median local household income ($106k/yr) (locally 5272% of renters already pay >50% of income on rent) — very limited rent-growth headroom before tenants either downsize or default.
Forward outlook
- In year one you build about $51k of equity ($6k loan paydown + $45k appreciation (5.0% local appreciation)).
- San Francisco County population projected at +39% by 2050 — long-run rental-demand tailwind backs the buy-and-hold thesis.
- By year 2, paydown + projected appreciation supports a ~$82k cash-out refi (75% LTV) — recoverable capital for the next deal without selling this one.
Negotiation context
- It's been on market 25 days — a 2% lower offer ($886k) is reasonable based on typical stale-listing flexibility.
- 5 sale attempts since 6y ago with the ask held roughly flat each time — persistent listings suggest the price (not the market) is what's stuck; bring a comps-based counter.
Questions for the listing agent
- What do current leases actually rent for vs. the listed asking? Can we see a recent rent roll and the last 12 months of T-12 income?
- What does the HOA fee cover, when was the last increase, and are there any pending special assessments or reserve-fund shortfalls?
- Any open or pending special assessments — roof, HVAC, plumbing, elevator, façade? What's the per-unit balance and payoff schedule, and is the seller paying it off at close or rolling it to the buyer?
- Is there a deadline driving the sale (1031 exchange, divorce, estate, relocation)? That informs how much negotiation room exists.
- Schools are B-rated — typically a magnet for longer-tenancy family renters. What's the average tenant stay here, and is there a school-zone premium baked into asking?
- Crime grade is F in this area — have there been break-ins, vandalism, or insurance claims at this property in the last 3 years? What carrier currently insures it and at what premium?
- The area grade is low — what's the realistic commute time and amenity access for the typical tenant pool here? Any planned neighborhood developments (good or bad) we should know about?
- What's the average days-on-market for RENTAL listings here right now (not sales)? A rising rental-DOM trend means longer vacancies and softer asking-rent achievability than the comps imply.
- What's the recent tenant-quality profile in this submarket — average credit score on applications, eviction rate, late-payment / NSF rate, and stable-employment percentage? A property-management company in the area should have these aggregated.
- How much new apartment / multifamily construction is in the pipeline within 1–3 miles? Heavy new supply (>2% of stock underway) typically softens rents 12–24 months out; light construction supports rent growth.
Investment metrics
- 1% rule
- 0.51% ✗
- Cap rate
- 1.58%
- Cash-on-cash
- -16.84%
- DSCR
- 0.25
- GRM
- 16.4
CMA / ARV
- ARV (median comp)
- $1,097,508
- List price
- $899,000
- Delta
- -18.09%
- Verdict
- UNDERPRICED
- Comps
- 20 within 1.0 mi
Projected returns pro-forma
5.02% appreciation · 8.0% rent growth · sell at horizon
- IRR
- 0.5%
- Equity multiple
- 1.03×
- Total profit
- $8,013
- Equity at exit
- $510,616
- IRR
- 5.5%
- Equity multiple
- 2.10×
- Total profit
- $277,536
- Equity at exit
- $882,218
Cash invested: $251,720 (down + closing). Projections, not guarantees.
Landlord ↔ Tenant lean methodology
- Overall (CITY)
- 0 Strongly Tenant-Friendly
- State California
- 18 Strongly Tenant-Friendly · D+13
- County
- — inherits STATE
- City San Francisco
- 0 Strongly Tenant-Friendly · D+57
ZIP-level market 94109
- Home prices YoY
- 2.9%
- Rents YoY
- 15.6%
- Active inventory
- 165
- Price-to-rent
- 16.4×
Monthly cashflow live
- Estimated rent
- $4,563 high interval (Pro) →
- Mortgage (P&I)
- −$4,714
- Tax from tax record
- −$1,149 /mo · $13,794/yr
- Insurance
- −$375
- HOA
- −$900
- Vacancy / Maint / Mgmt
- −$958
- Net cashflow
- $-3,533
Break-even live
Sensitivity live
| Price | -10% $-3,024 | -5% $-3,279 | +0% $-3,533 | +5% $-3,788 | +10% $-4,042 |
|---|---|---|---|---|---|
| Rent | -10% $-3,894 | -5% $-3,714 | +0% $-3,533 | +5% $-3,353 | +10% $-3,173 |
| Rate | -1.0pp $-3,081 | -0.5pp $-3,305 | base $-3,533 | +0.5pp $-3,766 | +1.0pp $-4,003 |
UW: 25.0% down · 7.5% · 30yr · 1.5% tax · 5.0% vac · 8.0% maint · 8.0% mgmt
Financing live
Cash to close
- Down payment
- $224,750
- Closing costs
- $26,970
- Reserves months
- —
- Total cash needed
- —
Loan-product check · same deal, 3 products live
Conventional
25% down · 7.5% · 30yr
- Down + closing
- —
- Monthly P&I
- —
- Monthly cashflow
- —
- DSCR
- —
- Eligible?
- —
Personal DTI + credit; lowest rate.
DSCR
20% down · 8.5% · 30yr
- Down + closing
- —
- Monthly P&I
- —
- Monthly cashflow
- —
- DSCR
- —
- Eligible?
- —
No personal income docs; deal must DSCR.
Hard money
10% down · 12.0% · 12mo
- Down + closing
- —
- Monthly P&I
- —
- Monthly cashflow
- —
- DSCR
- —
- Eligible?
- —
Short-term bridge; refi at stabilization.
Rent comps 40 comps
| Address | Beds | Baths | Sqft | Rent | $/sqft | DOM | Units | Dist |
|---|---|---|---|---|---|---|---|---|
| 1395 22nd St San Francisco, CA | 1.0–2.0 | 1.0–2.0 | 808 | $5,123 | $6.34 | 0d | 8 | 0.05mi |
| 800 Indiana St San Francisco, CA | 3.0 | 1.0–2.5 | 952 | $5,255 | $5.52 | 0d | 1 | 0.16mi |
| 850 Minnesota St #155 San Francisco, CA | 1.0 | 1.5 | 835 | $4,850 | $5.81 | 24d | 1 | 0.22mi |
| 2660 3rd St San Francisco, CA | 2.0 | 1.0–2.0 | 708 | $5,712 | $8.06 | 0d | 6 | 0.33mi |
| 2121 3rd St San Francisco, CA | 1.0–2.0 | 1.0–2.0 | 774 | $6,109 | $7.89 | 1d | 4 | 0.44mi |
| 2115-2117 22nd St Unit 2117 San Francisco, CA | 2.0 | 1.0 | 1000 | $4,600 | $4.60 | 24d | 1 | 0.46mi |
| 603 Tennessee St Unit 508 San Francisco, CA | 2.0 | 2.5 | 957 | $7,000 | $7.31 | 19d | 1 | 0.48mi |
| 595 Mariposa St San Francisco, CA | 2.0 | 2.0 | 835 | $5,850 | $7.01 | 26d | 1 | 0.49mi |
| 2246 23rd St San Francisco, CA | 1.0 | 1.0 | 650 | $3,506 | $5.39 | 46d | 1 | 0.51mi |
| 2250 24th St #121 San Francisco, CA | 1.0 | 1.0 | 602 | $3,623 | $6.02 | 20d | 1 | 0.53mi |
| 88 Arkansas St #105 San Francisco, CA | 1.0 | 1.0 | 604 | $4,000 | $6.62 | 46d | 1 | 0.58mi |
| 1010 16th St San Francisco, CA | 2.0 | 1.0–2.0 | 956 | $4,539 | $4.75 | 0d | 7 | 0.62mi |
| 451 Kansas St #375 San Francisco, CA | 1.0 | 1.0 | 661 | $4,350 | $6.58 | 20d | 1 | 0.66mi |
| 291 15th St San Francisco, CA | 1.0 | 1.0 | 550 | $2,695 | $4.90 | 26d | 1 | 0.84mi |
| 2830 22nd St Unit 2830 San Francisco, CA | 2.0 | 2.0 | 1090 | $5,200 | $4.77 | 19d | 1 | 0.94mi |
| 1 Henry Adams St San Francisco, CA | 3.0 | 2.0 | 873 | $5,001 | $5.72 | 0d | 3 | 0.96mi |
| 1201 4th St Unit 1297791P San Francisco, CA | 1.0 | 1.0 | 742 | $6,148 | $8.29 | 17d | 1 | 1.00mi |
| 355 Berry St San Francisco, CA | 1.0 | 1.0 | 707 | $4,956 | $7.00 | 0d | 3 | 1.03mi |
| 360 Berry St San Francisco, CA | 1.0–2.0 | 1.0–2.0 | 842 | $4,511 | $5.36 | 0d | 5 | 1.05mi |
| 1155 4th St San Francisco, CA | 1.0–2.0 | 1.0–2.0 | 864 | $5,360 | $6.20 | 1d | 5 | 1.07mi |
| 300 Berry St #907 San Francisco, CA | 1.0 | 1.0 | 732 | $5,000 | $6.83 | 9d | 1 | 1.11mi |
| 2629 Folsom St Unit 106 San Francisco, CA | 2.0 | 1.0 | 718 | $4,395 | $6.12 | 20d | 1 | 1.12mi |
| 2629 Folsom St Unit 204 San Francisco, CA | 2.0 | 1.0 | 718 | $4,095 | $5.70 | 46d | 1 | 1.12mi |
| 2629 Folsom St Unit 105 San Francisco, CA | 1.0 | 1.0 | 546 | $3,100 | $5.68 | 20d | 1 | 1.12mi |
| 855 Brannan St San Francisco, CA | 3.0 | 1.0–2.0 | 958 | $4,847 | $5.06 | 0d | 5 | 1.12mi |
| 185 Channel St San Francisco, CA | 2.0 | 1.0–2.0 | 914 | $6,178 | $6.76 | 0d | 36 | 1.14mi |
| 975 Bryant St San Francisco, CA | 2.0 | 1.0–2.0 | 697 | $5,027 | $7.21 | 1d | 10 | 1.23mi |
| 1023 3rd St San Francisco, CA | 2.0 | 1.0–2.0 | 743 | $7,675 | $10.33 | 0d | 12 | 1.25mi |
| 799 S Van Ness Ave San Francisco, CA | 1.0 | 1.0 | 700 | $3,800 | $5.43 | 1d | 1 | 1.25mi |
| 255 King St San Francisco, CA | 3.0 | 1.0–2.5 | 1228 | $5,638 | $4.59 | 0d | 1 | 1.27mi |
| 520 6th St San Francisco, CA | 1.0 | 1.5 | 1012 | $6,995 | $6.91 | 0d | 1 | 1.30mi |
| 1247 Harrison St #21 San Francisco, CA | 1.0 | 1.5 | 1089 | $4,950 | $4.55 | 20d | 1 | 1.31mi |
| 380 10th St San Francisco, CA | 2.0 | 2.0 | 1122 | $5,495 | $4.90 | 46d | 1 | 1.36mi |
| 1222 Harrison St San Francisco, CA | 2.0 | 1.0–2.5 | 856 | $4,910 | $5.74 | 0d | 32 | 1.36mi |
| 260 King St #717 San Francisco, CA | 1.0 | 1.0 | 759 | $4,850 | $6.39 | 4d | 1 | 1.36mi |
| 2333 Mission St #2 San Francisco, CA | 2.0 | 2.0 | 1010 | $4,900 | $4.85 | 9d | 1 | 1.37mi |
| 601 4th St #1523 San Francisco, CA | 1.0 | 1.0 | 1085 | $6,070 | $5.59 | 1d | 1 | 1.41mi |
| 345 8th St San Francisco, CA | 1.0 | 1.0 | 946 | $4,095 | $4.33 | 46d | 2 | 1.42mi |
| 155 Harriet St #1 San Francisco, CA | 2.0 | 1.5 | 920 | $3,595 | $3.91 | 46d | 1 | 1.48mi |
| 555 4th St #539 San Francisco, CA | 1.0 | 1.0 | 752 | $4,500 | $5.98 | 46d | 1 | 1.48mi |
HOA detail condo
- Monthly dues
- $900 · $10,800/yr
- Assessments
- None detected in remarks — confirm with the listing agent.
Listing history 15 events
-
2026-06-02status $899,000 Pending 25 DOM
-
2026-06-01days on market $899,000 Active 25 DOM
-
2026-05-31days on market $899,000 Active 24 DOM
-
2026-05-07$899,000 Active 1678-char remark
-
2022-11-12historical
-
2020-09-17price $995,000
-
2020-09-15status Active
-
2020-09-13historical
-
2020-08-31status Active
-
2020-08-31historical
-
2020-08-25status Active
-
2020-08-21historical
-
2020-07-28price $1,025,000
-
2020-07-07price $1,049,000
-
2020-06-17$1,095,000 Active
ⓘ Source: listings_history table (triggers on properties + properties_extension) + one-shot
backfill from property_details.listing_events for pre-trigger history.
Tax reassessment forecast CA · Resets to sale price
- Current annual tax
- $13,794 · $1,149/mo
- Projected year-2 tax
- $13,794 · $1,149/mo
- Expected delta
- $0/yr ($0/mo · 0.0%)
ⓘ Screening estimate from a state-policy table — verify with the county assessor before closing.
Climate risk First Street
- Flood 1/10 Low FEMA zone X (unshaded) · 0% chance over 30 yrs
- Wildfire 1/10 Low
- Heat 3/10 Moderate 7 d/yr ≥78°F today · 16 d/yr by 30 yrs out
- Wind 1/10 Low
- Air quality 8/10 Severe 15 unhealthy d/yr today · 15 by 30 yrs out
Nearby sold comps map
Loading sold comps map…
Walkable amenities ~0.75 mi
Loading nearby amenities…
Taxation est. · year 1
- Rental income
- $54,761
- − Mortgage interest
- −$50,358
- − Property taxes
- −$13,794
- − Insurance
- −$4,495
- − Repairs & maintenance
- −$4,381
- − Management
- −$4,381
- − HOA
- −$10,800
- − Depreciation
- −$26,153
- Taxable loss
- −$59,600
- Est. tax savings @ 24.0%
- +$14,304
- After-tax cash flow
- $-28,097/yr
For passive investors: Depreciation is non-cash, so a rental often shows a tax loss while cash-flowing — sheltering income. Rental losses are passive: they offset passive income freely, and up to $25,000/yr can offset ordinary (W-2) income if you actively participate and your MAGI is under $100k (phasing out to $0 by $150k); unused losses carry forward. On sale, claimed depreciation is recaptured at up to 25%, and gains may owe capital-gains tax (a 1031 exchange can defer both). Figures are a year-1 estimate at your 24.0% rate — not tax advice; consult a CPA.
Schools (NCES district)
- District
- San Francisco Unified
- NCES district ID
- 0634410
- Math proficiency
- 50% ▬ 0.00%
- Reading proficiency
- 56% ▲ 1.00%
- Median HH income
- $81,249
- Composite
- 50.14/100
- National rank
- #4088
- State rank
- #322 of 1400 in CA
Livability — San Francisco
- Score
- 76/100
- State rank
- #90
- US rank
- #3143
Category grades
Schools grade is shown separately in the Schools card above.
Census & demographics
- Census place
- San Francisco, CA
- County
- San Francisco County · 827,552 people
- City population
- 827,552
- Metro
- San Francisco-Oakland-Berkeley, CA
- Population (ZIP)
- 54,553
- Household income
- $106,018
- Rent vs Own
- Severe rent burden
- 5272.0
Population outlook (San Francisco County) Hauer SSP2
- Today (2025)
- 1,030,936 people
- By 2030
- 1,110,409 · +7.7%
- By 2040
- 1,270,010 · +23.2%
- By 2050
- 1,435,001 · +39.2%
- By 2075
- 1,779,074 · +72.6%
- By 2100
- 1,966,767 · +90.8%
Race, ethnicity, and origin ACS 2023
- Neighborhood character
- Diverse neighborhood (Simpson 0.66)
- Race & ethnicity
- White 50% Asian 27% Hispanic / Latino 13% Two or more races 10% Black 4%
- Hispanic origin (detail)
- Mexican 7% Puerto Rican 1%
- Common ancestry
- Lithuanian 3% Italian 3% Romanian 2%
- Foreign-born
- 31% · China, Canada, Vietnam
- Languages at home
- 64% English-only · Chinese 10% Spanish 7% Other Asian/Pacific 4%
Political lean MEDSL · San Francisco
- 2024 margin
- Solid D (+64.8) · D 80.3% · R 15.5% · Other 4.1%
- 2008→2024 swing
- -5.7pp toward R · 2008: 70.5pp · 2024: 64.8pp
- All cycles
- 2024: D+64.8 2020: D+72.5 2016: D+76.1 2012: D+70.2 2008: D+70.5
Not yet ingested
- Civics
- —
Market trends
- HPI YoY
- ▲ 5.02%
- Current HPI
- 175.8886
- Rent YoY
- ▲ 15.60%
- Metro
- San Francisco-Oakland-Berkeley, CA
- State GDP YoY
- ▲ 3.21%
- F500 in state
- 116
Industry mix (Fortune 500 HQ in CA)
| Industry | F500 HQs | Revenue |
|---|---|---|
| Technology | 27 | $1,492B |
|
||
| Financial Services | 3 | $174B |
|
||
| Retail | 3 | $44B |
|
||
| Insurance | 3 | $26B |
|
||
| Media / Entertainment | 2 | $115B |
|
||
| Pharmaceuticals / Biotech | 2 | $62B |
|
||
Price history
-17.9% since first listed13 events — show timeline
- 2026-06-02 Pending — San Francisco MLS
- 2026-05-07 Listed $899,000 San Francisco MLS
- 2022-11-12 Rental Removed — RENT.
- 2020-09-17 Price Changed $995,000 San Francisco MLS
- 2020-09-15 Relisted — San Francisco MLS
- 2020-09-13 Delisted — San Francisco MLS
- 2020-08-31 Relisted — San Francisco MLS
- 2020-08-31 Delisted — San Francisco MLS
- 2020-08-25 Relisted — San Francisco MLS
- 2020-08-21 Delisted — San Francisco MLS
- 2020-07-28 Price Changed $1,025,000 San Francisco MLS
- 2020-07-07 Price Changed $1,049,000 San Francisco MLS
- 2020-06-17 Listed $1,095,000 San Francisco MLS
Property tax history
+2.1%/yrLatest (2025): $13,794 · +2.9% YoY. Source: county tax records.
Cash-flow waterfall
monthlySold comps — $/sqft
last 12 mo · ≤1 miLoading sold comps…