1520 NW 24th Ave · Cape Coral, FL
Flood risk 8/10 · Major
- FEMA flood zone
- X (shaded)
- Chance of flooding over 30 yrs
- 0.97%
- Est. flood insurance / yr
- $507 – $1,088
Fire risk 4/10 · Minor
- Est. fire insurance / yr
- $947 – $1,759
Heat risk 10/10 · Severe
- Hot days now (above 107°F)
- 7 days/yr
- Hot days in 30 yrs
- 29 days/yr
Wind risk 10/10 · Severe
- Chance of severe wind over 30 yrs
- 99.0%
Air-quality risk 2/10 · Minimal
- Unhealthy air days now
- 1 days/yr
- Unhealthy air days in 30 yrs
- 1 days/yr
Risk factors via First Street. Map © Google.
Why this score? — see what drove the D- grade
The composite is a weighted blend of 9 inputs, each scored 0–100. Each bar is that input's sub-score; the figure is the points it added to the 100-point composite (weight × sub-score).
- Cash flow +13.1/30.0
- ARV discount +7.5/15.0
- Schools +4.1/10.0
- DSCR +3.9/10.0
- Livability +3.9/5.0
- Condition / age +2.5/5.0
- 1% rule +2.4/10.0
- Rent growth +1.1/5.0
- Appreciation +0.0/10.0
$319,097
🖨 Deal sheet (PDF) 📄 Offer letter ✓ Due diligence
Listing remarks MLS
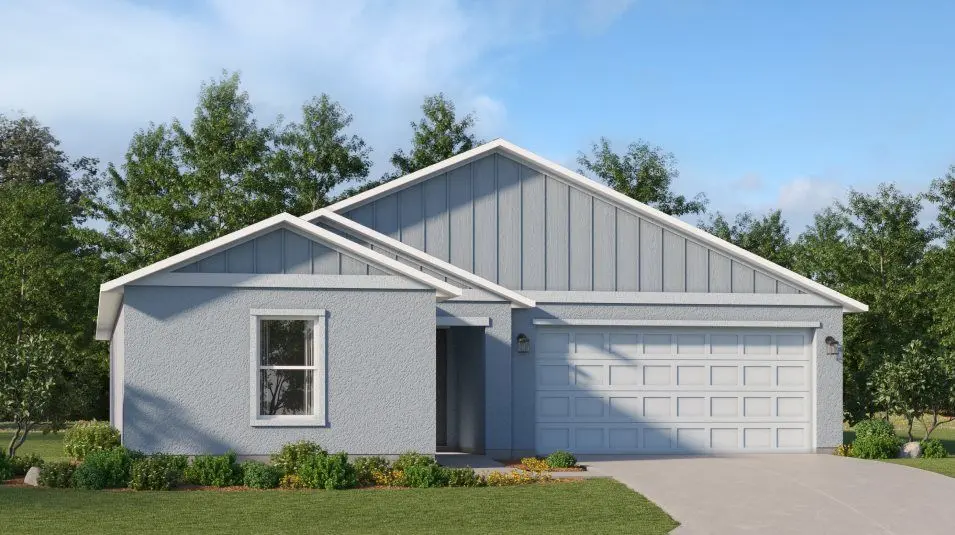
This new single-story home is a modern take on a classic design. Down the foyer is a spacious and open-plan family room which has direct access to the cozy dining room, well-equipped kitchen and attached patio, perfect for everyday living. In a private corner is the owner's suite with a convenient adjoining bathroom, while on the opposite side of the home are three secondary bedrooms to offer restful retreats.
Key facts
- Waterfront options
- Adjoining bathroom
- Owner's suite
Tags
Property features AI
Finance
- Other: Property type: Residential; Development: Cape Coral; Canal width category: 1-30; Lot size approx. 0.23 acres; Architectural plans used for lot dimensions; Possession at closing
- HOA & community: Developer-managed community; Streetlight on property; One-time fee of $1,750
Exterior
- Parking: Attached 2-car garage; Paved driveway
- Utilities: Well water; Septic sewer; Electric service (central)
- Home design: Single-family residence; 1 story (ranch); Rear of property faces west; New construction (2026)
- Construction: Concrete block construction; Built in 2026
- Exterior features: Shingle roof; Stucco exterior finish; Single-hung and sliding windows; Manual shutters; Canal waterfront with water view; Well irrigation; Paved road access; Regular lot
Interior
- Kitchen: Kitchen island; Pantry / walk-in pantry; Range; Microwave; Refrigerator/ice maker; Dishwasher
- Bedrooms: 4 bedrooms; First floor bedroom; Split bedroom floor plan
- Flooring: Tile flooring
- Bathrooms: 2 full bathrooms; Master bath with dual sinks and shower (no tub)
- Heating & cooling: Central electric heat; Central electric cooling; Cable available
- Interior features: Cable prewire; Foyer; Pantry; Walk-in closet; Family room; Guest room; Guest bath; Laundry in residence; Unfurnished
- Laundry & utility: Washer; Dryer; Auto garage door; Smoke detector
Neighborhood map
What this means for you Summary
Snapshot
- This is a 4-bed/2.0-bath land listed at $319k.
Deal economics
- At list price, monthly cash flow is $-80 ($-966/yr) — negative.
- To cash-flow at today's rent, offer at most $305k (4.5% below list).
- To meet the 1% rule (rent ≥ 1% of price), the offer needs to be $237k (25.6% below list).
- Recommended offer: $237k (25.6% below list) — sets the bar for 1% rule.
- Cap rate 6.2% vs local median 3.1% in Cape Coral — top-decile yield for the area; either an underpriced asset or a hidden risk that comps aren't pricing in. Stress-test before assuming the spread holds.
Location & tenants
- Location reads 77/100 on livability (#208 in FL, #3,098 nationally) — a middle-class / working-renter tenant base. Strengths: housing A+, health & safety A+, amenities B+; Watch: commute F.
- Lee (suburban): math 47% / reading 50% proficiency, ranked #42 of 73 in FL (top 58%) — families likely to look elsewhere, expect single-tenant / working-renter base with shorter leases.
- Market conditions: Rents falling (-5.5%/yr); 2652 active listings in the ZIP; 40 comparable units currently listed for rent nearby; rentals at typical pace (median 25d on market — plan ~3-4 weeks tenant-placement turnaround); solid renter incomes; 15,411 units permitted in Lee County in 2024 (4,686 in 5+ unit buildings).
- This rent runs 31% of the median local income ($91k/yr) — at the standard rent-burdened threshold; future hikes will face affordability resistance.
Forward outlook
- Local home prices are declining (-3.0%/yr); year-one equity from $2k of loan paydown is wiped out by about $10k of value loss. Plan a longer hold.
- Lee County population projected at +44% by 2050 — long-run rental-demand tailwind backs the buy-and-hold thesis.
Negotiation context
- It's been on market 65 days — a 6% lower offer ($300k) is reasonable based on typical stale-listing flexibility.
- 2 sale attempts; this cycle's ask has dropped $20k (6%) from the opening price — seller is motivated, your offer sets the floor, not the list.
Risks & watch-outs
- Watch-outs: flood insurance adds $66/mo.
- Climate carrying-cost: severe flood risk; severe wind risk, 99% chance of damaging wind over 30y; extreme-heat days projected 7→29/yr by 2055 (HVAC capex compounding) — expect insurance premiums to compound above CPI over the hold.
Questions for the listing agent
- What do current leases actually rent for vs. the listed asking? Can we see a recent rent roll and the last 12 months of T-12 income?
- It's been on market 65 days. Have you received any prior offers? Is the seller open to a 26% concession, seller financing, or rate buy-down credit?
- What's the actual annual flood-insurance premium (NFIP or private), and is the property in a SFHA with mandatory coverage?
- Why hasn't it sold? Are there any deal-killer items the seller is aware of (foundation, flood, title, zoning, code violations)?
- Is there a deadline driving the sale (1031 exchange, divorce, estate, relocation)? That informs how much negotiation room exists.
- Schools are B-rated — typically a magnet for longer-tenancy family renters. What's the average tenant stay here, and is there a school-zone premium baked into asking?
- The area grade is low — what's the realistic commute time and amenity access for the typical tenant pool here? Any planned neighborhood developments (good or bad) we should know about?
- What's the average days-on-market for RENTAL listings here right now (not sales)? A rising rental-DOM trend means longer vacancies and softer asking-rent achievability than the comps imply.
- What's the recent tenant-quality profile in this submarket — average credit score on applications, eviction rate, late-payment / NSF rate, and stable-employment percentage? A property-management company in the area should have these aggregated.
- How much new for-sale + rental construction is in the pipeline within 1–3 miles? Heavy new supply typically softens prices + rents 12–24 months out; constrained supply supports both.
Investment metrics
- 1% rule
- 0.74% ✗
- Cap rate
- 6.24%
- Cash-on-cash
- -0.19%
- DSCR
- 0.99
- GRM
- 11.2
CMA / ARV
No comps found within radius.
Projected returns pro-forma
-3.0% appreciation · 0.0% rent growth · sell at horizon
- IRR
- -21.1%
- Equity multiple
- 0.28×
- Total profit
- $-63,906
- Equity at exit
- $47,578
- IRR
- -22.4%
- Equity multiple
- -0.00×
- Total profit
- $-89,603
- Equity at exit
- $27,590
Cash invested: $89,347 (down + closing). Projections, not guarantees.
Landlord ↔ Tenant lean methodology
- Overall (STATE)
- 87 Strongly Landlord-Friendly
- State Florida
- 87 Strongly Landlord-Friendly · R+3
- County
- — inherits STATE
- City
- — inherits STATE
ZIP-level market 33993
- Home prices YoY
- -14.1%
- Rents YoY
- -5.5%
- Active inventory
- 2652
- Price-to-rent
- 11.2×
Monthly cashflow live
- Estimated rent
- $2,373 high interval (Pro) →
- Mortgage (P&I)
- −$1,673
- Tax from tax record
- −$82 /mo · $988/yr
- Insurance
- −$133
- Flood insurance flood zone
- −$66 /mo · $798/yr
- HOA
- −$0
- Vacancy / Maint / Mgmt
- −$498
- Net cashflow
- $-80
Break-even live
Sensitivity live
| Price | -10% $100 | -5% $10 | +0% $-80 | +5% $-171 | +10% $-261 |
|---|---|---|---|---|---|
| Rent | -10% $-268 | -5% $-174 | +0% $-80 | +5% $13 | +10% $107 |
| Rate | -1.0pp $80 | -0.5pp $1 | base $-80 | +0.5pp $-163 | +1.0pp $-247 |
UW: 25.0% down · 7.5% · 30yr · 1.5% tax · 5.0% vac · 8.0% maint · 8.0% mgmt
Financing live
Cash to close
- Down payment
- $79,774
- Closing costs
- $9,573
- Reserves months
- —
- Total cash needed
- —
Loan-product check · same deal, 3 products live
Conventional
25% down · 7.5% · 30yr
- Down + closing
- —
- Monthly P&I
- —
- Monthly cashflow
- —
- DSCR
- —
- Eligible?
- —
Personal DTI + credit; lowest rate.
DSCR
20% down · 8.5% · 30yr
- Down + closing
- —
- Monthly P&I
- —
- Monthly cashflow
- —
- DSCR
- —
- Eligible?
- —
No personal income docs; deal must DSCR.
Hard money
10% down · 12.0% · 12mo
- Down + closing
- —
- Monthly P&I
- —
- Monthly cashflow
- —
- DSCR
- —
- Eligible?
- —
Short-term bridge; refi at stabilization.
Rent comps 40 comps
| Address | Beds | Baths | Sqft | Rent | $/sqft | DOM | Units | Dist |
|---|---|---|---|---|---|---|---|---|
| 2027 NW 17th St Cape Coral, FL | 4.0 | 2.0 | 2000 | $2,450 | $1.23 | 24d | 1 | 0.36mi |
| 2216 NW 18th Ter Cape Coral, FL | 3.0 | 2.0 | 1548 | $1,816 | $1.17 | 15d | 1 | 0.38mi |
| 1243 NW 22nd Ave Cape Coral, FL | 3.0 | 2.0 | 1274 | $2,195 | $1.72 | 15d | 1 | 0.41mi |
| 1821 NW 23rd Ave Cape Coral, FL | 3.0 | 2.0 | 1876 | $1,856 | $0.99 | 14d | 1 | 0.42mi |
| 1926 NW 15th St Cape Coral, FL | 3.0 | 2.0 | 1461 | $2,100 | $1.44 | 11d | 1 | 0.44mi |
| 1903 NW 22nd Ave Cape Coral, FL | 4.0 | 2.0 | 1984 | $2,200 | $1.11 | 24d | 1 | 0.52mi |
| 1225 NW 26th Pl Cape Coral, FL | 4.0 | 2.0 | 1993 | $1,995 | $1.00 | 24d | 1 | 0.55mi |
| 1840 NW 14th Ter Cape Coral, FL | 3.0 | 2.0 | 1994 | $1,871 | $0.94 | 4d | 1 | 0.55mi |
| 1208 NW 25th Pl Cape Coral, FL | 4.0 | 2.0 | 1735 | $2,200 | $1.27 | 4d | 1 | 0.55mi |
| 1822 Diplomat Pkwy W Cape Coral, FL | 4.0 | 2.0 | 1787 | $2,145 | $1.20 | 24d | 1 | 0.59mi |
| 1818 Diplomat Pkwy W Cape Coral, FL | 4.0 | 2.0 | 1787 | $2,025 | $1.13 | 24d | 1 | 0.60mi |
| 2001 NW 25th Ave Cape Coral, FL | 3.0 | 2.0 | 1887 | $2,500 | $1.32 | 24d | 1 | 0.60mi |
| 1809 NW 17th Ter Cape Coral, FL | 3.0 | 2.0 | 1750 | $1,980 | $1.13 | 24d | 1 | 0.62mi |
| 1108 NW 21st Pl Cape Coral, FL | 3.0 | 2.0 | 1666 | $2,060 | $1.24 | 24d | 1 | 0.63mi |
| 1150 NW 19th Pl Cape Coral, FL | 4.0 | 2.0 | 1833 | $1,895 | $1.03 | 2d | 1 | 0.65mi |
| 1820 NW 19th Ave Cape Coral, FL | 4.0 | 3.0 | 2340 | $2,500 | $1.07 | 12d | 1 | 0.66mi |
| 1129 NW 20th Ave Cape Coral, FL | 4.0 | 2.0 | 1828 | $2,180 | $1.19 | 22d | 1 | 0.69mi |
| 1129 NW 20th Ave Cape Coral, FL | 4.0 | 2.0 | 1828 | $2,200 | $1.20 | 24d | 1 | 0.69mi |
| 1823 NW 19th Ave Cape Coral, FL | 4.0 | 2.0 | 1712 | $1,850 | $1.08 | 24d | 1 | 0.69mi |
| 1731 NW 14th St Cape Coral, FL | 4.0 | 2.0 | 1337 | $1,866 | $1.40 | 4d | 1 | 0.71mi |
| 2105 NW 22nd Ave Cape Coral, FL | 4.0 | 2.0 | 1833 | $2,265 | $1.24 | 15d | 1 | 0.72mi |
| 2619 NW 11th St Cape Coral, FL | 3.0 | 2.0 | 1272 | $2,110 | $1.66 | 24d | 1 | 0.74mi |
| 1137 NW 19th Ave Cape Coral, FL | 4.0 | 2.0 | 1771 | $2,215 | $1.25 | 14d | 1 | 0.75mi |
| 2701 NW 11th St Cape Coral, FL | 3.0 | 2.0 | 1627 | $3,000 | $1.84 | 24d | 1 | 0.76mi |
| 1101 NW 19th Pl Cape Coral, FL | 4.0 | 2.0 | 1711 | $1,900 | $1.11 | 4d | 1 | 0.81mi |
| 2152 NW 22nd Pl Cape Coral, FL | 3.0 | 2.0 | 1418 | $2,550 | $1.80 | 12d | 1 | 0.87mi |
| 1119 NW 28th Pl Cape Coral, FL | 3.0 | 3.0 | 2047 | $2,400 | $1.17 | 24d | 1 | 0.88mi |
| 2465 NW 9th St Cape Coral, FL | 4.0 | 3.0 | 2020 | $2,595 | $1.28 | 24d | 1 | 0.95mi |
| 1827 NW 10th St Cape Coral, FL | 3.0 | 2.0 | 1864 | $2,050 | $1.10 | 24d | 1 | 0.97mi |
| 2022 NW 9th St Cape Coral, FL | 3.0 | 2.0 | 1303 | $1,611 | $1.24 | 14d | 1 | 0.97mi |
| 2453 NW 8th Ter Cape Coral, FL | 3.0 | 2.0 | 1574 | $2,200 | $1.40 | 24d | 1 | 0.99mi |
| 2014 NW 9th St Cape Coral, FL | 4.0 | 2.0 | 1828 | $2,300 | $1.26 | 24d | 1 | 0.99mi |
| 2124 NW 18th Ave Cape Coral, FL | 3.0 | 2.0 | 1556 | $2,000 | $1.29 | 20d | 1 | 1.01mi |
| 1212 Chiquita Blvd N Cape Coral, FL | 3.0 | 2.0 | 1672 | $2,100 | $1.26 | 24d | 1 | 1.01mi |
| 2302 NW 27th Ave Cape Coral, FL | 3.0 | 2.0 | 2136 | $1,691 | $0.79 | 22d | 1 | 1.02mi |
| 2014 NW 16th Pl Cape Coral, FL | 4.0 | 2.0 | 1712 | $1,701 | $0.99 | 14d | 1 | 1.05mi |
| 2329 NW 27th Ave Cape Coral, FL | 3.0 | 2.0 | 1761 | $2,300 | $1.31 | 17d | 1 | 1.10mi |
| 1319 NW 15th Ave Cape Coral, FL | 4.0 | 2.0 | 2009 | $2,150 | $1.07 | 24d | 1 | 1.12mi |
| 2206 NW 17th Pl Cape Coral, FL | 4.0 | 2.0 | 1779 | $2,075 | $1.17 | 24d | 1 | 1.15mi |
| 1621 NW 9th Ter Cape Coral, FL | 4.0 | 3.0 | 2020 | $2,500 | $1.24 | 24d | 1 | 1.16mi |
Listing history 15 events
-
2026-06-17days on market $319,097 Active 65 DOM
-
2026-06-16days on market $319,097 Active 64 DOM
-
2026-06-15days on market $319,097 Active 63 DOM
-
2026-06-13days on market $319,097 Active 61 DOM
-
2026-06-10days on market $319,097 Active 58 DOM
-
2026-06-09days on market $319,097 Active 57 DOM
-
2026-06-07days on market $319,097 Active 55 DOM
-
2026-06-03days on market $319,097 Active 51 DOM
-
2026-06-02days on market $319,097 Active 50 DOM
-
2026-06-01days on market $319,097 Active 49 DOM
-
2026-05-31days on market $319,097 Active 48 DOM
-
2026-05-23price $319,097 413-char remark
Show marketing remark (413 chars)
This new single-story home is a modern take on a classic design. Down the foyer is a spacious and open-plan family room which has direct access to the cozy dining room, well-equipped kitchen and attached patio, perfect for everyday living. In a private corner is the owner's suite with a convenient adjoining bathroom, while on the opposite side of the home are three secondary bedrooms to offer restful retreats.
-
2026-04-14$339,097 Active 413-char remark
Show marketing remark (413 chars)
This new single-story home is a modern take on a classic design. Down the foyer is a spacious and open-plan family room which has direct access to the cozy dining room, well-equipped kitchen and attached patio, perfect for everyday living. In a private corner is the owner's suite with a convenient adjoining bathroom, while on the opposite side of the home are three secondary bedrooms to offer restful retreats.
-
2026-04-13$339,097 Active
-
2025-10-09soldstatus $342,000
ⓘ Source: listings_history table (triggers on properties + properties_extension) + one-shot
backfill from property_details.listing_events for pre-trigger history.
Tax reassessment forecast FL · Resets to sale price
- Current annual tax
- $988 · $82/mo
- Projected year-2 tax
- $2,649 · $221/mo
- Expected delta
- +$1,661/yr (+$138/mo · 168.2%)
ⓘ Screening estimate from a state-policy table — verify with the county assessor before closing.
Climate risk First Street
- Flood 8/10 Severe FEMA zone X (shaded) · 97% chance over 30 yrs
- Wildfire 4/10 Moderate
- Heat 10/10 Extreme 7 d/yr ≥107°F today · 29 d/yr by 30 yrs out
- Wind 10/10 Extreme 99% chance of damaging wind over 30 yrs
- Air quality 2/10 Low 1 unhealthy d/yr today · 1 by 30 yrs out
Nearby sold comps map
Loading sold comps map…
Walkable amenities ~0.75 mi
Loading nearby amenities…
Taxation est. · year 1
- Rental income
- $28,475
- − Mortgage interest
- −$17,874
- − Property taxes
- −$988
- − Insurance
- −$2,393
- − Repairs & maintenance
- −$2,278
- − Management
- −$2,278
- − Depreciation
- −$9,283
- Taxable loss
- −$6,619
- Est. tax savings @ 24.0%
- +$1,589
- After-tax cash flow
- $623/yr
For passive investors: Depreciation is non-cash, so a rental often shows a tax loss while cash-flowing — sheltering income. Rental losses are passive: they offset passive income freely, and up to $25,000/yr can offset ordinary (W-2) income if you actively participate and your MAGI is under $100k (phasing out to $0 by $150k); unused losses carry forward. On sale, claimed depreciation is recaptured at up to 25%, and gains may owe capital-gains tax (a 1031 exchange can defer both). Figures are a year-1 estimate at your 24.0% rate — not tax advice; consult a CPA.
Schools (NCES district)
- District
- Lee
- NCES district ID
- 1201080
- Math proficiency
- 47% ▼ -11.00%
- Reading proficiency
- 50% ▼ -4.00%
- Median HH income
- $49,518
- Composite
- 41.49/100
- National rank
- #3458
- State rank
- #42 of 73 in FL
Livability — Cape Coral
- Score
- 77/100
- State rank
- #208
- US rank
- #3098
Category grades
Schools grade is shown separately in the Schools card above.
Census & demographics
- Census place
- Cape Coral, FL
- County
- Lee County · 788,662 people
- City population
- 217,388
- Metro
- Cape Coral-Fort Myers, FL
- Population (ZIP)
- 35,580
- Household income
- $90,577
- Rent vs Own
- Severe rent burden
- 286.0
Population outlook (Lee County) Hauer SSP2
- Today (2025)
- 871,946 people
- By 2030
- 955,468 · +9.6%
- By 2040
- 1,113,587 · +27.7%
- By 2050
- 1,256,891 · +44.1%
- By 2075
- 1,560,270 · +78.9%
- By 2100
- 1,726,848 · +98.0%
Race, ethnicity, and origin ACS 2023
- Neighborhood character
- Diverse neighborhood (Simpson 0.58)
- Race & ethnicity
- White 57% Hispanic / Latino 30% Two or more races 21% Black 7% Asian 2%
- Hispanic origin (detail)
- Mexican 2% Puerto Rican 6% Cuban 17% Dominican 1%
- Common ancestry
- Romanian 2% Hispanic 2% Lithuanian 2%
- Foreign-born
- 21% · Canada, Jamaica, China
- Languages at home
- 73% English-only · Spanish 24% French/Haitian/Cajun 1% Russian/Polish/Slavic 1%
Political lean MEDSL · Lee
- 2024 margin
- Strong R (+28.4) · D 35.5% · R 63.9%
- 2008→2024 swing
- -18.0pp toward R · 2008: -10.4pp · 2024: -28.4pp
- All cycles
- 2024: R+28.4 2020: R+19.2 2016: R+20.4 2012: R+16.6 2008: R+10.4
Not yet ingested
- Civics
- —
Market trends
- HPI YoY
- ▼ -55.34%
- Current HPI
- 337.0575
- Rent YoY
- ▼ -5.51%
- Metro
- Cape Coral-Fort Myers, FL
- State GDP YoY
- ▲ 3.28%
- F500 in state
- 36
Industry mix (Fortune 500 HQ in FL)
| Industry | F500 HQs | Revenue |
|---|---|---|
| Industrial Technology | 2 | $29B |
|
||
| Insurance | 2 | $17B |
|
||
| Retail | 1 | $60B |
|
||
| Technology Distribution | 1 | $58B |
|
||
| Homebuilding | 1 | $35B |
|
||
| Technology Manufacturing | 1 | $35B |
|
||
Price history
-6.7% since first listed4 events — show timeline
- 2026-05-23 Price Changed $319,097 Zillow
- 2026-04-14 Listed $339,097 Zillow
- 2026-04-13 Listed $339,097 NAPLESMLS
- 2025-10-09 Sold (Public Records) $342,000 Public Records
Property tax history
+12.5%/yrLatest (2025): $988 · +13.8% YoY. Source: county tax records.
Cash-flow waterfall
monthlySold comps — $/sqft
last 12 mo · ≤1 miLoading sold comps…