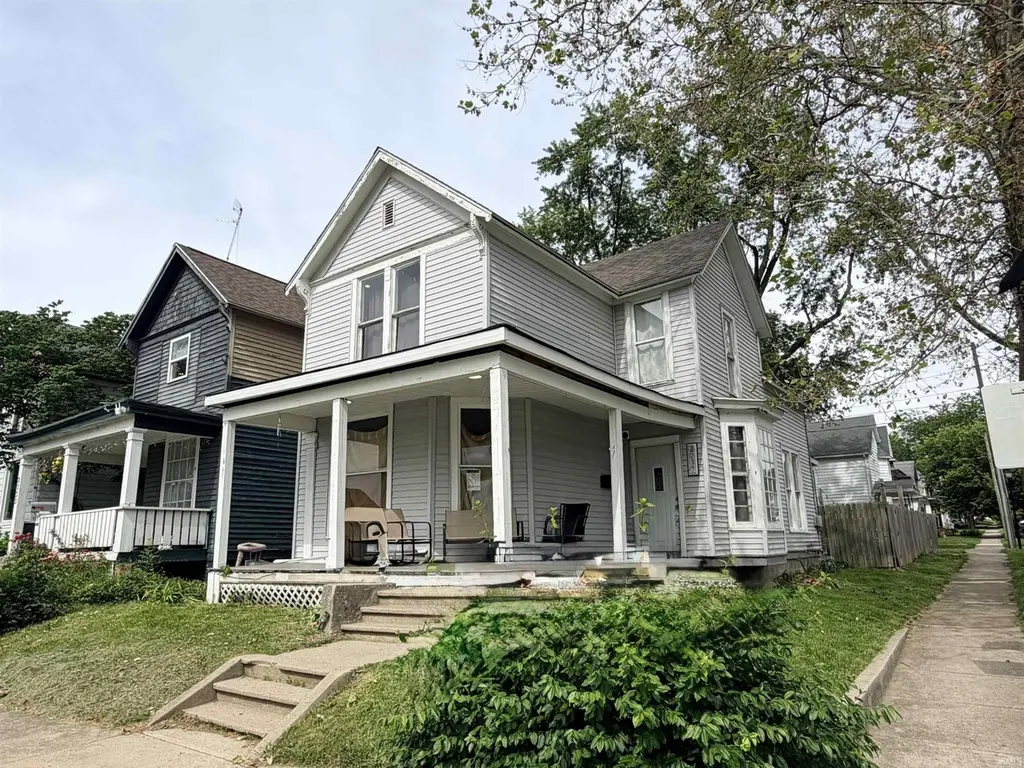
2737 Hoagland Ave · Fort Wayne, IN
Flood risk 1/10 · Minimal
- FEMA flood zone
- X (unshaded)
- Chance of flooding over 30 yrs
- 0.0%
- Est. flood insurance / yr
- $473 – $860
Fire risk 1/10 · Minimal
- Est. fire insurance / yr
- $717 – $1,331
Heat risk 3/10 · Minor
- Hot days now (above 100°F)
- 7 days/yr
- Hot days in 30 yrs
- 17 days/yr
Wind risk 2/10 · Minimal
- Chance of severe wind over 30 yrs
- —
Air-quality risk 3/10 · Minor
- Unhealthy air days now
- 2 days/yr
- Unhealthy air days in 30 yrs
- 3 days/yr
Risk factors via First Street. Map © Google.
Why this score? — see what drove the C grade
The composite is a weighted blend of 9 inputs, each scored 0–100. Each bar is that input's sub-score; the figure is the points it added to the 100-point composite (weight × sub-score).
- Cash flow +17.7/30.0
- ARV discount +15.0/15.0
- DSCR +5.5/10.0
- Rent growth +4.6/5.0
- Livability +4.2/5.0
- 1% rule +4.0/10.0
- Condition / age +2.5/5.0
- Schools +2.2/10.0
- Appreciation +0.0/10.0
$148,000
🖨 Deal sheet 📄 Offer letter ✓ Due diligence
Listing remarks
Welcome to 2737 Hoagland Ave! This spacious 4 bedroom, 2 bath home offers 1,719 Square ft of living space and has seen numerous recent improvements throughout featuring new flooring in majority of the home in 2025, new furnace in 2024, fresh paint, and refreshed front porch with new roof and flooring. functional room layouts, and plenty of room for a growing family or investment opportunity. As an added bonus, the sale includes the adjacent lot at 338 W Leith St, offering additional outdoor space, potential future development opportunities. Conveniently located near schools, parks, shopping, and downtown Fort Wayne. This property is worth a look!
Key facts
- New furnace
- Fresh paint
- New flooring
Tags
Property features AI
Exterior
- Parking: Off-street parking; No garage
- Utilities: Public water; Public sewer
- Home design: Single-family residence; Site-built home; 2 stories
- Construction: Shingle siding; Vinyl siding; Brick/mortar foundation; Shingle roof; Built with site-built construction
- Exterior features: Wood fencing; Corner lot
Interior
- Kitchen: Electric oven; Electric range; Refrigerator
- Bedrooms: Total rooms: 1
- Flooring: Laminate; Vinyl; Ceramic tile
- Bathrooms: 1 full bathroom; 1 half bathroom; One main-level bathroom
- Heating & cooling: Natural gas heating; Central air conditioning
- Interior features: Refrigerator; Exhaust fan; Electric oven; Electric range; Gas water heater; Water heater; Unfinished basement with sump pump
- Laundry & utility: Washer; Dryer; Washer/dryer stacked; Washer hookup on main level
Neighborhood map
What this means for you Summary
Snapshot
- This is a 3-bed/1.5-bath single-family listed at $148k.
Deal economics
- At list price, monthly cash flow is $119 ($1k/yr) — positive.
- The deal already cash-flows at list — no discount required.
- To meet the 1% rule (rent ≥ 1% of price), the offer needs to be $133k (10.0% below list).
- Recommended offer: $133k (10.0% below list) — sets the bar for 1% rule.
- Cap rate 7.3% vs local median 4.8% in Fort Wayne — top-decile yield for the area; either an underpriced asset or a hidden risk that comps aren't pricing in. Stress-test before assuming the spread holds.
Location & tenants
- Location reads 84/100 on livability (#6 in IN, #676 nationally) — a professional / high-income tenant draw. Strengths: amenities A+, commute A+, cost of living A+; Watch: crime C-, employment D+.
- Fort Wayne Community Schools (urban): math 22% / reading 29% proficiency, ranked #263 of 301 in IN (top 87%) — low school quality limits family demand, transient renter base, plan for 1-2y turnover; 60% free/reduced lunch — lower-income household profile, screen leases tightly.
- Zoned schools: Fairfield Elementary School (math 13% / reading 15%, grade F, #874 of 994 statewide, top 89%, 460 students, 88% FRL); Shawnee Middle School (math 11% / reading 22%, grade F, #287 of 330 statewide, top 88%, 675 students, 65% FRL); South Side High School (math 12% / reading 39%, grade F, #322 of 369 statewide, top 87%, 1,423 students, 73% FRL) — zoned schools average 75% FRL vs 60% district-wide (15 pts higher); higher-poverty schools than district average — tighter screening recommended.
- Market conditions: Rents rising fast (+8.2%/yr); 94 active listings in the ZIP; 37 comparable units currently listed for rent nearby; rentals at typical pace (median 21d on market — plan ~3-4 weeks tenant-placement turnaround); 1,861 units permitted in Allen County in 2024 (576 in 5+ unit buildings).
Forward outlook
- Local home prices are declining (-3.0%/yr); year-one equity from $1k of loan paydown is wiped out by about $4k of value loss. Plan a longer hold.
- Allen County population projected at +10% by 2050 — modest demand growth; plan on rents tracking national, not racing it.
- At projected returns (-3.0% appreciation + 8.0% rent growth), your $41k cash investment doubles in ~10 years — after that, you're playing with house money.
Negotiation context
- It's been on market 16 days — a 2% lower offer ($146k) is reasonable based on typical stale-listing flexibility.
- 5 sale attempts since 9y ago with the ask held roughly flat each time — persistent listings suggest the price (not the market) is what's stuck; bring a comps-based counter.
- Current owner paid $84k; list at $148k implies a 76% gain — meaningful room to come down on a strong offer.
Risks & watch-outs
- Watch-outs: built in 1904 — expect roof / HVAC / electrical / plumbing capex.
Questions for the listing agent
- Built in 1904 — when were the roof, HVAC, electrical panel, plumbing, and water heater last replaced?
- Is there a deadline driving the sale (1031 exchange, divorce, estate, relocation)? That informs how much negotiation room exists.
- Schools are D-rated, which usually means shorter tenancies and higher turnover. Who's the typical renter profile here, and what's been the actual vacancy rate?
- What's the average days-on-market for RENTAL listings here right now (not sales)? A rising rental-DOM trend means longer vacancies and softer asking-rent achievability than the comps imply.
- What's the recent tenant-quality profile in this submarket — average credit score on applications, eviction rate, late-payment / NSF rate, and stable-employment percentage? A property-management company in the area should have these aggregated.
- How much new for-sale + rental construction is in the pipeline within 1–3 miles? Heavy new supply typically softens prices + rents 12–24 months out; constrained supply supports both.
Investment metrics
- 1% rule
- 0.90% ✗
- Cap rate
- 7.26%
- Cash-on-cash
- 3.45%
- DSCR
- 1.15
- GRM
- 9.3
CMA / ARV
- ARV (on-the-fly)
- $192,528
- Comps found
- 12
Show comp detail 12 sales within ~0.75 mi
| Address | Dist | Beds/Ba | Sqft | Sold | Price | $/sf | Match |
|---|---|---|---|---|---|---|---|
| 541 Kinnaird Ave | 0.34mi | 4/1.5 (+1) | 1,728 (+0%) | 2mo | $70,000 | $41 | 77 |
| 709 W Oakdale Dr | 0.60mi | 3/1.5 | 1,640 (-5%) | 2mo | $260,000 | $159 | 63 |
| 3314 Webster St | 0.36mi | 3/1.0 | 1,534 (-11%) | 2mo | $153,000 | $100 | 61 |
| 2431 Fox Ave | 0.38mi | 3/1.5 | 1,522 (-12%) | 3mo | $104,000 | $68 | 60 |
| 1225 Huestis Ave | 0.62mi | 3/1.5 | 1,825 (+6%) | 0mo | $200,000 | $110 | 60 |
| 3606 S Harrison St | 0.52mi | 3/1.5 | 1,555 (-10%) | 2mo | $211,000 | $136 | 58 |
| 3017 S Clinton St | 0.39mi | 4/2.0 (+1) | 1,560 (-9%) | 2mo | $180,000 | $115 | 58 |
| 326 Arcadia Ct | 0.46mi | 3/1.0 | 1,526 (-11%) | 1mo | $171,000 | $112 | 57 |
| 327 Kinsmoor Ave | 0.39mi | 3/2.0 | 1,479 (-14%) | 3mo | $184,000 | $124 | 54 |
| 1020 W Oakdale Dr | 0.71mi | 3/2.0 | 1,600 (-7%) | 1mo | $192,500 | $120 | 52 |
| 3124 Broadway | 0.70mi | 3/2.0 | 1,556 (-10%) | 1mo | $159,900 | $103 | 49 |
| 416 E Creighton Ave | 0.60mi | 3/2.0 | 1,512 (-12%) | 2mo | $62,500 | $41 | 49 |
Match score weights: distance 35% · size 25% · config 20% · recency 20%. Top-matched comps best support the ARV.
Projected returns pro-forma
-3.0% appreciation · 8.0% rent growth · sell at horizon
- IRR
- -5.8%
- Equity multiple
- 0.77×
- Total profit
- $-9,400
- Equity at exit
- $22,067
- IRR
- 8.7%
- Equity multiple
- 1.81×
- Total profit
- $33,467
- Equity at exit
- $12,796
Cash invested: $41,440 (down + closing). Projections, not guarantees.
Landlord ↔ Tenant lean methodology
- Overall (STATE)
- 90 Strongly Landlord-Friendly
- State Indiana
- 90 Strongly Landlord-Friendly · R+11
- County
- — inherits STATE
- City
- — inherits STATE
ZIP-level market 46807
- Rents YoY
- 8.2%
- Active inventory
- 94
- Price-to-rent
- 9.3×
Monthly cashflow live
- Estimated rent
- $1,332 high interval (Pro) →
- Mortgage (P&I)
- −$776
- Tax from tax record
- −$95 /mo · $1,144/yr
- Insurance
- −$62
- HOA
- −$0
- Vacancy / Maint / Mgmt
- −$280
- Net cashflow
- $119
Break-even live
UW: 25.0% down · 7.5% · 30yr · 1.5% tax · 5.0% vac · 8.0% maint · 8.0% mgmt
Financing live
Cash to close
- Down payment
- $37,000
- Closing costs
- $4,440
- Reserves months
- —
- Total cash needed
- —
Loan-product check · same deal, 3 products live
Conventional
25% down · 7.5% · 30yr
- Down + closing
- —
- Monthly P&I
- —
- Monthly cashflow
- —
- DSCR
- —
- Eligible?
- —
Personal DTI + credit; lowest rate.
DSCR
20% down · 8.5% · 30yr
- Down + closing
- —
- Monthly P&I
- —
- Monthly cashflow
- —
- DSCR
- —
- Eligible?
- —
No personal income docs; deal must DSCR.
Hard money
10% down · 12.0% · 12mo
- Down + closing
- —
- Monthly P&I
- —
- Monthly cashflow
- —
- DSCR
- —
- Eligible?
- —
Short-term bridge; refi at stabilization.
Rent comps 37 comps
| Address | Beds | Baths | Sqft | Rent | $/sqft | DOM | Units | Dist |
|---|---|---|---|---|---|---|---|---|
| 2616 S Harrison St Fort Wayne, IN | 4.0 | 2.0 | 1908 | $1,500 | $0.79 | 43d | 1 | 0.15mi |
| 3008 Webster St Fort Wayne, IN | 3.0 | 1.0 | 1344 | $1,449 | $1.08 | 21d | 1 | 0.18mi |
| 116 E Pontiac St Fort Wayne, IN | 3.0 | 1.5 | 1400 | $1,175 | $0.84 | 21d | 1 | 0.25mi |
| 2431 Fox Ave Fort Wayne, IN | 3.0 | 1.5 | 1522 | $1,550 | $1.02 | 13d | 1 | 0.38mi |
| 2118 Webster St Fort Wayne, IN | 4.0 | 1.0 | 2200 | $1,175 | $0.53 | 43d | 1 | 0.40mi |
| 724 Kinnaird Ave Fort Wayne, IN | 3.0 | 1.5 | 1880 | $1,450 | $0.77 | 43d | 1 | 0.42mi |
| 907 Lincoln Ave Fort Wayne, IN | 2.0 | 1.0 | 1060 | $850 | $0.80 | 13d | 1 | 0.43mi |
| 2530 Lafayette St Fort Wayne, IN | 4.0 | 1.0 | 1816 | $1,500 | $0.83 | 43d | 1 | 0.46mi |
| 3510 S Harrison St Fort Wayne, IN | 3.0 | 1.0 | 1248 | $975 | $0.78 | 13d | 1 | 0.50mi |
| 451 E Pontiac St Fort Wayne, IN | 3.0 | 1.0 | 1308 | $1,050 | $0.80 | 43d | 1 | 0.57mi |
| 217 W Masterson Ave Fort Wayne, IN | 2.0 | 1.0 | 1100 | $995 | $0.90 | 21d | 1 | 0.58mi |
| 420 E Dewald St Fort Wayne, IN | 3.0 | 1.5 | 1472 | $1,300 | $0.88 | 43d | 1 | 0.61mi |
| 1353 Huestis Ave Fort Wayne, IN | 4.0 | 1.0 | 1328 | $1,300 | $0.98 | 13d | 1 | 0.76mi |
| 1360 Huestis Ave Fort Wayne, IN | 3.0 | 1.0 | 1056 | $1,080 | $1.02 | 13d | 1 | 0.77mi |
| 1342 Guthrie St Fort Wayne, IN | 3.0 | 1.0 | 1200 | $899 | $0.75 | 43d | 1 | 0.79mi |
| 2430 Thompson Ave Fort Wayne, IN | 2.0 | 1.0 | 1197 | $975 | $0.81 | 13d | 1 | 0.80mi |
| 3801 Lafayette St Fort Wayne, IN | 2.0 | 1.0 | 1116 | $995 | $0.89 | 13d | 1 | 0.82mi |
| 1104 Stophlet St Fort Wayne, IN | 3.0 | 1.5 | 1288 | $1,400 | $1.09 | 13d | 1 | 0.84mi |
| 2133 Riedmiller Ave Fort Wayne, IN | 3.0 | 1.0 | 1056 | $1,050 | $0.99 | 21d | 1 | 0.88mi |
| 603 Lavina St Fort Wayne, IN | 3.0 | 2.0 | 1872 | $1,899 | $1.01 | 43d | 1 | 0.91mi |
| 877 Lavina St Fort Wayne, IN | 1.0–3.0 | 1.0–2.0 | 997 | $2,980 | $2.99 | 43d | 17 | 0.96mi |
| 4201 S Wayne Ave Fort Wayne, IN | 3.0 | 1.5 | 1252 | $1,400 | $1.12 | 21d | 1 | 0.98mi |
| 1250 Ewing St Fort Wayne, IN | 2.0 | 1.0–2.0 | 980 | $2,081 | $2.12 | 21d | 24 | 0.98mi |
| 1024 Colerick St Fort Wayne, IN | 4.0 | 1.0 | 1388 | $1,065 | $0.77 | 21d | 1 | 1.00mi |
| 859 Buchanan St Fort Wayne, IN | 1.0–4.0 | 1.0 | 887 | $1,074 | $1.21 | 21d | 1 | 1.02mi |
| 4133 Lafayette St Fort Wayne, IN | 4.0 | 2.0 | 1640 | $1,400 | $0.85 | 21d | 1 | 1.02mi |
| 1118 Rockhill St Fort Wayne, IN | 3.0 | 3.0 | 1790 | $2,300 | $1.28 | 43d | 1 | 1.08mi |
| 1023 Hamilton Ave Fort Wayne, IN | 3.0 | 1.0 | 1152 | $1,075 | $0.93 | 13d | 1 | 1.13mi |
| 901 W Wayne St Unit 3 Fort Wayne, IN | 2.0 | 2.0 | 1312 | $1,700 | $1.30 | 43d | 1 | 1.22mi |
| 2627 Holton Ave Fort Wayne, IN | 3.0 | 2.0 | 1936 | $1,500 | $0.77 | 13d | 1 | 1.23mi |
| 3009 Holton Ave Fort Wayne, IN | 3.0 | 1.0 | 1212 | $1,400 | $1.16 | 13d | 1 | 1.25mi |
| 835 Van Buren St Fort Wayne, IN | 2.0 | 1.0–2.0 | 750 | $1,995 | $2.66 | 13d | 29 | 1.26mi |
| 915 Garden St Fort Wayne, IN | 2.0 | 2.0 | 1275 | $1,650 | $1.29 | 13d | 1 | 1.29mi |
| 1132 S Hanna St Unit 1 Fort Wayne, IN | 4.0 | 1.5 | 1656 | $1,600 | $0.97 | 43d | 1 | 1.32mi |
| 4405 S Park Dr Fort Wayne, IN | 2.0 | 1.0 | 1440 | $1,175 | $0.82 | 13d | 1 | 1.38mi |
| 1131 E Lewis St Fort Wayne, IN | 4.0 | 2.0 | 1476 | $1,950 | $1.32 | 13d | 1 | 1.45mi |
| 919 Madison St Fort Wayne, IN | 2.0 | 1.0 | 1332 | $995 | $0.75 | 43d | 1 | 1.46mi |
Listing history 11 events
-
2026-06-18days on market $148,000 Active 16 DOM
-
2026-06-17days on market $148,000 Active 15 DOM
-
2026-06-16days on market $148,000 Active 14 DOM
-
2026-06-15days on market $148,000 Active 13 DOM
-
2026-06-14pricedays on market $148,000 Active 11 DOM
-
2026-06-10days on market $154,900 Active 8 DOM
-
2026-06-09days on market $154,900 Active 7 DOM
-
2026-06-08days on market $154,900 Active 6 DOM
-
2026-06-07days on market $154,900 Active 5 DOM
-
2026-06-03remarks 654-char remark
-
2026-06-03$154,900 Active 1 DOM
ⓘ Source: listings_history table (triggers on properties + properties_extension) + one-shot
backfill from property_details.listing_events for pre-trigger history.
Tax reassessment forecast IN · Partial reset (capped growth)
- Current annual tax
- $1,144 · $95/mo
- Projected year-2 tax
- $1,201 · $100/mo
- Expected delta
- +$57/yr (+$5/mo · 5.0%)
ⓘ Screening estimate from a state-policy table — verify with the county assessor before closing.
Climate risk First Street
- Flood 1/10 Low FEMA zone X (unshaded) · 0% chance over 30 yrs
- Wildfire 1/10 Low
- Heat 3/10 Moderate 7 d/yr ≥100°F today · 17 d/yr by 30 yrs out
- Wind 2/10 Low
- Air quality 3/10 Moderate 2 unhealthy d/yr today · 3 by 30 yrs out
Nearby sold comps map
Loading sold comps map…
Walkable amenities ~0.75 mi
Loading nearby amenities…
Taxation est. · year 1
- Rental income
- $15,982
- − Mortgage interest
- −$8,290
- − Property taxes
- −$1,144
- − Insurance
- −$740
- − Repairs & maintenance
- −$1,279
- − Management
- −$1,279
- − Depreciation
- −$4,305
- Taxable loss
- −$1,055
- Est. tax savings @ 24.0%
- +$253
- After-tax cash flow
- $1,681/yr
For passive investors: Depreciation is non-cash, so a rental often shows a tax loss while cash-flowing — sheltering income. Rental losses are passive: they offset passive income freely, and up to $25,000/yr can offset ordinary (W-2) income if you actively participate and your MAGI is under $100k (phasing out to $0 by $150k); unused losses carry forward. On sale, claimed depreciation is recaptured at up to 25%, and gains may owe capital-gains tax (a 1031 exchange can defer both). Figures are a year-1 estimate at your 24.0% rate — not tax advice; consult a CPA.
Schools (NCES district)
- District
- Fort Wayne Community Schools
- NCES district ID
- 1803630
- Math proficiency
- 22% ▼ -11.00%
- Reading proficiency
- 29% ▼ -7.00%
- Median HH income
- $41,951
- Composite
- 21.68/100
- National rank
- #8275
- State rank
- #263 of 301 in IN
Livability — Fort Wayne
- Score
- 84/100
- State rank
- #6
- US rank
- #676
Category grades
Schools grade is shown separately in the Schools card above.
Census & demographics
- Census place
- Fort Wayne, IN
- County
- Allen County · 326,813 people
- City population
- 326,813
- Metro
- Fort Wayne, IN
- Population (ZIP)
- 16,317
- Household income
- $58,685
- Rent vs Own
- Severe rent burden
- 680.0
Population outlook (Allen County) Hauer SSP2
- Today (2025)
- 394,020 people
- By 2030
- 405,128 · +2.8%
- By 2040
- 423,476 · +7.5%
- By 2050
- 435,137 · +10.4%
- By 2075
- 450,293 · +14.3%
- By 2100
- 424,101 · +7.6%
Race, ethnicity, and origin ACS 2023
- Neighborhood character
- Diverse neighborhood (Simpson 0.66)
- Race & ethnicity
- White 54% Two or more races 19% Hispanic / Latino 16% Black 14% Asian 4%
- Hispanic origin (detail)
- Mexican 15%
- Common ancestry
- Slovak 3% Lithuanian 3% Romanian 2%
- Foreign-born
- 9% · Canada, Philippines, Jamaica
- Languages at home
- 82% English-only · Spanish 13% Other Asian/Pacific 4% German/W. Germanic 1%
Political lean MEDSL · Allen
- 2024 margin
- R (+12.5) · D 42.9% · R 55.4% · Other 1.7%
- 2008→2024 swing
- -8.1pp toward R · 2008: -4.3pp · 2024: -12.5pp
- All cycles
- 2024: R+12.5 2020: R+11.2 2016: R+19.6 2012: R+16.8 2008: R+4.3
Not yet ingested
- Civics
- —
Market trends
- HPI YoY
- ▼ -318.66%
- Current HPI
- 272.6238
- Rent YoY
- ▲ 8.24%
- Metro
- Fort Wayne, IN
- State GDP YoY
- ▲ 2.90%
- F500 in state
- 18
Industry mix (Fortune 500 HQ in IN)
| Industry | F500 HQs | Revenue |
|---|---|---|
| Industrial Machinery | 2 | $37B |
|
||
| Healthcare | 1 | $177B |
|
||
| Pharmaceuticals | 1 | $45B |
|
||
| Metals / Steel | 1 | $18B |
|
||
| Agriculture | 1 | $17B |
|
||
| Packaging | 1 | $12B |
|
||
Price history
+210.4% since first listed6 events — show timeline
- 2026-06-03 Listed $154,900 IRMLS
- 2020-06-05 Sold (MLS) $84,000 IRMLS
- 2020-04-21 Listed $87,000 IRMLS
- 2019-01-22 Listed $49,900 IRMLS
- 2018-05-20 Listed $49,988 IRMLS
- 2017-10-22 Listed $49,900 IRMLS
Property tax history
+16.8%/yrLatest (2024): $1,144 · +143.5% YoY. Source: county tax records.
Cash-flow waterfall
monthlySold comps — $/sqft
last 12 mo · ≤1 miLoading sold comps…