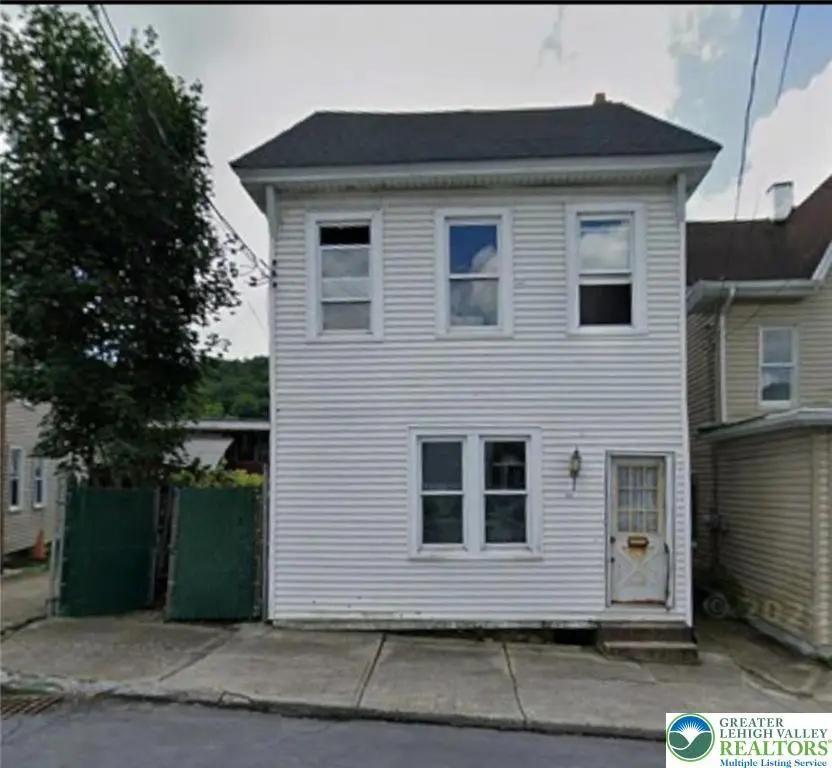
310 W Ridge St · Lansford, PA
Flood risk 1/10 · Minimal
- FEMA flood zone
- X (unshaded)
- Chance of flooding over 30 yrs
- 0.0%
- Est. flood insurance / yr
- $507 – $1,088
Fire risk 3/10 · Minor
- Est. fire insurance / yr
- $511 – $949
Heat risk 3/10 · Minor
- Hot days now (above 94°F)
- 7 days/yr
- Hot days in 30 yrs
- 16 days/yr
Wind risk 4/10 · Minor
- Chance of severe wind over 30 yrs
- 8.0%
Air-quality risk 2/10 · Minimal
- Unhealthy air days now
- 1 days/yr
- Unhealthy air days in 30 yrs
- 3 days/yr
Risk factors via First Street. Map © Google.
Why this score? — see what drove the A grade
The composite is a weighted blend of 9 inputs, each scored 0–100. Each bar is that input's sub-score; the figure is the points it added to the 100-point composite (weight × sub-score).
- Cash flow +30.0/30.0
- ARV discount +15.0/15.0
- 1% rule +10.0/10.0
- DSCR +10.0/10.0
- Appreciation +9.6/10.0
- Livability +3.6/5.0
- Rent growth +2.5/5.0
- Condition / age +2.5/5.0
- Schools +2.0/10.0
$60,000
🖨 Deal sheet 📄 Offer letter ✓ Due diligence
Listing remarks MLS
Attention investors and rehabbers!!! This two-story frame home offers a prime value-added opportunity with strong upside potential. Property sits on a 5,100 SF lot and offers approximately 2,071 SF of interior space. Currently configured as a 4-bedroom, 1-bath home, with potential for a 4-bedroom, 2-bath layout or possible 2-unit conversion (buyer to verify all zoning/use options with township). Major improvements have already started by current owner, including: Roof replaced in 2024, structural prep completed, including joints replacement. Property is ready for framing and next-phase buildout. The lot is a key feature here. It is a deep, oversized street-to-street lot, running from one street all the way to the other, giving you extra flexibility for design, access, and future value Ideal for investors looking for a fix-and-flip, BRRRR, or long-term rental strategy. Bring your contractor and vision to unlock this property's full potential. Sold as-is. Any intended change of use should be independently confirmed with township approvals and permits.
Key facts
- Two story frame home
- 5
- Deep oversized lot
Tags
Neighborhood map
What this means for you Summary
Snapshot
- This is a 4-bed/1.5-bath single-family listed at $60k.
Deal economics
- At list price, monthly cash flow is $856 ($10k/yr) — positive.
- The deal already cash-flows at list — no discount required.
- Meets the 1% rule at list price ($2k rent vs $60k).
- Recommended offer: $55k (9.0% below list) — sets the bar for market timing.
- Cap rate 23.4% vs local median 9.5% in Lansford — top-decile yield for the area; either an underpriced asset or a hidden risk that comps aren't pricing in. Stress-test before assuming the spread holds.
Location & tenants
- Location reads 72/100 on livability (#605 in PA) — a middle-class / working-renter tenant base. Strengths: cost of living A+, health & safety A+, crime A-; Watch: amenities D, schools F, commute F.
- Panther Valley SD (rural): math 14% / reading 35% proficiency, ranked #477 of 539 in PA (top 88%) — low school quality limits family demand, transient renter base, plan for 1-2y turnover.
- Market conditions: 34 active listings in the ZIP; 3 comparable units currently listed for rent nearby; rentals lingering (median 44d on market — plan ~5-8 weeks vacancy on turnover, expect pricing pressure); 67% of comp listings sitting > 30 days — soft ceiling on asking rent; lower-income renter base — watch delinquency; 180 units permitted in Carbon County in 2024 (10 in 5+ unit buildings).
- This rent runs 43% of the median local income ($45k/yr) — at the standard rent-burdened threshold; future hikes will face affordability resistance.
Forward outlook
- In year one you build about $6k of equity ($415 loan paydown + $5k appreciation (9.1% local appreciation)).
- Carbon County population projected at -18% by 2050 — secular population decline; favor cash flow + early exit over multi-decade hold.
- At projected returns (9.1% appreciation + 3.0% rent growth), your $17k cash investment doubles in ~2 years — after that, you're playing with house money.
- By year 6, paydown + projected appreciation supports a ~$34k cash-out refi (75% LTV) — recoverable capital for the next deal without selling this one.
Negotiation context
- It's been on market 98 days — a 9% lower offer ($55k) is reasonable based on typical stale-listing flexibility.
- Current owner paid $18k; list at $60k implies a 233% gain — meaningful room to come down on a strong offer.
Risks & watch-outs
- Watch-outs: built in 1876 — expect roof / HVAC / electrical / plumbing capex.
Questions for the listing agent
- It's been on market 98 days. Have you received any prior offers? Is the seller open to a 9% concession, seller financing, or rate buy-down credit?
- Built in 1876 — when were the roof, HVAC, electrical panel, plumbing, and water heater last replaced?
- Why hasn't it sold? Are there any deal-killer items the seller is aware of (foundation, flood, title, zoning, code violations)?
- Is there a deadline driving the sale (1031 exchange, divorce, estate, relocation)? That informs how much negotiation room exists.
- Schools are F-rated, which usually means shorter tenancies and higher turnover. Who's the typical renter profile here, and what's been the actual vacancy rate?
- What's the average days-on-market for RENTAL listings here right now (not sales)? A rising rental-DOM trend means longer vacancies and softer asking-rent achievability than the comps imply.
- What's the recent tenant-quality profile in this submarket — average credit score on applications, eviction rate, late-payment / NSF rate, and stable-employment percentage? A property-management company in the area should have these aggregated.
- How much new for-sale + rental construction is in the pipeline within 1–3 miles? Heavy new supply typically softens prices + rents 12–24 months out; constrained supply supports both.
Investment metrics
- 1% rule
- 2.65% ✓
- Cap rate
- 23.41%
- Cash-on-cash
- 61.13%
- DSCR
- 3.72
- GRM
- 3.1
CMA / ARV
- ARV (median comp)
- $102,692
- List price
- $60,000
- Delta
- -41.57%
- Verdict
- UNDERPRICED
- Comps
- 20 within 1.0 mi
Show comp detail 8 sales within ~0.75 mi
| Address | Dist | Beds/Ba | Sqft | Sold | Price | $/sf | Match |
|---|---|---|---|---|---|---|---|
| 356 W Bertsch St | 0.11mi | 3/1.5 (-1) | 2,238 (+8%) | 10mo | $82,000 | $37 | 68 |
| 28 E Snyder Dr | 0.44mi | 4/1.5 | 2,174 (+5%) | 6mo | $187,500 | $86 | 66 |
| 232 W Bertsch St | 0.11mi | 4/2.0 | 1,884 (-9%) | 22mo | $189,900 | $101 | 59 |
| 11 Kline Ave | 0.35mi | 5/1.5 (+1) | 1,848 (-11%) | 14mo | $115,000 | $62 | 49 |
| 250 Phillips St | 0.62mi | 3/2.0 (-1) | 2,148 (+4%) | 13mo | $205,000 | $95 | 47 |
| 100 E Front St | 0.50mi | 3/1.5 (-1) | 1,846 (-11%) | 13mo | $135,000 | $73 | 43 |
| 171 1st St | 0.70mi | 3/2.0 (-1) | 1,850 (-11%) | 10mo | $175,000 | $95 | 35 |
| 430 Ludlow St | 0.71mi | 4/1.0 | 1,836 (-11%) | 21mo | $140,000 | $76 | 28 |
Match score weights: distance 35% · size 25% · config 20% · recency 20%. Top-matched comps best support the ARV.
Projected returns pro-forma
9.12% appreciation · 3.0% rent growth · sell at horizon
- IRR
- 72.3%
- Equity multiple
- 5.98×
- Total profit
- $83,611
- Equity at exit
- $50,233
- IRR
- 66.8%
- Equity multiple
- 13.06×
- Total profit
- $202,619
- Equity at exit
- $104,506
Cash invested: $16,800 (down + closing). Projections, not guarantees.
Landlord ↔ Tenant lean methodology
- Overall (STATE)
- 62 Landlord-Friendly
- State Pennsylvania
- 62 Landlord-Friendly · EVEN
- County
- — inherits STATE
- City
- — inherits STATE
ZIP-level market 18232
- Home prices YoY
- 3.6%
- Active inventory
- 34
- Price-to-rent
- 3.1×
Monthly cashflow live
- Estimated rent
- $1,588 medium interval (Pro) →
- Mortgage (P&I)
- −$315
- Tax from tax record
- −$59 /mo · $707/yr
- Insurance
- −$25
- HOA
- −$0
- Vacancy / Maint / Mgmt
- −$333
- Net cashflow
- $856
Break-even live
UW: 25.0% down · 7.5% · 30yr · 1.5% tax · 5.0% vac · 8.0% maint · 8.0% mgmt
Financing live
Cash to close
- Down payment
- $15,000
- Closing costs
- $1,800
- Reserves months
- —
- Total cash needed
- —
Loan-product check · same deal, 3 products live
Conventional
25% down · 7.5% · 30yr
- Down + closing
- —
- Monthly P&I
- —
- Monthly cashflow
- —
- DSCR
- —
- Eligible?
- —
Personal DTI + credit; lowest rate.
DSCR
20% down · 8.5% · 30yr
- Down + closing
- —
- Monthly P&I
- —
- Monthly cashflow
- —
- DSCR
- —
- Eligible?
- —
No personal income docs; deal must DSCR.
Hard money
10% down · 12.0% · 12mo
- Down + closing
- —
- Monthly P&I
- —
- Monthly cashflow
- —
- DSCR
- —
- Eligible?
- —
Short-term bridge; refi at stabilization.
Rent comps 3 comps
| Address | Beds | Baths | Sqft | Rent | $/sqft | DOM | Units | Dist |
|---|---|---|---|---|---|---|---|---|
| 149 W Ridge St Unit 3A Lansford, PA | 3.0 | 1.0 | 1550 | $1,650 | $1.06 | 43d | 1 | 0.18mi |
| 149 W Ridge St Unit 1B Lansford, PA | 3.0 | 1.0 | 1654 | $1,500 | $0.91 | 19d | 1 | 0.18mi |
| 10 Leisenring St Lansford, PA | 3.0 | 1.0 | 1422 | $1,100 | $0.77 | 43d | 1 | 0.93mi |
Listing history 3 events
-
2026-05-08price $60,000 1067-char remark
Show marketing remark (1067 chars)
Attention investors and rehabbers!!! This two-story frame home offers a prime value-added opportunity with strong upside potential. Property sits on a 5,100 SF lot and offers approximately 2,071 SF of interior space. Currently configured as a 4-bedroom, 1-bath home, with potential for a 4-bedroom, 2-bath layout or possible 2-unit conversion (buyer to verify all zoning/use options with township). Major improvements have already started by current owner, including: Roof replaced in 2024, structural prep completed, including joints replacement. Property is ready for framing and next-phase buildout. The lot is a key feature here. It is a deep, oversized street-to-street lot, running from one street all the way to the other, giving you extra flexibility for design, access, and future value Ideal for investors looking for a fix-and-flip, BRRRR, or long-term rental strategy. Bring your contractor and vision to unlock this property's full potential. Sold as-is. Any intended change of use should be independently confirmed with township approvals and permits.
-
2026-02-16$70,000 Active 1067-char remark
Show marketing remark (1067 chars)
Attention investors and rehabbers!!! This two-story frame home offers a prime value-added opportunity with strong upside potential. Property sits on a 5,100 SF lot and offers approximately 2,071 SF of interior space. Currently configured as a 4-bedroom, 1-bath home, with potential for a 4-bedroom, 2-bath layout or possible 2-unit conversion (buyer to verify all zoning/use options with township). Major improvements have already started by current owner, including: Roof replaced in 2024, structural prep completed, including joints replacement. Property is ready for framing and next-phase buildout. The lot is a key feature here. It is a deep, oversized street-to-street lot, running from one street all the way to the other, giving you extra flexibility for design, access, and future value Ideal for investors looking for a fix-and-flip, BRRRR, or long-term rental strategy. Bring your contractor and vision to unlock this property's full potential. Sold as-is. Any intended change of use should be independently confirmed with township approvals and permits.
-
1996-06-10soldstatus $18,000
ⓘ Source: listings_history table (triggers on properties + properties_extension) + one-shot
backfill from property_details.listing_events for pre-trigger history.
Tax reassessment forecast PA · Partial reset (capped growth)
- Current annual tax
- $707 · $59/mo
- Projected year-2 tax
- $827 · $69/mo
- Expected delta
- +$121/yr (+$10/mo · 17.1%)
ⓘ Screening estimate from a state-policy table — verify with the county assessor before closing.
Climate risk First Street
- Flood 1/10 Low FEMA zone X (unshaded) · 0% chance over 30 yrs
- Wildfire 3/10 Moderate
- Heat 3/10 Moderate 7 d/yr ≥94°F today · 16 d/yr by 30 yrs out
- Wind 4/10 Moderate 8% chance of damaging wind over 30 yrs
- Air quality 2/10 Low 1 unhealthy d/yr today · 3 by 30 yrs out
Nearby sold comps map
Loading sold comps map…
Walkable amenities ~0.75 mi
Loading nearby amenities…
Taxation est. · year 1
- Rental income
- $19,054
- − Mortgage interest
- −$3,361
- − Property taxes
- −$707
- − Insurance
- −$300
- − Repairs & maintenance
- −$1,524
- − Management
- −$1,524
- − Depreciation
- −$1,745
- Taxable income
- $9,892
- Est. tax owed @ 24.0%
- −$2,374
- After-tax cash flow
- $7,896/yr
For passive investors: Depreciation is non-cash, so a rental often shows a tax loss while cash-flowing — sheltering income. Rental losses are passive: they offset passive income freely, and up to $25,000/yr can offset ordinary (W-2) income if you actively participate and your MAGI is under $100k (phasing out to $0 by $150k); unused losses carry forward. On sale, claimed depreciation is recaptured at up to 25%, and gains may owe capital-gains tax (a 1031 exchange can defer both). Figures are a year-1 estimate at your 24.0% rate — not tax advice; consult a CPA.
Schools (NCES district)
- District
- Panther Valley SD
- NCES district ID
- 4218450
- Math proficiency
- 14% ▼ -7.00%
- Reading proficiency
- 35% ▼ -14.00%
- Median HH income
- $36,914
- Composite
- 20.31/100
- National rank
- #8613
- State rank
- #477 of 539 in PA
Livability — Lansford
- Score
- 72/100
- State rank
- #605
- US rank
- #5834
Category grades
Schools grade is shown separately in the Schools card above.
Census & demographics
- Census place
- Lansford, PA
- County
- Carbon County · 13,404 people
- City population
- 4,156
- Metro
- Allentown-Bethlehem-Easton, PA-NJ
- Population (ZIP)
- 4,156
- Household income
- $44,713
- Rent vs Own
- Severe rent burden
- 123.0
Population outlook (Carbon County) Hauer SSP2
- Today (2025)
- 61,643 people
- By 2030
- 59,840 · -2.9%
- By 2040
- 55,413 · -10.1%
- By 2050
- 50,843 · -17.5%
- By 2075
- 43,326 · -29.7%
- By 2100
- 37,126 · -39.8%
Race, ethnicity, and origin ACS 2023
- Neighborhood character
- Diverse neighborhood (Simpson 0.55)
- Race & ethnicity
- White 64% Hispanic / Latino 17% Black 11% Two or more races 11% Native American 4%
- Hispanic origin (detail)
- Puerto Rican 5%
- Common ancestry
- Romanian 4% Polish 2% Iranian 2%
- Foreign-born
- 7% · Canada, Jamaica, South Korea
- Languages at home
- 89% English-only · Spanish 10%
Political lean MEDSL · Carbon
- 2024 margin
- Solid R (+34.8) · D 32.2% · R 67.0%
- 2008→2024 swing
- -36.7pp toward R · 2008: 1.9pp · 2024: -34.8pp
- All cycles
- 2024: R+34.8 2020: R+32.0 2016: R+34.1 2012: R+6.9 2008: D+1.9
Not yet ingested
- Civics
- —
Market trends
- HPI YoY
- ▲ 9.12%
- Current HPI
- 262.3396
- Rent YoY
- —
- Metro
- Allentown-Bethlehem-Easton, PA-NJ
- State GDP YoY
- ▲ 1.68%
- F500 in state
- 34
Industry mix (Fortune 500 HQ in PA)
| Industry | F500 HQs | Revenue |
|---|---|---|
| Healthcare | 2 | $309B |
|
||
| Insurance | 2 | $27B |
|
||
| Telecommunications / Media | 1 | $124B |
|
||
| Industrial Distribution | 1 | $22B |
|
||
| Financial Services | 1 | $20B |
|
||
| Chemicals / Materials | 1 | $18B |
|
||
Price history
+233.3% since first listed3 events — show timeline
- 2026-05-08 Price Changed $60,000 GLVRMLS
- 2026-02-16 Listed $70,000 GLVRMLS
- 1996-06-10 Sold (Public Records) $18,000 Public Records
Property tax history
-7.3%/yrLatest (2026): $707 · +2.4% YoY. Source: county tax records.
Cash-flow waterfall
monthlySold comps — $/sqft
last 12 mo · ≤1 miLoading sold comps…