10800 Dale Ave #215 · Stanton, CA
Flood risk 1/10 · Minimal
- FEMA flood zone
- X (shaded)
- Chance of flooding over 30 yrs
- 0.0%
- Est. flood insurance / yr
- $507 – $1,088
Fire risk 1/10 · Minimal
- Est. fire insurance / yr
- $659 – $1,223
Heat risk 6/10 · Moderate
- Hot days now (above 89°F)
- 7 days/yr
- Hot days in 30 yrs
- 24 days/yr
Wind risk 1/10 · Minimal
- Chance of severe wind over 30 yrs
- —
Air-quality risk 5/10 · Moderate
- Unhealthy air days now
- 7 days/yr
- Unhealthy air days in 30 yrs
- 8 days/yr
Risk factors via First Street. Map © Google.
Why this score? — see what drove the B grade
The composite is a weighted blend of 9 inputs, each scored 0–100. Each bar is that input's sub-score; the figure is the points it added to the 100-point composite (weight × sub-score).
- Cash flow +30.0/30.0
- ARV discount +12.9/15.0
- 1% rule +10.0/10.0
- DSCR +10.0/10.0
- Livability +3.2/5.0
- Rent growth +3.1/5.0
- Condition / age +2.5/5.0
- Schools +2.2/10.0
- Appreciation +0.0/10.0
$200,000
🖨 Deal sheet 📄 Offer letter ✓ Due diligence
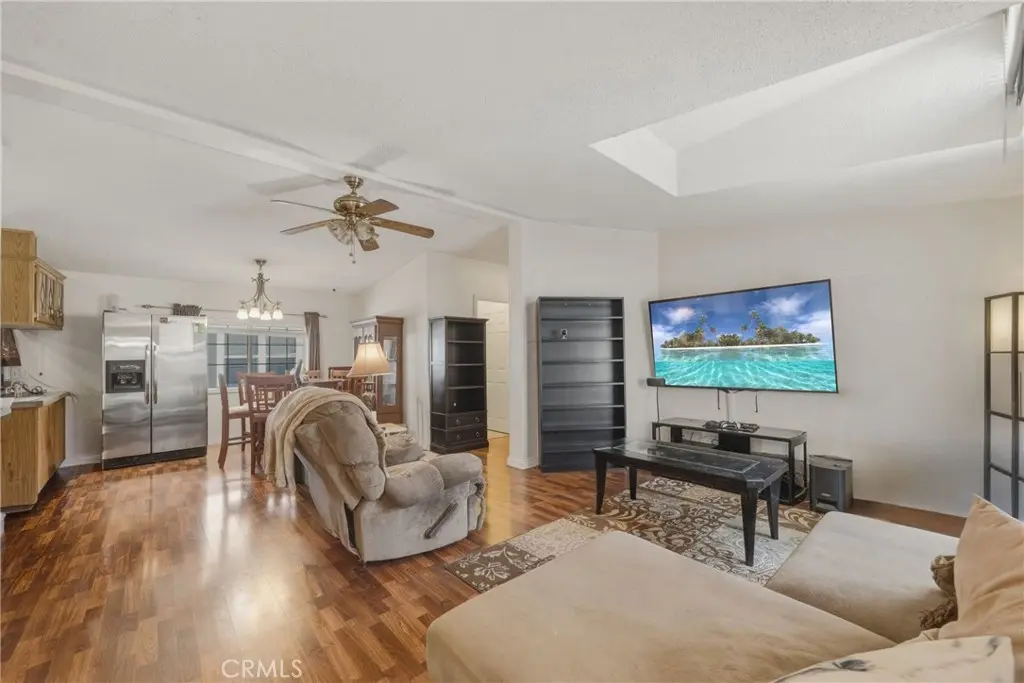
Listing remarks
Nestled in a quiet, well established pride of ownership all ages park is this completely turn key 3 Bedroom, 2 Bathroom gem that certainly checks a lot of boxes. Situated between Beach Blvd and Disneyland off of Katella Ave this is truly the heart of OC. With dedicated tandem 2 car parking, a large storage shed and given the unit's excellent condition, this is the one! Enter to a warm and inviting great room that has a large living area, central dining room which leads to a fully open kitchen. With an abundance of prep and storage space, great light from an over the sink window and a convenient peninsula for even more space to perform your magic this kitchen will be the the hub of all the a
Key facts
- Great room
- Over the sink window
- Large storage shed
Tags
Property features AI
Finance
- Other: Park name: Katella Mobile Home Estates; Access via city streets; driving directions available
- Financial info: Monthly land lease of $2,050 (seller source)
- HOA & community: Part of an association (Katella Mobile Home Estates); Community features include gutters, curbs, street lighting, storm drains, and suburban setting; Pool available through the association; Manager approval required
Exterior
- Parking: Covered tandem carport (2 spaces); Attached carport; Asphalt driveway access (no separate driveway listed)
- Security: Smoke detector(s); Carbon monoxide detector(s)
- Utilities: Public/district water connected; Public sewer (sewer paid); Standard electric service (connected/available); Natural gas connected and available; Cable connected/available; Telephone service available/in street
- Home design: Single-story home; Mobile home model Infinity II (26' x 50'); Mobile home remains on site; Raised foundation; Turnkey condition
- Construction: Wood frame construction; Composition shingle roof; Brick and siding skirt
- Exterior features: Zero lot line setup; Paved surroundings and paved road frontage; Back yard; Secluded location with established corners; Near public transit; One shed on the property; Has a patio; Association pool
Interior
- Kitchen: Gas range; Range/stove hood and vented exhaust fan; Garbage disposal; Kitchen open to family room; Tile counters
- Bedrooms: Primary bedroom on the main floor; All bedrooms on one level
- Flooring: Tile flooring; Wood flooring; Laminate flooring
- Bathrooms: Two full bathrooms; Main-floor full bath; Shower-in-tub and exhaust fans; Formica and Corian counters in baths
- Heating & cooling: Central heating (natural gas furnace); Central electric cooling
- Interior features: Open floor plan; Built-in storage and shelving; Corian and ceramic counters; Tile counters; Cathedral/vaulted ceilings; No interior steps; Smoke and carbon monoxide detectors; Turnkey condition
- Laundry & utility: Inside laundry; Laundry located in closet
Neighborhood map
What this means for you Summary
Snapshot
- This is a 3-bed/2.0-bath manufactured listed at $200k.
Deal economics
- At list price, monthly cash flow is $1k ($14k/yr) — positive.
- The deal already cash-flows at list — no discount required.
- Meets the 1% rule at list price ($3k rent vs $200k).
- Recommended offer: $197k (1.5% below list) — sets the bar for market timing.
- Cap rate 13.2% vs local median 2.5% in Stanton — top-decile yield for the area; either an underpriced asset or a hidden risk that comps aren't pricing in. Stress-test before assuming the spread holds.
Location & tenants
- Location reads 63/100 on livability (#468 in CA) — a middle-class / working-renter tenant base. Strengths: commute A+; Watch: schools C-, amenities D, health & safety D.
- Magnolia Elementary (urban): math 25% / reading 25% proficiency, ranked #397 of 517 in CA (top 77%) — low school quality limits family demand, transient renter base, plan for 1-2y turnover; 74% free/reduced lunch — lower-income household profile, screen leases tightly.
- Market conditions: Rents rising (+2.3%/yr); 48 active listings in the ZIP; 40 comparable units currently listed for rent nearby; rentals leasing fast (median 3d on market — plan ~1-2 weeks tenant-placement turnaround); solid renter incomes; 6,974 units permitted in Orange County in 2024 (3,839 in 5+ unit buildings).
- This rent runs 45% of the median local income ($86k/yr) — at the standard rent-burdened threshold; future hikes will face affordability resistance.
Forward outlook
- Local home prices are declining (-3.0%/yr); year-one equity from $1k of loan paydown is wiped out by about $6k of value loss. Plan a longer hold.
- Orange County population projected at +14% by 2050 — modest demand growth; plan on rents tracking national, not racing it.
- At projected returns (-3.0% appreciation + 2.3% rent growth), your $56k cash investment doubles in ~6 years — after that, you're playing with house money.
Negotiation context
- It's been on market 22 days — a 2% lower offer ($197k) is reasonable based on typical stale-listing flexibility.
- 3 sale attempts since 27y ago with the ask held roughly flat each time — persistent listings suggest the price (not the market) is what's stuck; bring a comps-based counter.
Risks & watch-outs
- Climate carrying-cost: extreme-heat days projected 7→24/yr by 2055 (HVAC capex compounding) — expect insurance premiums to compound above CPI over the hold.
Questions for the listing agent
- Is there a deadline driving the sale (1031 exchange, divorce, estate, relocation)? That informs how much negotiation room exists.
- Crime grade is D in this area — have there been break-ins, vandalism, or insurance claims at this property in the last 3 years? What carrier currently insures it and at what premium?
- What's the average days-on-market for RENTAL listings here right now (not sales)? A rising rental-DOM trend means longer vacancies and softer asking-rent achievability than the comps imply.
- What's the recent tenant-quality profile in this submarket — average credit score on applications, eviction rate, late-payment / NSF rate, and stable-employment percentage? A property-management company in the area should have these aggregated.
- How much new for-sale + rental construction is in the pipeline within 1–3 miles? Heavy new supply typically softens prices + rents 12–24 months out; constrained supply supports both.
Investment metrics
- 1% rule
- 1.60% ✓
- Cap rate
- 13.17%
- Cash-on-cash
- 24.55%
- DSCR
- 2.09
- GRM
- 5.2
CMA / ARV
- ARV (on-the-fly)
- $227,500
- Comps found
- 12
Show comp detail 12 sales within ~0.75 mi
| Address | Dist | Beds/Ba | Sqft | Sold | Price | $/sf | Match |
|---|---|---|---|---|---|---|---|
| 10800 Dale Ave #705 | 0.00mi | 3/2.0 | 1,248 (-4%) | 5mo | $197,500 | $158 | 89 |
| 10800 Dale Ave #131 | 0.00mi | 3/2.0 | 1,296 (-0%) | 15mo | $259,000 | $200 | 87 |
| 10800 Dale Ave #412 | 0.00mi | 4/2.0 (+1) | 1,344 (+3%) | 11mo | $260,000 | $193 | 80 |
| 10800 Dale Ave #125 | 0.00mi | 3/2.0 | 1,440 (+11%) | 11mo | $222,500 | $155 | 73 |
| 8681 Katella Ave #897 | 0.18mi | 3/2.0 | 1,152 (-11%) | 2mo | $224,900 | $195 | 71 |
| 8681 Katella Ave #883 | 0.18mi | 3/2.0 | 1,200 (-8%) | 14mo | $195,000 | $163 | 67 |
| 8681 Katella Ave #898 | 0.18mi | 3/2.0 | 1,440 (+11%) | 9mo | $230,000 | $160 | 67 |
| 10800 Dale Ave #217 | 0.00mi | 3/2.0 | 1,120 (-14%) | 19mo | $230,000 | $205 | 61 |
| 8681 Katella Ave #802 | 0.18mi | 3/2.0 | 1,120 (-14%) | 20mo | $235,000 | $210 | 52 |
| 11250 Beach Blvd #144 | 0.55mi | 3/2.0 | 1,144 (-12%) | 16mo | $200,000 | $175 | 41 |
| 11250 Beach Blvd #122 | 0.55mi | 2/2.0 (-1) | 1,440 (+11%) | 13mo | $149,900 | $104 | 41 |
| 11250 Beach Blvd #11 | 0.55mi | 2/2.0 (-1) | 1,440 (+11%) | 17mo | $140,000 | $97 | 37 |
Match score weights: distance 35% · size 25% · config 20% · recency 20%. Top-matched comps best support the ARV.
Projected returns pro-forma
-3.0% appreciation · 2.33% rent growth · sell at horizon
- IRR
- 17.2%
- Equity multiple
- 1.69×
- Total profit
- $38,458
- Equity at exit
- $29,821
- IRR
- 25.2%
- Equity multiple
- 3.12×
- Total profit
- $118,959
- Equity at exit
- $17,292
Cash invested: $56,000 (down + closing). Projections, not guarantees.
Landlord ↔ Tenant lean methodology
- Overall (STATE)
- 18 Strongly Tenant-Friendly
- State California
- 18 Strongly Tenant-Friendly · D+13
- County
- — inherits STATE
- City
- — inherits STATE
ZIP-level market 90680
- Rents YoY
- 2.3%
- Active inventory
- 48
- Price-to-rent
- 5.2×
Monthly cashflow live
- Estimated rent
- $3,200 high interval (Pro) →
- Mortgage (P&I)
- −$1,049
- Tax est. 1.5%
- −$250 /mo · $3,000/yr
- Insurance
- −$83
- HOA
- −$0
- Vacancy / Maint / Mgmt
- −$672
- Net cashflow
- $1,146
Break-even live
UW: 25.0% down · 7.5% · 30yr · 1.5% tax · 5.0% vac · 8.0% maint · 8.0% mgmt
Financing live
Cash to close
- Down payment
- $50,000
- Closing costs
- $6,000
- Reserves months
- —
- Total cash needed
- —
Loan-product check · same deal, 3 products live
Conventional
25% down · 7.5% · 30yr
- Down + closing
- —
- Monthly P&I
- —
- Monthly cashflow
- —
- DSCR
- —
- Eligible?
- —
Personal DTI + credit; lowest rate.
DSCR
20% down · 8.5% · 30yr
- Down + closing
- —
- Monthly P&I
- —
- Monthly cashflow
- —
- DSCR
- —
- Eligible?
- —
No personal income docs; deal must DSCR.
Hard money
10% down · 12.0% · 12mo
- Down + closing
- —
- Monthly P&I
- —
- Monthly cashflow
- —
- DSCR
- —
- Eligible?
- —
Short-term bridge; refi at stabilization.
Rent comps 40 comps
| Address | Beds | Baths | Sqft | Rent | $/sqft | DOM | Units | Dist |
|---|---|---|---|---|---|---|---|---|
| 10743 Magnolia Ave #101 Anaheim, CA | 2.0 | 2.0 | 913 | $2,500 | $2.74 | 1d | 1 | 0.42mi |
| 8853 Stardust Ln Anaheim, CA | 3.0 | 1.5 | 1126 | $3,875 | $3.44 | 3d | 1 | 0.43mi |
| 11250 Dale St Garden Grove, CA | 1.0–2.0 | 1.0–2.0 | 848 | $2,710 | $3.20 | 2d | 9 | 0.44mi |
| 9014 Stacie Ln #28 Anaheim, CA | 3.0 | 2.0 | 1347 | $3,095 | $2.30 | 1d | 1 | 0.50mi |
| 8882 W Cerritos Ave Anaheim, CA | 2.0 | 1.0 | 980 | $2,495 | $2.55 | 1d | 1 | 0.52mi |
| 1235 Sharon Cir Unit 1231 F2 Anaheim, CA | 2.0 | 2.0 | 910 | $2,495 | $2.74 | 15d | 1 | 0.75mi |
| 7765 Beechwood Way Stanton, CA | 3.0 | 1.5 | 1232 | $3,750 | $3.04 | 1d | 1 | 0.80mi |
| 2828 W Ball Rd Anaheim, CA | 2.0 | 1.0–2.0 | 880 | $2,760 | $3.14 | 1d | 3 | 0.82mi |
| 2828 W Ball Rd Unit D-10 Anaheim, CA | 2.0 | 2.0 | 880 | $2,805 | $3.19 | 17d | 1 | 0.83mi |
| 2828 W Ball Rd Unit N-36 Anaheim, CA | 2.0 | 2.0 | 880 | $2,795 | $3.18 | 17d | 1 | 0.83mi |
| 2828 W Ball Rd Unit G-11 Anaheim, CA | 2.0 | 2.0 | 880 | $2,850 | $3.24 | 17d | 1 | 0.83mi |
| 2648 W Ball Rd Anaheim, CA | 1.0–2.0 | 1.0–2.0 | 843 | $2,600 | $3.08 | 1d | 1 | 0.83mi |
| 2771 W Ball Rd Anaheim, CA | 2.0 | 1.5 | 900 | $2,350 | $2.61 | 1d | 1 | 0.86mi |
| 2880 W Ball Rd Anaheim, CA | 1.0–2.0 | 1.0 | 894 | $2,850 | $3.19 | 1d | 5 | 0.86mi |
| 7684 Ruthann Ave Stanton, CA | 3.0 | 2.0 | 1000 | $3,650 | $3.65 | 3d | 1 | 0.93mi |
| 7545 Katella Ave Stanton, CA | 1.0–2.0 | 1.0 | 900 | $3,053 | $3.39 | 1d | 7 | 0.99mi |
| 10600 Western Ave Stanton, CA | 2.0 | 1.0–2.0 | 915 | $2,475 | $2.70 | 1d | 2 | 1.00mi |
| 9313 Marchand Ave Garden Grove, CA | 3.0 | 3.0 | 1200 | $4,500 | $3.75 | 5d | 1 | 1.01mi |
| 10321 Courtright Rd Stanton, CA | 3.0 | 2.0 | 1202 | $3,700 | $3.08 | 22d | 1 | 1.04mi |
| 11893 Macduff St Garden Grove, CA | 3.0 | 2.0 | 1200 | $3,100 | $2.58 | 24d | 1 | 1.07mi |
| 10361 Iona Way Stanton, CA | 3.0 | 1.5 | 1149 | $3,500 | $3.05 | 1d | 1 | 1.09mi |
| 10250 Masterson Ave Stanton, CA | 3.0 | 2.0 | 1590 | $3,750 | $2.36 | 1d | 1 | 1.10mi |
| 9661 Maureen Dr Unit F Garden Grove, CA | 2.0 | 1.0 | 900 | $2,495 | $2.77 | 44d | 1 | 1.13mi |
| 8052 Fillmore Dr Apt 3 Stanton, CA | 2.0 | 1.5 | 1000 | $2,250 | $2.25 | 2d | 1 | 1.15mi |
| 2449 W Ball Rd Anaheim, CA | 1.0–2.0 | 1.0–2.0 | 1000 | $2,855 | $2.85 | 12d | 4 | 1.21mi |
| 8300 Chapman Ave Stanton, CA | 1.0–2.0 | 1.0 | 860 | $2,545 | $2.96 | 1d | 9 | 1.24mi |
| 2551 W Rome Ave Anaheim, CA | 3.0 | 1.5 | 1130 | $3,850 | $3.41 | 6d | 1 | 1.24mi |
| 12101 Dale Ave #80 Stanton, CA | 3.0 | 2.0 | 1493 | $1,500 | $1.00 | 7d | 1 | 1.26mi |
| 10070 Gilbert St Anaheim, CA | 3.0 | 2.0 | 1250 | $3,095 | $2.48 | 1d | 1 | 1.28mi |
| 3208 W Ravenswood Dr Anaheim, CA | 3.0 | 2.0 | 1636 | $4,000 | $2.44 | 13d | 1 | 1.31mi |
| 10572 Chamberlain Ave Anaheim, CA | 3.0 | 2.0 | 1000 | $3,500 | $3.50 | 10d | 1 | 1.37mi |
| 707 S Webster Ave Anaheim, CA | 2.0 | 2.0 | 980 | $2,822 | $2.88 | 4d | 2 | 1.39mi |
| 627 S Velare St Anaheim, CA | 2.0 | 1.0 | 1037 | $2,494 | $2.41 | 1d | 1 | 1.40mi |
| 627 S Velare St Anaheim, CA | 2.0 | 1.0 | 1095 | $2,494 | $2.28 | 18d | 1 | 1.40mi |
| 10511 Lexington St Unit C Stanton, CA | 2.0 | 1.5 | 900 | $2,300 | $2.56 | 1d | 1 | 1.40mi |
| 707 S Webster Ave Unit 108 Anaheim, CA | 2.0 | 2.0 | 980 | $2,850 | $2.91 | 1d | 1 | 1.40mi |
| 2970 W Orange Ave Unit B028 Anaheim, CA | 2.0 | 2.0 | 1100 | $2,880 | $2.62 | 17d | 1 | 1.43mi |
| 35 Bigsby Dr Stanton, CA | 3.0 | 3.0 | 1355 | $4,000 | $2.95 | 24d | 1 | 1.45mi |
| 33 Bigsby Dr Stanton, CA | 3.0 | 3.5 | 1625 | $3,950 | $2.43 | 44d | 1 | 1.45mi |
| 3 Bigsby Dr Stanton, CA | 3.0 | 3.0 | 1355 | $3,950 | $2.92 | 17d | 1 | 1.45mi |
Listing history 19 events
-
2026-06-18days on market $200,000 Active 22 DOM
-
2026-06-17days on market $200,000 Active 21 DOM
-
2026-06-16days on market $200,000 Active 20 DOM
-
2026-06-15days on market $200,000 Active 19 DOM
-
2026-06-13days on market $200,000 Active 17 DOM
-
2026-06-13days on market $200,000 Active 16 DOM
-
2026-06-09days on market $200,000 Active 13 DOM
-
2026-06-08days on market $200,000 Active 12 DOM
-
2026-06-07days on market $200,000 Active 11 DOM
-
2026-06-04days on market $200,000 Active 8 DOM
-
2026-06-03days on market $200,000 Active 7 DOM
-
2026-06-02days on market $200,000 Active 6 DOM
-
2026-06-01days on market $200,000 Active 5 DOM
-
2026-05-31days on market $200,000 Active 4 DOM
-
2026-05-27$200,000 Active
-
2010-10-24historical
-
2010-07-24$54,900 Active
-
2000-02-19historical
-
1999-10-20$70,000
ⓘ Source: listings_history table (triggers on properties + properties_extension) + one-shot
backfill from property_details.listing_events for pre-trigger history.
Climate risk First Street
- Flood 1/10 Low FEMA zone X (shaded) · 0% chance over 30 yrs
- Wildfire 1/10 Low
- Heat 6/10 Major 7 d/yr ≥89°F today · 24 d/yr by 30 yrs out
- Wind 1/10 Low
- Air quality 5/10 Major 7 unhealthy d/yr today · 8 by 30 yrs out
Nearby sold comps map
Loading sold comps map…
Walkable amenities ~0.75 mi
Loading nearby amenities…
Taxation est. · year 1
- Rental income
- $38,396
- − Mortgage interest
- −$11,203
- − Property taxes
- −$3,000
- − Insurance
- −$1,000
- − Repairs & maintenance
- −$3,072
- − Management
- −$3,072
- − Depreciation
- −$5,818
- Taxable income
- $11,231
- Est. tax owed @ 24.0%
- −$2,695
- After-tax cash flow
- $11,051/yr
For passive investors: Depreciation is non-cash, so a rental often shows a tax loss while cash-flowing — sheltering income. Rental losses are passive: they offset passive income freely, and up to $25,000/yr can offset ordinary (W-2) income if you actively participate and your MAGI is under $100k (phasing out to $0 by $150k); unused losses carry forward. On sale, claimed depreciation is recaptured at up to 25%, and gains may owe capital-gains tax (a 1031 exchange can defer both). Figures are a year-1 estimate at your 24.0% rate — not tax advice; consult a CPA.
Schools (NCES district)
- District
- Magnolia Elementary
- NCES district ID
- 0623430
- Math proficiency
- 25% ▼ -21.00%
- Reading proficiency
- 25% ▼ -29.00%
- Median HH income
- $50,320
- Composite
- 22.09/100
- National rank
- #8181
- State rank
- #397 of 517 in CA
Livability — Stanton
- Score
- 63/100
- State rank
- #468
- US rank
- #15945
Category grades
Schools grade is shown separately in the Schools card above.
Census & demographics
- Census place
- Stanton, CA
- County
- Orange County · 3,096,323 people
- City population
- 31,991
- Metro
- Los Angeles-Long Beach-Anaheim, CA
- Population (ZIP)
- 31,991
- Household income
- $85,592
- Rent vs Own
- Severe rent burden
- 1745.0
Population outlook (Orange County) Hauer SSP2
- Today (2025)
- 3,477,456 people
- By 2030
- 3,613,117 · +3.9%
- By 2040
- 3,835,945 · +10.3%
- By 2050
- 3,968,736 · +14.1%
- By 2075
- 4,097,053 · +17.8%
- By 2100
- 3,903,633 · +12.3%
Race, ethnicity, and origin ACS 2023
- Neighborhood character
- Diverse neighborhood (Simpson 0.64)
- Race & ethnicity
- Hispanic / Latino 50% Asian 27% White 17% Two or more races 12% Black 2% Native American 1%
- Hispanic origin (detail)
- Mexican 42%
- Common ancestry
- Italian 1% Iranian 0%
- Foreign-born
- 42% · Canada, Vietnam, South Korea
- Languages at home
- 35% English-only · Spanish 39% Vietnamese 17% Tagalog/Filipino 2%
Political lean MEDSL · Orange
- 2024 margin
- Toss-up / Even · D 49.7% · R 47.1% · Other 3.2%
- 2008→2024 swing
- +5.2pp toward D · 2008: -2.6pp · 2024: 2.6pp
- All cycles
- 2024: D+2.6 2020: D+9.0 2016: D+7.7 2012: R+8.3 2008: R+2.6
Not yet ingested
- Civics
- —
Market trends
- HPI YoY
- ▼ -529.54%
- Current HPI
- 447.9557
- Rent YoY
- ▲ 2.33%
- Metro
- Los Angeles-Long Beach-Anaheim, CA
- State GDP YoY
- ▲ 3.21%
- F500 in state
- 116
Industry mix (Fortune 500 HQ in CA)
| Industry | F500 HQs | Revenue |
|---|---|---|
| Technology | 27 | $1,492B |
|
||
| Financial Services | 3 | $174B |
|
||
| Retail | 3 | $44B |
|
||
| Insurance | 3 | $26B |
|
||
| Media / Entertainment | 2 | $115B |
|
||
| Pharmaceuticals / Biotech | 2 | $62B |
|
||
Price history
+185.7% since first listed5 events — show timeline
- 2026-05-27 Listed $200,000 CRMLS
- 2010-10-24 Listing Removed — CRMLS
- 2010-07-24 Listed $54,900 CRMLS
- 2000-02-19 Listing Removed — CRMLS
- 1999-10-20 Listed $70,000 CRMLS
Property tax history
-6.5%/yrLatest (2025): $123 · -4.3% YoY. Source: county tax records.
Cash-flow waterfall
monthlySold comps — $/sqft
last 12 mo · ≤1 miLoading sold comps…