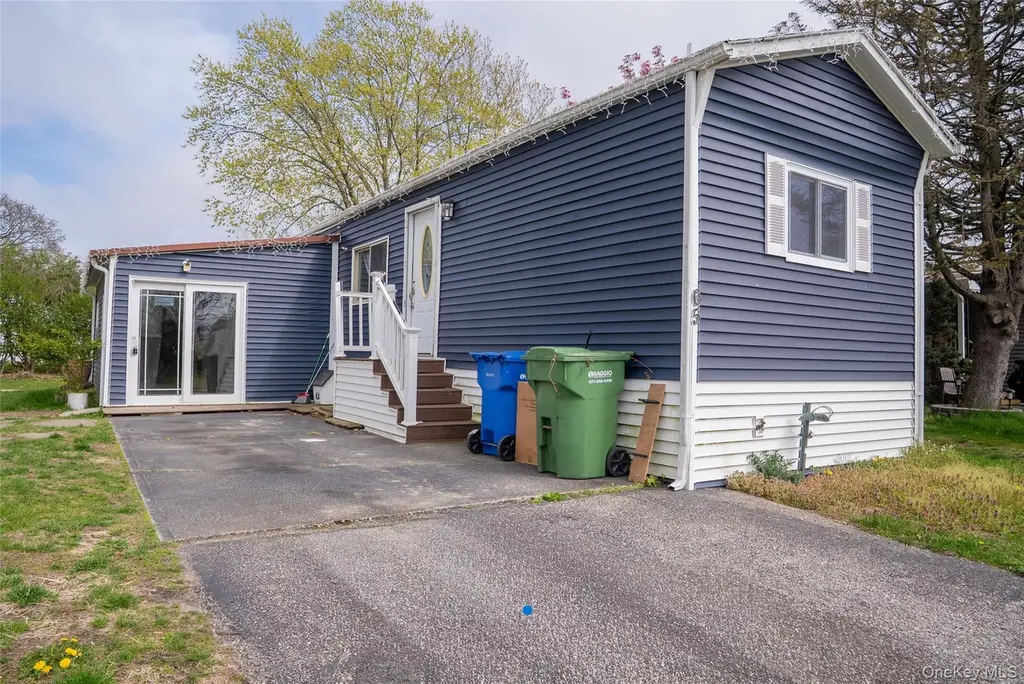
65 Minuteman Dr · Bohemia, NY
Flood risk 1/10 · Minimal
- FEMA flood zone
- X (unshaded)
- Chance of flooding over 30 yrs
- 0.0%
- Est. flood insurance / yr
- $507 – $1,088
Fire risk 1/10 · Minimal
- Est. fire insurance / yr
- $691 – $1,283
Heat risk 4/10 · Minor
- Hot days now (above 93°F)
- 7 days/yr
- Hot days in 30 yrs
- 17 days/yr
Wind risk 6/10 · Moderate
- Chance of severe wind over 30 yrs
- 72.0%
Air-quality risk 4/10 · Minor
- Unhealthy air days now
- 4 days/yr
- Unhealthy air days in 30 yrs
- 6 days/yr
Risk factors via First Street. Map © Google.
Why this score? — see what drove the D grade
The composite is a weighted blend of 9 inputs, each scored 0–100. Each bar is that input's sub-score; the figure is the points it added to the 100-point composite (weight × sub-score).
- ARV discount +12.1/15.0
- 1% rule +10.0/10.0
- Schools +5.9/10.0
- Cash flow +5.6/30.0
- Livability +3.1/5.0
- Rent growth +2.5/5.0
- Condition / age +2.2/5.0
- DSCR +0.0/10.0
- Appreciation +0.0/10.0
$179,000
🖨 Deal sheet (PDF) 📄 Offer letter ✓ Due diligence
Listing remarks
Welcome to 65 Minuteman Dr this house offer a lot confort , convenience, and great potential. This is a 2 bedroom, 1 full bathroom , and kitchen mobile home. HOA covers: Sewer, water, trash, snow removal Any potential buyers must be approved by Bunker Valley
Key facts
- Built 1973
- Listed 47 days
Property features AI
Finance
- HOA & community: Community association: Bunker Valley; Monthly association fee; Association fee covers sewer, snow removal, trash, and water
Exterior
- Parking: On-street parking; Other parking
- Utilities: Electricity available (PSEG); Propane; Water available; Sewer connected (shared)
- Home design: Mobile home
- Construction: Mobile home construction; Other foundation
- Exterior features: Other construction materials; Other foundation details; Not waterfront
Interior
- Kitchen: Gas range; Refrigerator; Stainless steel appliances; Other kitchen appliances
- Bedrooms: Includes first-floor bedroom
- Bathrooms: 1 full bathroom
- Heating & cooling: Propane heating; No cooling
- Interior features: First-floor bedroom; First-floor full bathroom; Natural woodwork; Other interior features
- Laundry & utility: Propane available
Neighborhood map
What this means for you Summary
Snapshot
- This is a 2-bed/1.0-bath manufactured listed at $179k. Condition is rated fair.
Deal economics
- At list price, monthly cash flow is $-372 ($-4k/yr) — negative.
- To cash-flow at today's rent, offer at most $125k (30.1% below list).
- Meets the 1% rule at list price ($3k rent vs $179k).
- Recommended offer: $125k (30.1% below list) — sets the bar for cash-flow.
- Cap rate 3.8% vs local median 2.4% in Bohemia — top-decile yield for the area; either an underpriced asset or a hidden risk that comps aren't pricing in. Stress-test before assuming the spread holds.
Location & tenants
- Location reads 62/100 on livability (#838 in NY) — a middle-class / working-renter tenant base. Strengths: employment A+, housing A+, crime A-; Watch: amenities F, commute F, cost of living F.
- Connetquot Central School District (suburban): math 67% / reading 63% proficiency, ranked #155 of 590 in NY (top 26%) — acceptable for families but not a draw, mixed tenant base, ~2y average lease; only 13% free/reduced lunch — higher-income household profile.
- Zoned schools: Sycamore Avenue Elementary School (math 34% / reading 54%, grade F, #1,277 of 2,108 statewide, top 64%, 382 students, 28% FRL); Oakdale-Bohemia Middle School (math 62% / reading 67%, grade A-, #121 of 729 statewide, top 17%, 634 students, 22% FRL); Connetquot High School (math 96% / reading 72%, grade A, #404 of 1,100 statewide, top 37%, 1,757 students, 27% FRL).
- Market conditions: 48 active listings in the ZIP; 29 comparable units currently listed for rent nearby; rentals at typical pace (median 24d on market — plan ~3-4 weeks tenant-placement turnaround); 48% of comp listings sitting > 30 days — soft ceiling on asking rent; 1,366 units permitted in Suffolk County in 2024 (216 in 5+ unit buildings).
Forward outlook
- Local home prices are declining (-3.0%/yr); year-one equity from $1k of loan paydown is wiped out by about $5k of value loss. Plan a longer hold.
- Suffolk County population projected to shrink 5% by 2050 — rents likely to lag national; underwrite the cash flow, not the appreciation.
Negotiation context
- It's been on market 48 days — a 3% lower offer ($174k) is reasonable based on typical stale-listing flexibility.
Risks & watch-outs
- Watch-outs: HOA is 49% of rent.
- Climate carrying-cost: major wind risk, 72% chance of damaging wind over 30y — expect insurance premiums to compound above CPI over the hold.
Questions for the listing agent
- What do current leases actually rent for vs. the listed asking? Can we see a recent rent roll and the last 12 months of T-12 income?
- It's been on market 48 days. Have you received any prior offers? Is the seller open to a 30% concession, seller financing, or rate buy-down credit?
- Have any recent inspections been done? Can we get a copy of the seller's disclosures and any deferred-maintenance estimates?
- Built in 1973 — when were the roof, HVAC, electrical panel, plumbing, and water heater last replaced?
- What does the HOA fee cover, when was the last increase, and are there any pending special assessments or reserve-fund shortfalls?
- Is there a deadline driving the sale (1031 exchange, divorce, estate, relocation)? That informs how much negotiation room exists.
- Schools are B-rated — typically a magnet for longer-tenancy family renters. What's the average tenant stay here, and is there a school-zone premium baked into asking?
- The area grade is low — what's the realistic commute time and amenity access for the typical tenant pool here? Any planned neighborhood developments (good or bad) we should know about?
- What's the average days-on-market for RENTAL listings here right now (not sales)? A rising rental-DOM trend means longer vacancies and softer asking-rent achievability than the comps imply.
- What's the recent tenant-quality profile in this submarket — average credit score on applications, eviction rate, late-payment / NSF rate, and stable-employment percentage? A property-management company in the area should have these aggregated.
- How much new for-sale + rental construction is in the pipeline within 1–3 miles? Heavy new supply typically softens prices + rents 12–24 months out; constrained supply supports both.
Investment metrics
- 1% rule
- 1.62% ✓
- Cap rate
- 3.80%
- Cash-on-cash
- -8.90%
- DSCR
- 0.60
- GRM
- 5.2
CMA / ARV
- ARV (median comp)
- $199,509
- List price
- $179,000
- Delta
- -10.28%
- Verdict
- UNDERPRICED
- Comps
- 17 within 1.0 mi
Show comp detail 12 sales within ~0.75 mi
| Address | Dist | Beds/Ba | Sqft | Sold | Price | $/sf | Match |
|---|---|---|---|---|---|---|---|
| 36 Betsy Ross Dr | 0.10mi | 2/1.0 | 960 (-1%) | 7mo | $189,011 | $197 | 88 |
| 74 Ticonderoga Dr | 0.11mi | 2/1.0 | 980 (+1%) | 10mo | $220,000 | $224 | 85 |
| 13 Buttercup Dr | 0.19mi | 3/1.0 (+1) | 980 (+1%) | 3mo | $245,000 | $250 | 82 |
| 22 Daisy Dr | 0.18mi | 2/1.0 | 980 (+1%) | 9mo | $136,000 | $139 | 82 |
| 40 Buttercup Dr | 0.15mi | 3/1.0 (+1) | 950 (-2%) | 3mo | $195,000 | $205 | 82 |
| 49 Minuteman Dr | 0.07mi | 2/1.0 | 960 (-1%) | 17mo | $269,000 | $280 | 81 |
| 47 Betsy Ross Dr | 0.08mi | 2/1.0 | 900 (-7%) | 9mo | $259,000 | $288 | 77 |
| 31 Periwinkle Dr | 0.12mi | 2/1.0 | 1,000 (+3%) | 15mo | $95,000 | $95 | 77 |
| 7 Betsy Ross Dr NW | 0.21mi | 3/2.0 (+1) | 960 (-1%) | 6mo | $233,500 | $243 | 74 |
| 44 Ticonderoga | 0.07mi | 2/2.0 | 900 (-7%) | 15mo | $217,000 | $241 | 68 |
| 12 Periwinkle Dr | 0.23mi | 2/1.0 | 830 (-14%) | 5mo | $149,000 | $180 | 61 |
| 1133 Lincoln Ave | 0.73mi | 2/1.0 | 1,056 (+9%) | 7mo | $210,000 | $199 | 45 |
Match score weights: distance 35% · size 25% · config 20% · recency 20%. Top-matched comps best support the ARV.
Projected returns pro-forma
-3.0% appreciation · 3.0% rent growth · sell at horizon
- IRR
- -31.2%
- Equity multiple
- -0.03×
- Total profit
- $-51,777
- Equity at exit
- $26,689
- IRR
- -31.0%
- Equity multiple
- -0.43×
- Total profit
- $-71,867
- Equity at exit
- $15,477
Cash invested: $50,120 (down + closing). Projections, not guarantees.
Landlord ↔ Tenant lean methodology
- Overall (STATE)
- 15 Strongly Tenant-Friendly
- State New York
- 15 Strongly Tenant-Friendly · D+10
- County
- — inherits STATE
- City
- — inherits STATE
ZIP-level market 11716
- Active inventory
- 48
- Price-to-rent
- 5.2×
Monthly cashflow live
- Estimated rent
- $2,891 high interval (Pro) →
- Mortgage (P&I)
- −$939
- Tax est. 1.5%
- −$224 /mo · $2,685/yr
- Insurance
- −$75
- HOA
- −$1,419
- Vacancy / Maint / Mgmt
- −$607
- Net cashflow
- $-372
Break-even live
Sensitivity live
| Price | -10% $-248 | -5% $-310 | +0% $-372 | +5% $-434 | +10% $-496 |
|---|---|---|---|---|---|
| Rent | -10% $-600 | -5% $-486 | +0% $-372 | +5% $-258 | +10% $-143 |
| Rate | -1.0pp $-282 | -0.5pp $-326 | base $-372 | +0.5pp $-418 | +1.0pp $-465 |
UW: 25.0% down · 7.5% · 30yr · 1.5% tax · 5.0% vac · 8.0% maint · 8.0% mgmt
Financing live
Cash to close
- Down payment
- $44,750
- Closing costs
- $5,370
- Reserves months
- —
- Total cash needed
- —
Loan-product check · same deal, 3 products live
Conventional
25% down · 7.5% · 30yr
- Down + closing
- —
- Monthly P&I
- —
- Monthly cashflow
- —
- DSCR
- —
- Eligible?
- —
Personal DTI + credit; lowest rate.
DSCR
20% down · 8.5% · 30yr
- Down + closing
- —
- Monthly P&I
- —
- Monthly cashflow
- —
- DSCR
- —
- Eligible?
- —
No personal income docs; deal must DSCR.
Hard money
10% down · 12.0% · 12mo
- Down + closing
- —
- Monthly P&I
- —
- Monthly cashflow
- —
- DSCR
- —
- Eligible?
- —
Short-term bridge; refi at stabilization.
Rent comps 29 comps
| Address | Beds | Baths | Sqft | Rent | $/sqft | DOM | Units | Dist |
|---|---|---|---|---|---|---|---|---|
| 1000 Saddle Rock Rd Holbrook, NY | 1.0–2.0 | 1.0–2.0 | 1050 | $3,390 | $3.23 | 0d | 1 | 0.43mi |
| 400 Adams Way Sayville, NY | 1.0–2.0 | 1.0–2.0 | 995 | $3,195 | $3.21 | 0d | 1 | 0.48mi |
| 804 Saddle Rock Rd Unit 804 Holbrook, NY | 1.0 | 1.0 | 1000 | $2,895 | $2.90 | 45d | 1 | 0.49mi |
| 219 Adams Way Unit 219 Sayville, NY | 1.0 | 1.0 | 830 | $2,665 | $3.21 | 45d | 1 | 0.51mi |
| 30 Westgate Dr Unit HD13 Bohemia, NY | 1.0 | 1.0 | 630 | $2,645 | $4.20 | 24d | 1 | 0.58mi |
| 327 Adams Way Unit 327 Sayville, NY | 1.0 | 1.0 | 830 | $2,690 | $3.24 | 6d | 1 | 0.61mi |
| 25 Westgate Dr Unit ED09 Bohemia, NY | 1.0 | 1.0 | 808 | $2,620 | $3.24 | 45d | 1 | 0.62mi |
| 50 Chelsea Ct Unit HS18 Bohemia, NY | 1.0 | 1.0 | 676 | $2,630 | $3.89 | 45d | 1 | 0.63mi |
| 67 Adams Way Unit 67 Sayville, NY | 2.0 | 2.0 | 1120 | $3,195 | $2.85 | 22d | 1 | 0.63mi |
| 60 Adams Way Unit 60 Sayville, NY | 1.0 | 1.0 | 915 | $2,535 | $2.77 | 45d | 1 | 0.65mi |
| 61 Adams Way Unit 61 Sayville, NY | 1.0 | 1.0 | 830 | $2,690 | $3.24 | 6d | 1 | 0.65mi |
| 17 Eastover Rd Sayville, NY | 2.0 | 1.0 | 980 | $3,400 | $3.47 | 12d | 1 | 0.72mi |
| 1806 Saddle Rock Rd Unit 1806 Holbrook, NY | 1.0 | 1.0 | 1000 | $2,850 | $2.85 | 46d | 1 | 0.74mi |
| 2010 Saddle Rock Rd Unit 2010 Holbrook, NY | 1.0 | 1.0 | 1000 | $2,880 | $2.88 | 17d | 1 | 0.75mi |
| 2200 Dolphin Ln Holbrook, NY | 1.0–2.0 | 1.0–2.0 | 1150 | $3,550 | $3.09 | 0d | 1 | 1.07mi |
| 72 Johnson Ave Unit 4-1F Sayville, NY | 1.0 | 1.0 | 650 | $2,290 | $3.52 | 3d | 1 | 1.27mi |
| 235 Lakeland Ave Unit 24-B Sayville, NY | 1.0 | 1.0 | 825 | $2,405 | $2.92 | 24d | 1 | 1.27mi |
| 65 Island Blvd Unit 65B Bohemia, NY | 1.0 | 1.0 | 808 | $2,630 | $3.25 | 45d | 1 | 1.29mi |
| 222 Lakeland Ave Unit I4 Sayville, NY | 1.0 | 1.0 | 735 | $2,520 | $3.43 | 46d | 1 | 1.29mi |
| 219 Lakeland Ave Unit 1-7B Sayville, NY | 2.0 | 1.0 | 950 | $2,895 | $3.05 | 45d | 1 | 1.31mi |
| 57 Island Blvd Unit 57E Bohemia, NY | 1.0 | 1.0 | 771 | $2,605 | $3.38 | 45d | 1 | 1.32mi |
| 49 Island Blvd Unit 49B Bohemia, NY | 2.0 | 1.0 | 1091 | $3,100 | $2.84 | 45d | 1 | 1.37mi |
| 31 Briarlane Walk Unit 31 Holbrook, NY | 1.0 | 1.0 | 775 | $2,520 | $3.25 | 6d | 1 | 1.38mi |
| 23 Briarlane Walk Unit 23 Holbrook, NY | 2.0 | 1.0 | 950 | $3,000 | $3.16 | 17d | 1 | 1.38mi |
| 47 Island Blvd Bohemia, NY | 1.0–2.0 | 1.0 | 917 | $3,100 | $3.38 | 0d | 1 | 1.40mi |
| 102 Sunlight Walk Holbrook, NY | 1.0–3.0 | 1.0–2.0 | 1141 | $3,715 | $3.25 | 0d | 1 | 1.42mi |
| 7 Twilight Walk Unit 7 Holbrook, NY | 1.0 | 1.0 | 775 | $2,495 | $3.22 | 46d | 1 | 1.43mi |
| 125 Moonlight Walk Unit 125 Holbrook, NY | 2.0 | 1.0 | 950 | $3,085 | $3.25 | 45d | 1 | 1.49mi |
| 90 Moonlight Walk Unit 90 Holbrook, NY | 1.0 | 1.0 | 700 | $2,430 | $3.47 | 45d | 1 | 1.49mi |
HOA detail
- Monthly dues
- $1,419 · $17,028/yr
- Likely covers
- watersewertrashsnow removal
Listing history 16 events
-
2026-06-21days on market $179,000 Active 48 DOM
-
2026-06-18days on market $179,000 Active 45 DOM
-
2026-06-17days on market $179,000 Active 44 DOM
-
2026-06-16days on market $179,000 Active 43 DOM
-
2026-06-15days on market $179,000 Active 42 DOM
-
2026-06-13days on market $179,000 Active 40 DOM
-
2026-06-13days on market $179,000 Active 39 DOM
-
2026-06-09days on market $179,000 Active 36 DOM
-
2026-06-08days on market $179,000 Active 35 DOM
-
2026-06-07days on market $179,000 Active 34 DOM
-
2026-06-04days on market $179,000 Active 31 DOM
-
2026-06-03days on market $179,000 Active 30 DOM
-
2026-06-02days on market $179,000 Active 29 DOM
-
2026-06-01days on market $179,000 Active 28 DOM
-
2026-05-31days on market $179,000 Active 27 DOM
-
2026-04-30$179,000 Active 257-char remark
ⓘ Source: listings_history table (triggers on properties + properties_extension) + one-shot
backfill from property_details.listing_events for pre-trigger history.
Climate risk First Street
- Flood 1/10 Low FEMA zone X (unshaded) · 0% chance over 30 yrs
- Wildfire 1/10 Low
- Heat 4/10 Moderate 7 d/yr ≥93°F today · 17 d/yr by 30 yrs out
- Wind 6/10 Major 72% chance of damaging wind over 30 yrs
- Air quality 4/10 Moderate 4 unhealthy d/yr today · 6 by 30 yrs out
Nearby sold comps map
Loading sold comps map…
Walkable amenities ~0.75 mi
Loading nearby amenities…
Taxation est. · year 1
- Rental income
- $34,696
- − Mortgage interest
- −$10,027
- − Property taxes
- −$2,685
- − Insurance
- −$895
- − Repairs & maintenance
- −$2,776
- − Management
- −$2,776
- − HOA
- −$17,028
- − Depreciation
- −$5,207
- Taxable loss
- −$6,698
- Est. tax savings @ 24.0%
- +$1,607
- After-tax cash flow
- $-2,855/yr
For passive investors: Depreciation is non-cash, so a rental often shows a tax loss while cash-flowing — sheltering income. Rental losses are passive: they offset passive income freely, and up to $25,000/yr can offset ordinary (W-2) income if you actively participate and your MAGI is under $100k (phasing out to $0 by $150k); unused losses carry forward. On sale, claimed depreciation is recaptured at up to 25%, and gains may owe capital-gains tax (a 1031 exchange can defer both). Figures are a year-1 estimate at your 24.0% rate — not tax advice; consult a CPA.
Condition & rehab AI · 19 photos
This mobile home requires moderate repairs and maintenance, including roof and exterior siding, to improve its condition and value.
Repairs flagged
- Major roof — visible wear
- Major exterior siding — blue siding appears worn
Value-add opportunities
- Both paint interior walls — enhances curb appeal and interior aesthetics
- Both replace air conditioning unit — improves comfort and energy efficiency
- Both repair roof — extends lifespan and improves curb appeal
Renovation cost estimate screening
| Repair item | Severity | Est. cost |
|---|---|---|
| roof · visible wear | Major | $15,000–50,000 |
| exterior siding · blue siding appears worn | Major | $15,000–50,000 |
| Total estimated repair cost · 2 items | $30,000–100,000 |
Value-add ROI direction
- Both paint interior walls — enhances curb appeal and interior aesthetics ↑
- Both replace air conditioning unit — improves comfort and energy efficiency ↑
- Both repair roof — extends lifespan and improves curb appeal ↑
ⓘ Cost ranges are severity-bucket heuristics (US national rule-of-thumb). Get contractor quotes + a written scope before underwriting a rehab budget.
Schools (NCES district)
- District
- Connetquot Central School District
- NCES district ID
- 3608160
- Math proficiency
- 67% ▼ -9.00%
- Reading proficiency
- 63% ▼ -6.00%
- Median HH income
- $88,180
- Composite
- 58.89/100
- National rank
- #970
- State rank
- #155 of 590 in NY
Livability — Bohemia
- Score
- 62/100
- State rank
- #838
- US rank
- #16290
Category grades
Schools grade is shown separately in the Schools card above.
Census & demographics
- Census place
- Bohemia, NY
- City population
- 9,750
- Population (ZIP)
- 9,750
Population outlook (Suffolk County) Hauer SSP2
- Today (2025)
- 1,505,262 people
- By 2030
- 1,498,318 · -0.5%
- By 2040
- 1,471,101 · -2.3%
- By 2050
- 1,424,848 · -5.3%
- By 2075
- 1,337,157 · -11.2%
- By 2100
- 1,217,720 · -19.1%
Race, ethnicity, and origin ACS 2023
- Neighborhood character
- Predominantly White (83%)
- Race & ethnicity
- White 83% Hispanic / Latino 9% Two or more races 8% Asian 4% Black 2%
- Hispanic origin (detail)
- Puerto Rican 5%
- Common ancestry
- Romanian 2% Scotch-Irish 1% Slovak 1%
- Foreign-born
- 6% · Canada, China, Jamaica
- Languages at home
- 89% English-only · Spanish 5% Other Indo-European 3% Chinese 1%
Political lean MEDSL · Suffolk
- 2024 margin
- Lean R (+10.0) · D 45.0% · R 55.0%
- 2008→2024 swing
- -16.0pp toward R · 2008: 6.0pp · 2024: -10.0pp
- All cycles
- 2024: R+10.0 2020: R+0.0 2016: R+8.2 2012: D+2.9 2008: D+6.0
Not yet ingested
- Civics
- —
Market trends
- HPI YoY
- ▼ -213.58%
- Current HPI
- 304.9735
- Rent YoY
- —
- Metro
- —
- State GDP YoY
- ▲ 2.60%
- F500 in state
- 92
Industry mix (Fortune 500 HQ in NY)
| Industry | F500 HQs | Revenue |
|---|---|---|
| Financial Services | 10 | $950B |
|
||
| Consumer Goods | 9 | $162B |
|
||
| Insurance | 4 | $225B |
|
||
| Telecommunications | 2 | $144B |
|
||
| Pharmaceuticals | 2 | $112B |
|
||
| Media / Entertainment | 2 | $69B |
|
||
Price history
1 event — show timeline
- 2026-04-30 Listed $179,000 OneKey® MLS as Distributed by MLS Grid
Cash-flow waterfall
monthlySold comps — $/sqft
last 12 mo · ≤1 miLoading sold comps…