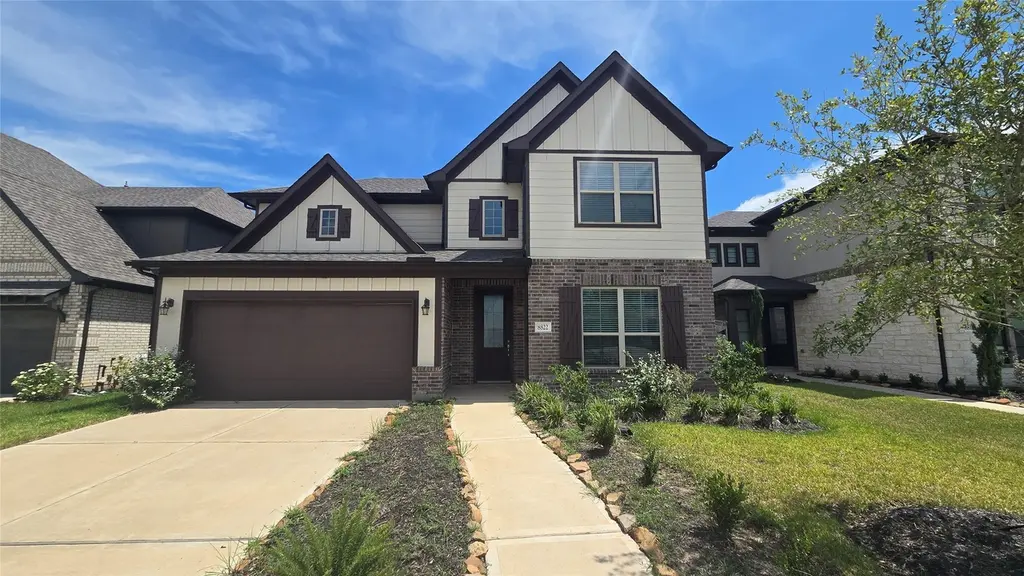
8822 Morning Glow Dr · Sienna, TX
Flood risk 4/10 · Minor
- FEMA flood zone
- X
- Chance of flooding over 30 yrs
- 0.24%
- Est. flood insurance / yr
- $507 – $1,088
Fire risk 4/10 · Minor
- Est. fire insurance / yr
- $1,222 – $2,270
Heat risk 9/10 · Severe
- Hot days now (above 111°F)
- 7 days/yr
- Hot days in 30 yrs
- 23 days/yr
Wind risk 9/10 · Severe
- Chance of severe wind over 30 yrs
- 99.0%
Air-quality risk 2/10 · Minimal
- Unhealthy air days now
- 2 days/yr
- Unhealthy air days in 30 yrs
- 2 days/yr
Risk factors via First Street. Map © Google.
Why this score? — see what drove the C- grade
The composite is a weighted blend of 9 inputs, each scored 0–100. Each bar is that input's sub-score; the figure is the points it added to the 100-point composite (weight × sub-score).
- Cash flow +12.6/30.0
- ARV discount +12.6/15.0
- 1% rule +5.4/10.0
- Schools +4.5/10.0
- Appreciation +4.2/10.0
- Condition / age +4.0/5.0
- DSCR +3.8/10.0
- Rent growth +2.5/5.0
- Livability +2.5/5.0
$459,000
🖨 Deal sheet 📄 Offer letter ✓ Due diligence
Listing remarks
Welcome home! This house is located in one the most desirable master plan community. 2 story High ceiling with open floor concept. most desirable floor plan with two bedrooms down. The gourmet kitchen is open to the dining and family room. There's a 2nd kichen behind. Tons of light and windows! Primary bedroom with double sink, tub & shower separate. Two bedroom +Game room and media room on the 2nd floor. One of bedroom has private vanity area & access to the bathroom. No backyard neighbor. Outdoor living offers cover patio, Large backyard is amazing for the kids. good FB schools. Great community with comprehensive amenities: clubhouse, parks, lake, fitness center, tennis courts
Key facts
- Private vanity area
- Large backyard
- Gourmet kitchen
Tags
Property features AI
Finance
- Other: Municipal Utility District disclosure included; Seller disclosure included
- Financial info: Lease not considered
- HOA & community: Located in Sienna community; Annual association fee of $1,250; Community pool amenity
Exterior
- Parking: Attached 2-car garage
- Security: No security details provided
- Utilities: Public water; Public sewer
- Home design: Residential property; Entry on slab foundation
- Construction: Built in 2021; Brick, cement siding and synthetic stucco exterior; Composition roof; Slab foundation
- Exterior features: Subdivision lot; Community pool
Interior
- Kitchen: Dishwasher; Disposal; Kitchen island; Walk-in pantry
- Bedrooms: Total of 9 rooms (bedroom count not explicitly listed)
- Flooring: No flooring details provided
- Bathrooms: 3 full bathrooms
- Heating & cooling: Central heating (gas); Central air conditioning (electric)
- Interior features: Double vanity in bath; Kitchen island; Primary bedroom with private bath; Walk-in pantry
- Laundry & utility: No laundry appliance details provided
Neighborhood map
What this means for you Summary
Snapshot
- This is a 4-bed/3.0-bath single-family listed at $459k. Condition is rated good.
Deal economics
- At list price, monthly cash flow is $-55 ($-656/yr) — negative.
- To cash-flow at today's rent, offer at most $449k (2.1% below list).
- Meets the 1% rule at list price ($5k rent vs $459k).
- Recommended offer: $445k (3.0% below list) — sets the bar for market timing.
- Cap rate 6.1% vs local median 3.3% in Sienna — top-decile yield for the area; either an underpriced asset or a hidden risk that comps aren't pricing in. Stress-test before assuming the spread holds.
Location & tenants
- Location reads: area grade C — affects rentability + tenant quality, not the cash-flow math above.
- Fort Bend ISD (suburban): math 44% / reading 53% proficiency, ranked #140 of 826 in TX (top 17%) — families likely to look elsewhere, expect single-tenant / working-renter base with shorter leases.
- Zoned schools: Ronald Thornton Middle (math 40% / reading 52%, grade D+, #462 of 1,662 statewide, top 28%, 1,529 students, 41% FRL).
- Market conditions: Rents soft (-0.1%/yr); 1215 active listings in the ZIP; 5 comparable units currently listed for rent nearby; rentals leasing fast (median 10d on market — plan ~1-2 weeks tenant-placement turnaround); high-income renter base; 12,093 units permitted in Fort Bend County in 2024 (815 in 5+ unit buildings).
- This rent runs 44% of the median local income ($129k/yr) — at the standard rent-burdened threshold; future hikes will face affordability resistance.
Forward outlook
- Local home prices are declining (-1.7%/yr); year-one equity from $3k of loan paydown is wiped out by about $8k of value loss. Plan a longer hold.
- Fort Bend County population projected at +75% by 2050 — long-run rental-demand tailwind backs the buy-and-hold thesis.
Negotiation context
- It's been on market 37 days — a 3% lower offer ($445k) is reasonable based on typical stale-listing flexibility.
- 9 sale attempts since 2y ago with the ask held roughly flat each time — persistent listings suggest the price (not the market) is what's stuck; bring a comps-based counter.
Risks & watch-outs
- Watch-outs: property tax is 2.9% of price.
- Climate carrying-cost: severe wind risk, 99% chance of damaging wind over 30y; extreme-heat days projected 7→23/yr by 2055 (HVAC capex compounding) — expect insurance premiums to compound above CPI over the hold.
Questions for the listing agent
- What do current leases actually rent for vs. the listed asking? Can we see a recent rent roll and the last 12 months of T-12 income?
- It's been on market 37 days. Have you received any prior offers? Is the seller open to a 3% concession, seller financing, or rate buy-down credit?
- Property tax is high relative to price — has the assessment been appealed recently, and will the sale trigger a re-assessment?
- What does the HOA fee cover, when was the last increase, and are there any pending special assessments or reserve-fund shortfalls?
- Is there a deadline driving the sale (1031 exchange, divorce, estate, relocation)? That informs how much negotiation room exists.
- What's the average days-on-market for RENTAL listings here right now (not sales)? A rising rental-DOM trend means longer vacancies and softer asking-rent achievability than the comps imply.
- What's the recent tenant-quality profile in this submarket — average credit score on applications, eviction rate, late-payment / NSF rate, and stable-employment percentage? A property-management company in the area should have these aggregated.
- How much new for-sale + rental construction is in the pipeline within 1–3 miles? Heavy new supply typically softens prices + rents 12–24 months out; constrained supply supports both.
Investment metrics
- 1% rule
- 1.04% ✓
- Cap rate
- 6.15%
- Cash-on-cash
- -0.51%
- DSCR
- 0.98
- GRM
- 8.0
CMA / ARV
- ARV (median comp)
- $517,354
- List price
- $459,000
- Delta
- -11.28%
- Verdict
- UNDERPRICED
- Comps
- 20 within 1.0 mi
Show comp detail 12 sales within ~0.75 mi
| Address | Dist | Beds/Ba | Sqft | Sold | Price | $/sf | Match |
|---|---|---|---|---|---|---|---|
| 1506 Country Air Ln | 0.14mi | 4/3.5 | 2,808 (-2%) | 4mo | $425,000 | $151 | 85 |
| 1722 Country Air Ln | 0.16mi | 4/3.0 | 2,773 (-4%) | 6mo | $419,000 | $151 | 82 |
| 1639 Rosedale Dr | 0.22mi | 4/3.0 | 2,763 (-4%) | 4mo | $399,950 | $145 | 80 |
| 1706 Country Air Ln | 0.13mi | 4/3.5 | 2,700 (-6%) | 6mo | $375,000 | $139 | 77 |
| 9507 Shaded Tree Dr | 0.50mi | 4/3.5 | 2,935 (+2%) | 4mo | $445,000 | $152 | 67 |
| 9010 Bayou Spring Ct | 0.36mi | 4/3.0 | 3,180 (+11%) | 0mo | $605,000 | $190 | 65 |
| 1403 Columbia Grove Dr | 0.42mi | 4/3.0 | 3,076 (+7%) | 7mo | $600,000 | $195 | 63 |
| 1919 Waters Branch Dr | 0.32mi | 4/3.0 | 2,591 (-10%) | 7mo | $439,990 | $170 | 63 |
| 9715 Hunters Run Dr | 0.55mi | 4/3.5 | 2,814 (-2%) | 8mo | $599,990 | $213 | 63 |
| 8726 Windsong Trail Dr | 0.31mi | 4/3.0 | 2,517 (-12%) | 5mo | $359,900 | $143 | 61 |
| 1435 Columbia Grove Dr | 0.51mi | 4/3.5 | 3,076 (+7%) | 3mo | $660,000 | $215 | 60 |
| 9710 Falling Leaf Dr | 0.52mi | 4/3.5 | 3,297 (+15%) | 2mo | $595,000 | $180 | 47 |
Match score weights: distance 35% · size 25% · config 20% · recency 20%. Top-matched comps best support the ARV.
Projected returns pro-forma
-1.67% appreciation · 0.0% rent growth · sell at horizon
- IRR
- -12.9%
- Equity multiple
- 0.49×
- Total profit
- $-65,201
- Equity at exit
- $96,266
- IRR
- -9.8%
- Equity multiple
- 0.30×
- Total profit
- $-89,601
- Equity at exit
- $89,165
Cash invested: $128,520 (down + closing). Projections, not guarantees.
Landlord ↔ Tenant lean methodology
- Overall (STATE)
- 87 Strongly Landlord-Friendly
- State Texas
- 87 Strongly Landlord-Friendly · R+5
- County
- — inherits STATE
- City
- — inherits STATE
ZIP-level market 77459
- Home prices YoY
- -0.8%
- Rents YoY
- -0.1%
- Active inventory
- 1215
- Price-to-rent
- 8.0×
Monthly cashflow live
- Estimated rent
- $4,766 high interval (Pro) →
- Mortgage (P&I)
- −$2,407
- Tax from tax record
- −$1,118 /mo · $13,415/yr
- Insurance
- −$191
- HOA
- −$104
- Vacancy / Maint / Mgmt
- −$1,001
- Net cashflow
- $-55
Break-even live
UW: 25.0% down · 7.5% · 30yr · 1.5% tax · 5.0% vac · 8.0% maint · 8.0% mgmt
Financing live
Cash to close
- Down payment
- $114,750
- Closing costs
- $13,770
- Reserves months
- —
- Total cash needed
- —
Loan-product check · same deal, 3 products live
Conventional
25% down · 7.5% · 30yr
- Down + closing
- —
- Monthly P&I
- —
- Monthly cashflow
- —
- DSCR
- —
- Eligible?
- —
Personal DTI + credit; lowest rate.
DSCR
20% down · 8.5% · 30yr
- Down + closing
- —
- Monthly P&I
- —
- Monthly cashflow
- —
- DSCR
- —
- Eligible?
- —
No personal income docs; deal must DSCR.
Hard money
10% down · 12.0% · 12mo
- Down + closing
- —
- Monthly P&I
- —
- Monthly cashflow
- —
- DSCR
- —
- Eligible?
- —
Short-term bridge; refi at stabilization.
Rent comps 5 comps
| Address | Beds | Baths | Sqft | Rent | $/sqft | DOM | Units | Dist |
|---|---|---|---|---|---|---|---|---|
| 9006 Meadow Bridge Dr Missouri City, TX | 4.0 | 3.5 | 3958 | $6,580 | $1.66 | 2d | 1 | 0.33mi |
| 8719 Fox Trail Dr Missouri City, TX | 4.0 | 3.5 | 2143 | $6,000 | $2.80 | 22d | 1 | 0.43mi |
| 1714 Forest Mist Dr Missouri City, TX | 3.0 | 3.0 | 1979 | $3,000 | $1.52 | 43d | 1 | 0.65mi |
| 2142 Ironwood Pass Dr Missouri City, TX | 4.0 | 3.0 | 2140 | $6,000 | $2.80 | 1d | 1 | 0.67mi |
| 2718 Van Gogh Ln Missouri City, TX | 4.0 | 2.5 | 3036 | $3,595 | $1.18 | 10d | 1 | 1.40mi |
HOA detail
- Monthly dues
- $104 · $1,248/yr
- Likely covers
- gym
Listing history 32 events
-
2026-06-18days on market $459,000 Active 37 DOM
-
2026-06-17days on market $459,000 Active 36 DOM
-
2026-06-16days on market $459,000 Active 35 DOM
-
2026-06-15days on market $459,000 Active 34 DOM
-
2026-06-13days on market $459,000 Active 32 DOM
-
2026-06-09days on market $459,000 Active 28 DOM
-
2026-06-08days on market $459,000 Active 27 DOM
-
2026-06-07days on market $459,000 Active 26 DOM
-
2026-06-04days on market $459,000 Active 23 DOM
-
2026-06-03days on market $459,000 Active 22 DOM
-
2026-06-02days on market $459,000 Active 21 DOM
-
2026-06-01days on market $459,000 Active 20 DOM
-
2026-05-31days on market $459,000 Active 19 DOM
-
2026-05-12$459,000 Active 813-char remark
-
2025-04-30historical
-
2024-09-02historical $3,200
-
2024-08-29$3,200
-
2024-08-15$489,000 Active
-
2024-08-07historical $3,200
-
2024-08-07historical
-
2024-07-31price $3,200
-
2024-06-23$3,400
-
2024-04-26$496,800 Active
-
2024-04-26historical
-
2024-04-14price $525,000
-
2024-03-02$548,000 Active
-
2024-02-05historical
-
2024-02-04$549,000 Active
-
2024-02-04historical
-
2024-01-22$550,000 Active
-
2024-01-11historical $3,000
-
2024-01-05$3,000
ⓘ Source: listings_history table (triggers on properties + properties_extension) + one-shot
backfill from property_details.listing_events for pre-trigger history.
Tax reassessment forecast TX · Resets to sale price
- Current annual tax
- $13,415 · $1,118/mo
- Projected year-2 tax
- $13,415 · $1,118/mo
- Expected delta
- $0/yr ($0/mo · 0.0%)
ⓘ Screening estimate from a state-policy table — verify with the county assessor before closing.
Climate risk First Street
- Flood 4/10 Moderate FEMA zone X · 24% chance over 30 yrs
- Wildfire 4/10 Moderate
- Heat 9/10 Extreme 7 d/yr ≥111°F today · 23 d/yr by 30 yrs out
- Wind 9/10 Extreme 99% chance of damaging wind over 30 yrs
- Air quality 2/10 Low 2 unhealthy d/yr today · 2 by 30 yrs out
Nearby sold comps map
Loading sold comps map…
Walkable amenities ~0.75 mi
Loading nearby amenities…
Taxation est. · year 1
- Rental income
- $57,198
- − Mortgage interest
- −$25,711
- − Property taxes
- −$13,415
- − Insurance
- −$2,295
- − Repairs & maintenance
- −$4,576
- − Management
- −$4,576
- − HOA
- −$1,248
- − Depreciation
- −$13,353
- Taxable loss
- −$7,976
- Est. tax savings @ 24.0%
- +$1,914
- After-tax cash flow
- $1,258/yr
For passive investors: Depreciation is non-cash, so a rental often shows a tax loss while cash-flowing — sheltering income. Rental losses are passive: they offset passive income freely, and up to $25,000/yr can offset ordinary (W-2) income if you actively participate and your MAGI is under $100k (phasing out to $0 by $150k); unused losses carry forward. On sale, claimed depreciation is recaptured at up to 25%, and gains may owe capital-gains tax (a 1031 exchange can defer both). Figures are a year-1 estimate at your 24.0% rate — not tax advice; consult a CPA.
Condition & rehab AI · 12 photos
This well-maintained single-family home in a desirable community offers a good condition with minimal repairs needed. It's move-in ready with potential for value-adding updates.
Value-add opportunities
- Resale Paint exterior siding — Enhances curb appeal and value
- Resale Replace carpet in bedrooms — Fresh carpet improves comfort and value
- Both Install smart home features — Enhances convenience and marketability
Renovation cost estimate screening
Value-add ROI direction
- Resale Paint exterior siding — Enhances curb appeal and value ↑
- Resale Replace carpet in bedrooms — Fresh carpet improves comfort and value ↑
- Both Install smart home features — Enhances convenience and marketability ↑
ⓘ Cost ranges are severity-bucket heuristics (US national rule-of-thumb). Get contractor quotes + a written scope before underwriting a rehab budget.
Schools (NCES district)
- District
- Fort Bend ISD
- NCES district ID
- 4819650
- Math proficiency
- 44% ▼ -15.00%
- Reading proficiency
- 53% ▼ -4.00%
- Median HH income
- $82,360
- Composite
- 44.61/100
- National rank
- #2779
- State rank
- #140 of 826 in TX
Livability — Sienna
No livability data for this city. (Only ~50 U.S. cities are tracked.)
Census & demographics
- Census place
- Sienna, TX
- County
- Fort Bend County · 836,777 people
- Metro
- Houston-The Woodlands-Sugar Land, TX
- Population (ZIP)
- 84,221
- Household income
- $129,151
- Rent vs Own
- Severe rent burden
- 1004.0
Population outlook (Fort Bend County) Hauer SSP2
- Today (2025)
- 1,004,526 people
- By 2030
- 1,153,104 · +14.8%
- By 2040
- 1,453,718 · +44.7%
- By 2050
- 1,753,781 · +74.6%
- By 2075
- 2,455,772 · +144.5%
- By 2100
- 2,930,528 · +191.7%
Race, ethnicity, and origin ACS 2023
- Neighborhood character
- Highly diverse neighborhood (Simpson 0.75)
- Race & ethnicity
- White 34% Black 26% Asian 22% Hispanic / Latino 13% Two or more races 10%
- Hispanic origin (detail)
- Mexican 7%
- Common ancestry
- Lithuanian 2% Slovak 1% Italian 1%
- Foreign-born
- 21% · Canada, China, Vietnam
- Languages at home
- 73% English-only · Other Asian/Pacific 8% Spanish 7% Other Indo-European 5%
Political lean MEDSL · Fort Bend
- 2024 margin
- Toss-up / Even · D 49.5% · R 47.9% · Other 2.6%
- 2008→2024 swing
- +4.0pp toward D · 2008: -2.4pp · 2024: 1.6pp
- All cycles
- 2024: D+1.6 2020: D+10.6 2016: D+6.6 2012: R+6.8 2008: R+2.4
Not yet ingested
- Civics
- —
Market trends
- HPI YoY
- ▼ -1.67%
- Current HPI
- 212.3573
- Rent YoY
- ▼ -0.15%
- Metro
- Houston-The Woodlands-Sugar Land, TX
- State GDP YoY
- ▲ 3.95%
- F500 in state
- 110
Industry mix (Fortune 500 HQ in TX)
| Industry | F500 HQs | Revenue |
|---|---|---|
| Energy | 16 | $1,198B |
|
||
| Technology | 5 | $198B |
|
||
| Engineering / Construction | 4 | $72B |
|
||
| Energy Services | 3 | $60B |
|
||
| Utilities | 3 | $41B |
|
||
| Healthcare | 2 | $330B |
|
||
Price history
+15200.0% since first listed19 events — show timeline
- 2026-05-12 Listed $459,000 HARMLS
- 2025-04-30 Listing Removed — HARMLS
- 2024-09-02 Rental Removed $3,200 HARMLS
- 2024-08-29 Listed for Rent $3,200 HARMLS
- 2024-08-15 Listed $489,000 HARMLS
- 2024-08-07 Rental Removed $3,200 HARMLS
- 2024-08-07 Listing Removed — HARMLS
- 2024-07-31 Price Changed $3,200 HARMLS
- 2024-06-23 Listed for Rent $3,400 HARMLS
- 2024-04-26 Listing Removed — HARMLS
- 2024-04-26 Listed $496,800 HARMLS
- 2024-04-14 Price Changed $525,000 HARMLS
- 2024-03-02 Listed $548,000 HARMLS
- 2024-02-05 Listing Removed — HARMLS
- 2024-02-04 Listing Removed — HARMLS
- 2024-02-04 Listed $549,000 HARMLS
- 2024-01-22 Listed $550,000 HARMLS
- 2024-01-11 Rental Removed $3,000 HARMLS
- 2024-01-05 Listed for Rent $3,000 HARMLS
Property tax history
+3.8%/yrLatest (2025): $13,415 · -3.4% YoY. Source: county tax records.
Cash-flow waterfall
monthlySold comps — $/sqft
last 12 mo · ≤1 miLoading sold comps…