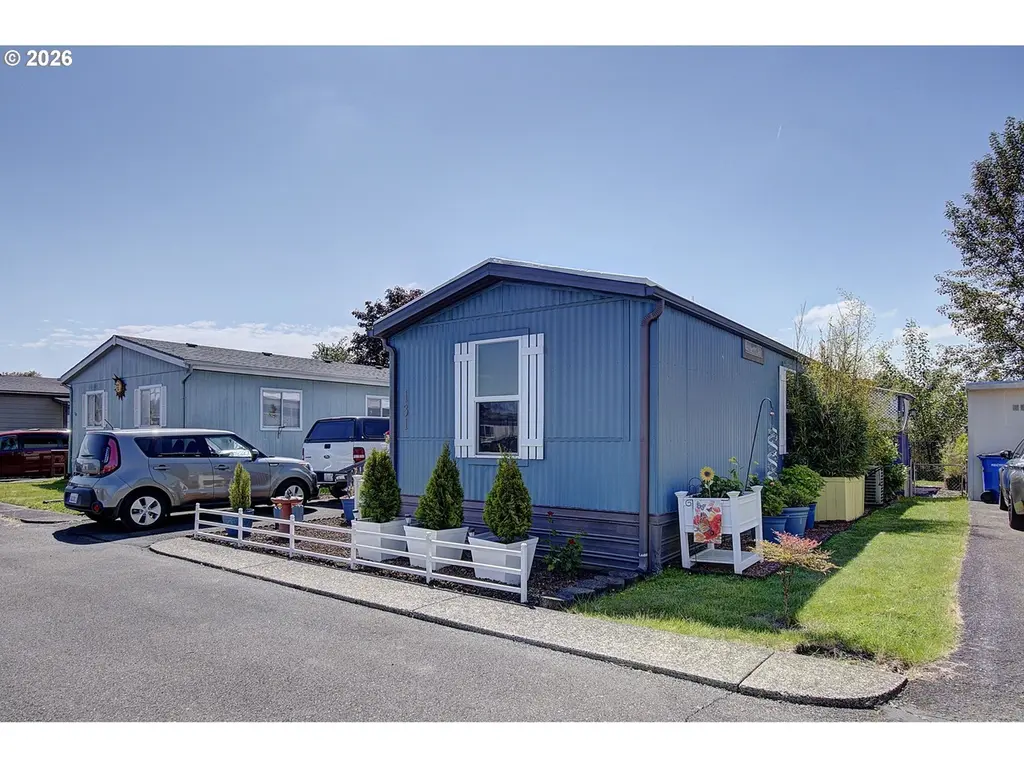
300 SW 7th Ave #131 · Battle Ground, WA
Flood risk No data
- FEMA flood zone
- —
- Chance of flooding over 30 yrs
- —
- Est. flood insurance / yr
- —
Fire risk No data
- Est. fire insurance / yr
- —
Heat risk No data
- Hot days now (above threshold)
- —
- Hot days in 30 yrs
- —
Wind risk No data
- Chance of severe wind over 30 yrs
- —
Air-quality risk No data
- Unhealthy air days now
- —
- Unhealthy air days in 30 yrs
- —
Risk factors via First Street. Map © Google.
Why this score? — see what drove the A- grade
The composite is a weighted blend of 9 inputs, each scored 0–100. Each bar is that input's sub-score; the figure is the points it added to the 100-point composite (weight × sub-score).
- Cash flow +30.0/30.0
- ARV discount +15.0/15.0
- 1% rule +10.0/10.0
- DSCR +10.0/10.0
- Schools +5.0/10.0
- Livability +4.5/5.0
- Rent growth +3.5/5.0
- Condition / age +2.5/5.0
- Appreciation +0.0/10.0
$67,500
🖨 Deal sheet (PDF) 📄 Offer letter ✓ Due diligence
Listing remarks MLS
Seller Motivated. Newer interior paint/ Newer exterior paint/ 2 bedroom, 2 bathroom/ Newer living room carpet, sub floor repaired. Great use of space. Bedrooms are at opposite ends, so privacy is great. Located at the back of the park. Storage shed included, fenced rear yard. Space rent for this unit will be $900 a month, the rest of the park expected to be $1,000
Key facts
- Heat pump cooling
- Walk-in showers
- Extra windows
Tags
Property features AI
Finance
- Other: Home warranty included
- Financial info: Land lease in effect (expires January 31, 2027); monthly lot rent; Lot rent amount specified
- HOA & community: Park amenities: commons, management, meeting room, party room, recreation facilities, road maintenance; Senior community; Pet restrictions apply
Exterior
- Parking: Carport; Driveway
- Utilities: Public water; Public sewer; Electric power; Cable internet available
- Home design: Manufactured home in park (not attached); One-level layout; Territorial view
- Construction: Metal roof; Aluminum exterior; Skirting foundation; Built in 1989
- Exterior features: Covered patio; Porch; Fenced yard; Garden with raised beds; Tool shed; Yard
Interior
- Kitchen: Dishwasher; Disposal; Microwave; Free-standing range; Free-standing refrigerator; Pantry; Quartz countertops; Laminate flooring in kitchen
- Bedrooms: Primary bedroom on main level with walk-in closet and attached bathroom; Second bedroom on main level
- Flooring: Laminate flooring; Wall-to-wall carpet
- Bathrooms: Two full bathrooms (both on the main level) with walk-in showers
- Heating & cooling: Forced air heating (95%+ efficiency); Heat pump cooling; Electric fuel source
- Interior features: Main floor living (one level) with vaulted ceilings; Accessible main floor bedroom with attached bath; Walk-in showers; Laundry area with washer/dryer included; Laundry on main level; Double pane windows with vinyl frames; Laminate and wall-to-wall carpet flooring; Pantry; Quartz surfaces
- Laundry & utility: Washer and dryer included; Laundry area on main level; Electric hot water
Neighborhood map
What this means for you Summary
Snapshot
- This is a 2-bed/1.5-bath manufactured listed at $68k.
Deal economics
- At list price, monthly cash flow is $865 ($10k/yr) — positive.
- The deal already cash-flows at list — no discount required.
- Meets the 1% rule at list price ($2k rent vs $68k).
- Cap rate 21.7% vs local median 2.8% in Battle Ground — top-decile yield for the area; either an underpriced asset or a hidden risk that comps aren't pricing in. Stress-test before assuming the spread holds.
Location & tenants
- Location reads 90/100 on livability (#3 in WA, #93 nationally) — a professional / high-income tenant draw. Strengths: crime A+, amenities A+, employment A+; Watch: cost of living D-.
- Battle Ground School District (suburban): math 48% / reading 60% proficiency, ranked #92 of 291 in WA (top 32%) — acceptable for families but not a draw, mixed tenant base, ~2y average lease.
- Zoned schools: Captain Strong (628 students, 38% FRL); Chief Umtuch Middle (553 students, 35% FRL); Open Doors Battle Ground (15 students, 33% FRL).
- Market conditions: Rents rising fast (+4.0%/yr); 467 active listings in the ZIP; 15 comparable units currently listed for rent nearby; rentals leasing fast (median 1d on market — plan ~1-2 weeks tenant-placement turnaround); high-income renter base; 3,547 units permitted in Clark County in 2024 (1,361 in 5+ unit buildings).
- This rent is only 17% of the median local income ($112k/yr) — well below the 30% rent-burden line; pricing power to push rent on renewal without tenant pushback.
Forward outlook
- Local home prices are declining (-3.0%/yr); year-one equity from $467 of loan paydown is wiped out by about $2k of value loss. Plan a longer hold.
- Clark County population projected at +29% by 2050 — long-run rental-demand tailwind backs the buy-and-hold thesis.
- At projected returns (-3.0% appreciation + 4.0% rent growth), your $19k cash investment doubles in ~3 years — after that, you're playing with house money.
Negotiation context
- Only 9 days on market — expect competitive offers; lowballing is unlikely to land.
- 2 sale attempts since 3y ago with the ask held roughly flat each time — persistent listings suggest the price (not the market) is what's stuck; bring a comps-based counter.
- Current owner paid $48k; 42% above their basis — modest negotiation headroom, anchor on the comps not their cost.
Questions for the listing agent
- Is there a deadline driving the sale (1031 exchange, divorce, estate, relocation)? That informs how much negotiation room exists.
- Schools are B-rated — typically a magnet for longer-tenancy family renters. What's the average tenant stay here, and is there a school-zone premium baked into asking?
- What's the average days-on-market for RENTAL listings here right now (not sales)? A rising rental-DOM trend means longer vacancies and softer asking-rent achievability than the comps imply.
- What's the recent tenant-quality profile in this submarket — average credit score on applications, eviction rate, late-payment / NSF rate, and stable-employment percentage? A property-management company in the area should have these aggregated.
- How much new for-sale + rental construction is in the pipeline within 1–3 miles? Heavy new supply typically softens prices + rents 12–24 months out; constrained supply supports both.
Investment metrics
- 1% rule
- 2.36% ✓
- Cap rate
- 21.67%
- Cash-on-cash
- 54.91%
- DSCR
- 3.44
- GRM
- 3.5
CMA / ARV
- ARV (on-the-fly)
- $84,084
- Comps found
- 8
Show comp detail 8 sales within ~0.75 mi
| Address | Dist | Beds/Ba | Sqft | Sold | Price | $/sf | Match |
|---|---|---|---|---|---|---|---|
| 300 SW 7th Ave #810 | 0.00mi | 2/2.0 | 960 (+4%) | 1mo | $138,900 | $145 | 90 |
| 300 SW 7th Ave #112 | 0.00mi | 2/2.0 | 932 (+1%) | 9mo | $138,000 | $148 | 89 |
| 300 SW 7th Ave #1011 | 0.00mi | 2/2.0 | 924 (0%) | 13mo | $80,000 | $87 | 87 |
| 300 SW 7th Ave #801 | 0.00mi | 2/2.0 | 933 (+1%) | 12mo | $45,000 | $48 | 87 |
| 300 SW 7th Ave #301 | 0.00mi | 2/2.0 | 945 (+2%) | 13mo | $169,900 | $180 | 83 |
| 300 SW 7th Ave #1010 | 0.00mi | 3/1.0 (+1) | 924 (0%) | 14mo | $45,000 | $49 | 81 |
| 300 SW 7th Ave #302 | 0.00mi | 2/2.0 | 1,057 (+14%) | 5mo | $66,000 | $62 | 70 |
| 300 SW 7th Ave #707 | 0.00mi | 2/2.0 | 1,056 (+14%) | 10mo | $95,700 | $91 | 65 |
Match score weights: distance 35% · size 25% · config 20% · recency 20%. Top-matched comps best support the ARV.
Projected returns pro-forma
-3.0% appreciation · 4.0% rent growth · sell at horizon
- IRR
- 54.2%
- Equity multiple
- 3.42×
- Total profit
- $45,746
- Equity at exit
- $10,064
- IRR
- 59.7%
- Equity multiple
- 7.22×
- Total profit
- $117,467
- Equity at exit
- $5,836
Cash invested: $18,900 (down + closing). Projections, not guarantees.
Landlord ↔ Tenant lean methodology
- Overall (STATE)
- 28 Tenant-Leaning
- State Washington
- 28 Tenant-Leaning · D+8
- County
- — inherits STATE
- City
- — inherits STATE
ZIP-level market 98604
- Rents YoY
- 4.0%
- Active inventory
- 467
- Price-to-rent
- 3.5×
Monthly cashflow live
- Estimated rent
- $1,594 high interval (Pro) →
- Mortgage (P&I)
- −$354
- Tax from tax record
- −$12 /mo · $149/yr
- Insurance
- −$28
- HOA
- −$0
- Vacancy / Maint / Mgmt
- −$335
- Net cashflow
- $865
Break-even live
Sensitivity live
| Price | -10% $903 | -5% $884 | +0% $865 | +5% $846 | +10% $827 |
|---|---|---|---|---|---|
| Rent | -10% $739 | -5% $802 | +0% $865 | +5% $928 | +10% $991 |
| Rate | -1.0pp $899 | -0.5pp $882 | base $865 | +0.5pp $847 | +1.0pp $830 |
UW: 25.0% down · 7.5% · 30yr · 1.5% tax · 5.0% vac · 8.0% maint · 8.0% mgmt
Financing live
Cash to close
- Down payment
- $16,875
- Closing costs
- $2,025
- Reserves months
- —
- Total cash needed
- —
Loan-product check · same deal, 3 products live
Conventional
25% down · 7.5% · 30yr
- Down + closing
- —
- Monthly P&I
- —
- Monthly cashflow
- —
- DSCR
- —
- Eligible?
- —
Personal DTI + credit; lowest rate.
DSCR
20% down · 8.5% · 30yr
- Down + closing
- —
- Monthly P&I
- —
- Monthly cashflow
- —
- DSCR
- —
- Eligible?
- —
No personal income docs; deal must DSCR.
Hard money
10% down · 12.0% · 12mo
- Down + closing
- —
- Monthly P&I
- —
- Monthly cashflow
- —
- DSCR
- —
- Eligible?
- —
Short-term bridge; refi at stabilization.
Rent comps 15 comps
| Address | Beds | Baths | Sqft | Rent | $/sqft | DOM | Units | Dist |
|---|---|---|---|---|---|---|---|---|
| 405 SW 1st St Unit M Battle Ground, WA | 2.0 | 1.0 | 900 | $1,195 | $1.33 | 25d | 1 | 0.17mi |
| 218 SW 15th Ave Unit D-114 Battle Ground, WA | 1.0 | 1.0 | 747 | $1,350 | $1.81 | 19d | 1 | 0.46mi |
| 101 NE 1st Ave Battle Ground, WA | 1.0 | 1.0 | 782 | $1,520 | $1.94 | 0d | 4 | 0.51mi |
| 10 SE 13th St Unit 201 Battle Ground, WA | 1.0 | 1.0 | 700 | $1,395 | $1.99 | 45d | 1 | 0.56mi |
| 518 NW 12th Ave Battle Ground, WA | 1.0 | 1.0 | 738 | $1,162 | $1.57 | 0d | 1 | 0.59mi |
| 218 SE Clark Ave Apt 2 Battle Ground, WA | 2.0 | 1.0 | 725 | $1,395 | $1.92 | 45d | 1 | 0.66mi |
| 415 SW 20th Ave Battle Ground, WA | 1.0–2.0 | 1.0 | 888 | $1,650 | $1.86 | 0d | 4 | 0.68mi |
| 1511 SW 13th Ave Battle Ground, WA | 1.0–3.0 | 1.0–2.0 | 882 | $1,772 | $2.01 | 0d | 9 | 0.70mi |
| 419 SE Clark Ave Battle Ground, WA | 2.0 | 1.0 | 875 | $1,575 | $1.80 | 0d | 1 | 0.72mi |
| 117 NE Clark Ave Battle Ground, WA | 1.0–2.0 | 1.0 | 603 | $1,548 | $2.57 | 0d | 4 | 0.74mi |
| 808 SE 4th St Unit 02 Battle Ground, WA | 3.0 | 1.5 | 1107 | $1,750 | $1.58 | 14d | 1 | 0.76mi |
| 808 SE 4th St Unit 02 Battle Ground, WA | 3.0 | 1.5 | 1107 | $1,750 | $1.58 | 16d | 1 | 0.76mi |
| 611 NW 20th Ave Battle Ground, WA | 1.0–2.0 | 1.0 | 824 | $1,607 | $1.95 | 0d | 3 | 0.84mi |
| 318 Southwest Ave Battleground, WA | 1.0 | 1.0 | 747 | $1,350 | $1.81 | 0d | 1 | 1.06mi |
| 917 SW 31st St Battle Ground, WA | 1.0–2.0 | 1.0–2.0 | 913 | $2,336 | $2.56 | 0d | 12 | 1.48mi |
Listing history 7 events
-
2026-06-21days on market $67,500 Active 9 DOM
-
2026-06-19status $67,500 Active 6 DOM
-
2026-06-08status $67,500 Pending 6 DOM
-
2026-06-07days on market $67,500 Active 6 DOM
-
2026-06-03days on market $67,500 Active 2 DOM
-
2026-06-02remarks 699-char remark
-
2026-06-02$67,500 Active 1 DOM
ⓘ Source: listings_history table (triggers on properties + properties_extension) + one-shot
backfill from property_details.listing_events for pre-trigger history.
Tax reassessment forecast WA · Resets to sale price
- Current annual tax
- $149 · $12/mo
- Projected year-2 tax
- $662 · $55/mo
- Expected delta
- +$513/yr (+$43/mo · 344.2%)
ⓘ Screening estimate from a state-policy table — verify with the county assessor before closing.
Nearby sold comps map
Loading sold comps map…
Walkable amenities ~0.75 mi
Loading nearby amenities…
Taxation est. · year 1
- Rental income
- $19,130
- − Mortgage interest
- −$3,781
- − Property taxes
- −$149
- − Insurance
- −$338
- − Repairs & maintenance
- −$1,530
- − Management
- −$1,530
- − Depreciation
- −$1,964
- Taxable income
- $9,838
- Est. tax owed @ 24.0%
- −$2,361
- After-tax cash flow
- $8,017/yr
For passive investors: Depreciation is non-cash, so a rental often shows a tax loss while cash-flowing — sheltering income. Rental losses are passive: they offset passive income freely, and up to $25,000/yr can offset ordinary (W-2) income if you actively participate and your MAGI is under $100k (phasing out to $0 by $150k); unused losses carry forward. On sale, claimed depreciation is recaptured at up to 25%, and gains may owe capital-gains tax (a 1031 exchange can defer both). Figures are a year-1 estimate at your 24.0% rate — not tax advice; consult a CPA.
Schools (NCES district)
- District
- Battle Ground School District
- NCES district ID
- 5300380
- Math proficiency
- 48% ▼ -1.00%
- Reading proficiency
- 60% ▼ -1.00%
- Median HH income
- $69,646
- Composite
- 49.81/100
- National rank
- #4201
- State rank
- #92 of 291 in WA
Livability — Battle Ground
- Score
- 90/100
- State rank
- #3
- US rank
- #93
Category grades
Schools grade is shown separately in the Schools card above.
Census & demographics
- Census place
- Battle Ground, WA
- County
- Clark County · 513,189 people
- City population
- 38,839
- Metro
- Portland-Vancouver-Hillsboro, OR-WA
- Population (ZIP)
- 38,839
- Household income
- $112,448
- Rent vs Own
- Severe rent burden
- 485.0
Population outlook (Clark County) Hauer SSP2
- Today (2025)
- 529,610 people
- By 2030
- 563,242 · +6.4%
- By 2040
- 625,905 · +18.2%
- By 2050
- 681,558 · +28.7%
- By 2075
- 805,967 · +52.2%
- By 2100
- 877,450 · +65.7%
Race, ethnicity, and origin ACS 2023
- Neighborhood character
- Predominantly White (87%)
- Race & ethnicity
- White 87% Two or more races 7% Hispanic / Latino 6% Asian 1%
- Hispanic origin (detail)
- Mexican 4%
- Common ancestry
- Italian 4% Portuguese 4% Subsaharan African 4%
- Foreign-born
- 7% · Canada
- Languages at home
- 90% English-only · Russian/Polish/Slavic 6% Spanish 3%
Political lean MEDSL · Clark
- 2024 margin
- Lean D (+7.0) · D 52.1% · R 45.1% · Other 2.8%
- 2008→2024 swing
- +0.9pp no change · 2008: 6.1pp · 2024: 7.0pp
- All cycles
- 2024: D+7.0 2020: D+5.1 2016: D+0.1 2012: D+0.1 2008: D+6.1
Not yet ingested
- Civics
- —
Market trends
- HPI YoY
- ▼ -296.15%
- Current HPI
- 298.5364
- Rent YoY
- ▲ 4.00%
- Metro
- Portland-Vancouver-Hillsboro, OR-WA
- State GDP YoY
- ▲ 4.65%
- F500 in state
- 22
Industry mix (Fortune 500 HQ in WA)
| Industry | F500 HQs | Revenue |
|---|---|---|
| Retail | 2 | $269B |
|
||
| Technology / Retail | 1 | $638B |
|
||
| Technology | 1 | $245B |
|
||
| Telecommunications | 1 | $38B |
|
||
| Food / Beverage | 1 | $36B |
|
||
| Automotive / Trucks | 1 | $34B |
|
||
Price history
+12.7% since first listed5 events — show timeline
- 2026-06-01 Listed $67,500 RMLS
- 2023-02-28 Sold (MLS) $47,500 RMLS
- 2023-02-13 Pending — RMLS
- 2023-01-18 Price Changed $55,000 RMLS
- 2023-01-05 Listed $59,900 RMLS
Property tax history
+79.4%/yrLatest (2026): $149 · -11.4% YoY. Source: county tax records.
Cash-flow waterfall
monthlySold comps — $/sqft
last 12 mo · ≤1 miLoading sold comps…