 🏷️ Likely Rental
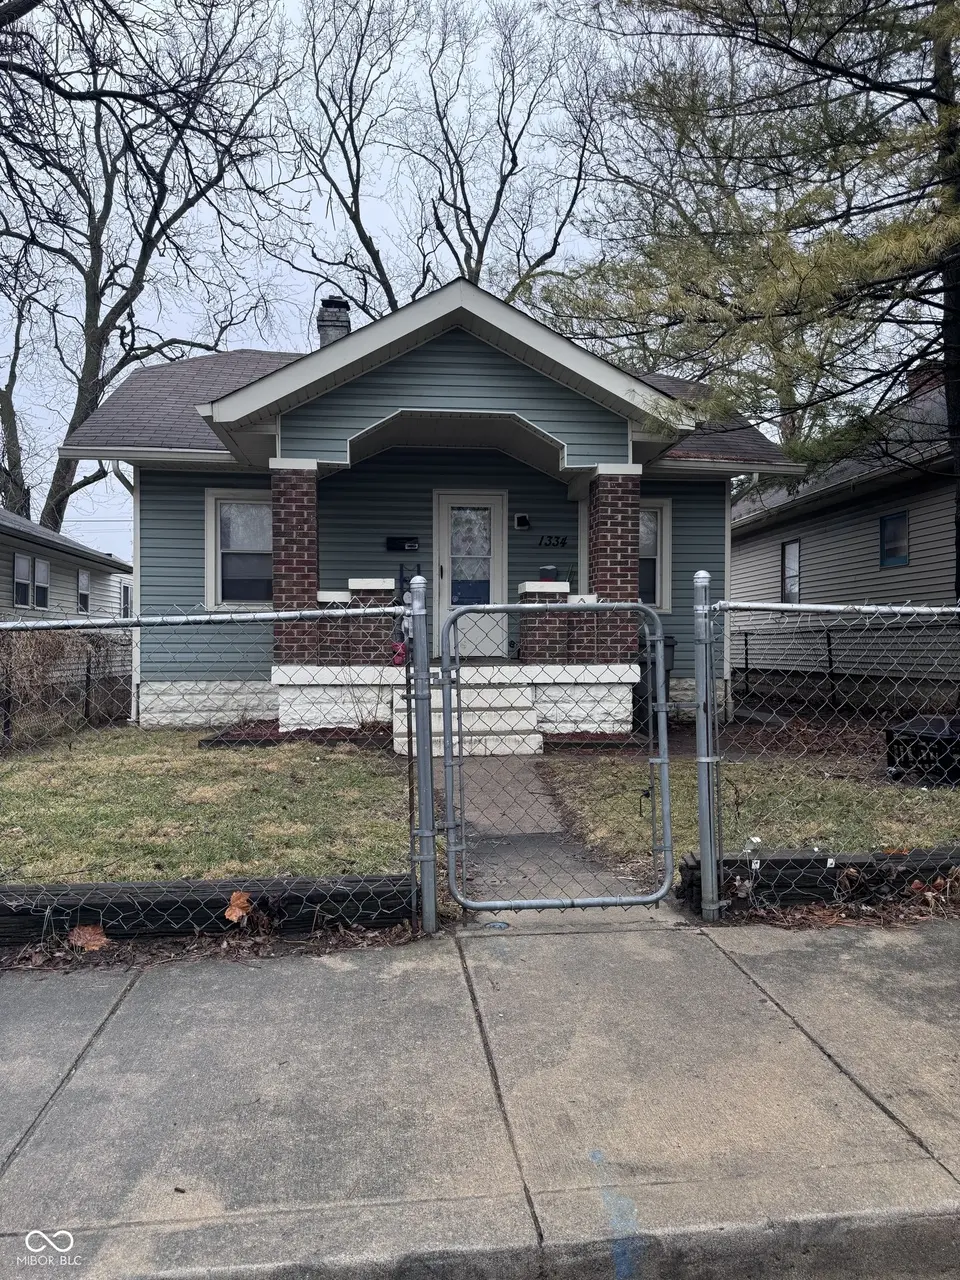
1334 Calhoun St · Indianapolis city (balance), IN
Flood risk 4/10 · Minor
- FEMA flood zone
- X (unshaded)
- Chance of flooding over 30 yrs
- 0.22%
- Est. flood insurance / yr
- $473 – $860
Fire risk 1/10 · Minimal
- Est. fire insurance / yr
- $717 – $1,331
Heat risk 4/10 · Minor
- Hot days now (above 101°F)
- 7 days/yr
- Hot days in 30 yrs
- 19 days/yr
Wind risk 2/10 · Minimal
- Chance of severe wind over 30 yrs
- —
Air-quality risk 3/10 · Minor
- Unhealthy air days now
- 2 days/yr
- Unhealthy air days in 30 yrs
- 3 days/yr
Risk factors via First Street. Map © Google.
Why this score? — see what drove the C- grade
The composite is a weighted blend of 9 inputs, each scored 0–100. Each bar is that input's sub-score; the figure is the points it added to the 100-point composite (weight × sub-score).
- Cash flow +17.1/30.0
- ARV discount +15.0/15.0
- 1% rule +5.3/10.0
- DSCR +5.3/10.0
- Rent growth +3.2/5.0
- Livability +2.5/5.0
- Condition / age +2.5/5.0
- Schools +1.4/10.0
- Appreciation +0.0/10.0
$118,000
🖨 Deal sheet (PDF) 📄 Offer letter ✓ Due diligence
Listing remarks MLS
RENTED FOR $1,150/MONTH, this property offers an investor instant cash flow on day one. This 2-bed/1-bath home features a detached garage - a rare find at this price point - with easy I-65 access putting downtown Indianapolis just minutes away. Lease runs through July 2026.
Key facts
- 3,790 sq ft lot
- Garage
- Built 1900
Neighborhood map
What this means for you Summary
Snapshot
- This is a 2-bed/1.0-bath single-family listed at $118k.
Deal economics
- At list price, monthly cash flow is $81 ($973/yr) — positive.
- The deal already cash-flows at list — no discount required.
- Meets the 1% rule at list price ($1k rent vs $118k).
- Recommended offer: $104k (12.0% below list) — sets the bar for market timing.
- Cap rate 7.1% vs local median 4.4% in Indianapolis city (balance) — top-decile yield for the area; either an underpriced asset or a hidden risk that comps aren't pricing in. Stress-test before assuming the spread holds.
Location & tenants
- Location reads: area grade C — affects rentability + tenant quality, not the cash-flow math above.
- Indianapolis Public Schools (urban): math 14% / reading 20% proficiency, ranked #286 of 301 in IN (top 95%) — low school quality limits family demand, transient renter base, plan for 1-2y turnover; 77% free/reduced lunch — lower-income household profile, screen leases tightly.
- Zoned schools: Frederick Douglass School 19 (math 9% / reading 13%, grade F, #909 of 994 statewide, top 92%, 444 students, 81% FRL); H L Harshman Middle School (math 3% / reading 16%, grade F, #316 of 330 statewide, top 96%, 549 students, 84% FRL).
- Market conditions: Rents rising (+2.9%/yr); 500 active listings in the ZIP; 40 comparable units currently listed for rent nearby; rentals at typical pace (median 25d on market — plan ~3-4 weeks tenant-placement turnaround); 1,906 units permitted in Marion County in 2024 (621 in 5+ unit buildings).
Forward outlook
- Local home prices are declining (-3.0%/yr); year-one equity from $816 of loan paydown is wiped out by about $4k of value loss. Plan a longer hold.
- Marion County population projected at +18% by 2050 — long-run rental-demand tailwind backs the buy-and-hold thesis.
Negotiation context
- It's been on market 124 days — a 12% lower offer ($104k) is reasonable based on typical stale-listing flexibility.
- 7 sale attempts since 25y ago with the ask held roughly flat each time — persistent listings suggest the price (not the market) is what's stuck; bring a comps-based counter.
- Current owner paid $60k; list at $118k implies a 97% gain — meaningful room to come down on a strong offer.
Risks & watch-outs
- Watch-outs: built in 1900 — expect roof / HVAC / electrical / plumbing capex.
Questions for the listing agent
- It's been on market 124 days. Have you received any prior offers? Is the seller open to a 12% concession, seller financing, or rate buy-down credit?
- Built in 1900 — when were the roof, HVAC, electrical panel, plumbing, and water heater last replaced?
- Why hasn't it sold? Are there any deal-killer items the seller is aware of (foundation, flood, title, zoning, code violations)?
- Is there a deadline driving the sale (1031 exchange, divorce, estate, relocation)? That informs how much negotiation room exists.
- What's the average days-on-market for RENTAL listings here right now (not sales)? A rising rental-DOM trend means longer vacancies and softer asking-rent achievability than the comps imply.
- What's the recent tenant-quality profile in this submarket — average credit score on applications, eviction rate, late-payment / NSF rate, and stable-employment percentage? A property-management company in the area should have these aggregated.
- How much new for-sale + rental construction is in the pipeline within 1–3 miles? Heavy new supply typically softens prices + rents 12–24 months out; constrained supply supports both.
Investment metrics
- 1% rule
- 1.03% ✓
- Cap rate
- 7.12%
- Cash-on-cash
- 2.95%
- DSCR
- 1.13
- GRM
- 8.1
CMA / ARV
- ARV (median comp)
- $178,191
- List price
- $118,000
- Delta
- -33.78%
- Verdict
- UNDERPRICED
- Comps
- 20 within 1.0 mi
Show comp detail 12 sales within ~0.75 mi
| Address | Dist | Beds/Ba | Sqft | Sold | Price | $/sf | Match |
|---|---|---|---|---|---|---|---|
| 1637 Hoefgen St | 0.64mi | 2/1.0 | 780 (-1%) | 4mo | $90,000 | $115 | 66 |
| 1418 Finley Ave | 0.50mi | 2/1.0 | 844 (+7%) | 2mo | $55,000 | $65 | 63 |
| 1730 S State Ave | 0.36mi | 2/1.0 | 704 (-10%) | 4mo | $139,999 | $199 | 63 |
| 1805 Orleans St | 0.63mi | 2/1.0 | 781 (-1%) | 8mo | $78,000 | $100 | 62 |
| 1610 Ringgold Ave | 0.53mi | 2/1.0 | 850 (+8%) | 1mo | $164,000 | $193 | 61 |
| 1602 Harlan St | 0.65mi | 2/1.0 | 808 (+3%) | 7mo | $130,000 | $161 | 59 |
| 1431 Finley Ave | 0.53mi | 2/1.0 | 858 (+9%) | 3mo | $75,000 | $87 | 58 |
| 2005 Reformers Ave | 0.53mi | 3/1.0 (+1) | 816 (+4%) | 9mo | $154,900 | $190 | 57 |
| 2062 Calhoun St | 0.63mi | 2/1.0 | 720 (-8%) | 2mo | $149,900 | $208 | 54 |
| 2237 Villa Ave | 0.63mi | 3/1.0 (+1) | 846 (+8%) | 1mo | $175,000 | $207 | 52 |
| 1606 Asbury St | 0.49mi | 3/1.0 (+1) | 892 (+14%) | 4mo | $145,000 | $163 | 46 |
| 2029 Reformers Ave | 0.57mi | 3/1.0 (+1) | 875 (+11%) | 6mo | $95,000 | $109 | 44 |
Match score weights: distance 35% · size 25% · config 20% · recency 20%. Top-matched comps best support the ARV.
Projected returns pro-forma
-3.0% appreciation · 2.88% rent growth · sell at horizon
- IRR
- -11.7%
- Equity multiple
- 0.57×
- Total profit
- $-14,043
- Equity at exit
- $17,594
- IRR
- -2.7%
- Equity multiple
- 0.82×
- Total profit
- $-5,936
- Equity at exit
- $10,202
Cash invested: $33,040 (down + closing). Projections, not guarantees.
Landlord ↔ Tenant lean methodology
- Overall (STATE)
- 90 Strongly Landlord-Friendly
- State Indiana
- 90 Strongly Landlord-Friendly · R+11
- County
- — inherits STATE
- City
- — inherits STATE
ZIP-level market 46203
- Home prices YoY
- -26.7%
- Rents YoY
- 2.9%
- Active inventory
- 500
- Price-to-rent
- 8.1×
Monthly cashflow live
- Estimated rent
- $1,221 high interval (Pro) →
- Mortgage (P&I)
- −$619
- Tax from tax record
- −$215 /mo · $2,582/yr
- Insurance
- −$49
- HOA
- −$0
- Vacancy / Maint / Mgmt
- −$256
- Net cashflow
- $81
Break-even live
Sensitivity live
| Price | -10% $148 | -5% $114 | +0% $81 | +5% $48 | +10% $14 |
|---|---|---|---|---|---|
| Rent | -10% $-15 | -5% $33 | +0% $81 | +5% $129 | +10% $178 |
| Rate | -1.0pp $141 | -0.5pp $111 | base $81 | +0.5pp $51 | +1.0pp $19 |
UW: 25.0% down · 7.5% · 30yr · 1.5% tax · 5.0% vac · 8.0% maint · 8.0% mgmt
Financing live
Cash to close
- Down payment
- $29,500
- Closing costs
- $3,540
- Reserves months
- —
- Total cash needed
- —
Loan-product check · same deal, 3 products live
Conventional
25% down · 7.5% · 30yr
- Down + closing
- —
- Monthly P&I
- —
- Monthly cashflow
- —
- DSCR
- —
- Eligible?
- —
Personal DTI + credit; lowest rate.
DSCR
20% down · 8.5% · 30yr
- Down + closing
- —
- Monthly P&I
- —
- Monthly cashflow
- —
- DSCR
- —
- Eligible?
- —
No personal income docs; deal must DSCR.
Hard money
10% down · 12.0% · 12mo
- Down + closing
- —
- Monthly P&I
- —
- Monthly cashflow
- —
- DSCR
- —
- Eligible?
- —
Short-term bridge; refi at stabilization.
Rent comps 40 comps
| Address | Beds | Baths | Sqft | Rent | $/sqft | DOM | Units | Dist |
|---|---|---|---|---|---|---|---|---|
| 1117 E Naomi St Indianapolis, IN | 2.0 | 1.5 | 976 | $1,450 | $1.49 | 0d | 1 | 0.19mi |
| 1409 E Tabor St Indianapolis, IN | 1.0 | 1.0 | 528 | $775 | $1.47 | 25d | 1 | 0.30mi |
| 2103 Ringgold Ave Indianapolis, IN | 1.0 | 1.0 | 1090 | $775 | $0.71 | 15d | 1 | 0.36mi |
| 1604 E Kelly St Indianapolis, IN | 2.0 | 1.0 | 800 | $1,025 | $1.28 | 12d | 1 | 0.38mi |
| 1604 E Kelly St Indianapolis, IN | 2.0 | 1.0 | 750 | $1,025 | $1.37 | 19d | 1 | 0.38mi |
| 1011 E Raymond St Indianapolis, IN | 2.0 | 2.0 | 1100 | $1,350 | $1.23 | 25d | 1 | 0.40mi |
| 1706 E Tabor St Unit 1708 Indianapolis, IN | 3.0 | 1.0 | 1000 | $1,300 | $1.30 | 9d | 1 | 0.42mi |
| 1637 S State Ave Indianapolis, IN | 2.0 | 1.5 | 816 | $900 | $1.10 | 19d | 1 | 0.43mi |
| 1620 E Palmer St Indianapolis, IN | 2.0 | 1.0 | 824 | $1,200 | $1.46 | 25d | 1 | 0.44mi |
| 1815 Dawson St Unit 1815 Indianapolis, IN | 2.0 | 1.0 | 1019 | $999 | $0.98 | 16d | 1 | 0.45mi |
| 1640 Asbury St Indianapolis, IN | 1.0 | 1.0 | 700 | $850 | $1.21 | 45d | 1 | 0.45mi |
| 1543 S State Ave Indianapolis, IN | 2.0 | 1.0 | 1086 | $1,100 | $1.01 | 9d | 1 | 0.47mi |
| 944 E Minnesota St Indianapolis, IN | 2.0 | 2.0 | 944 | $1,299 | $1.38 | 45d | 1 | 0.47mi |
| 823 Iowa St Indianapolis, IN | 2.0 | 1.0 | 812 | $1,100 | $1.35 | 0d | 1 | 0.51mi |
| 823 Iowa St Indianapolis, IN | 2.0 | 1.0 | 812 | $1,100 | $1.35 | 45d | 1 | 0.51mi |
| 1727 S Randolph St Indianapolis, IN | 1.0 | 1.0 | 616 | $950 | $1.54 | 45d | 1 | 0.53mi |
| 1534 Dawson St Indianapolis, IN | 3.0 | 1.0 | 1040 | $1,499 | $1.44 | 25d | 1 | 0.56mi |
| 1514 Ringgold Ave Indianapolis, IN | 3.0 | 1.0 | 1064 | $1,295 | $1.22 | 45d | 1 | 0.57mi |
| 1861 Orleans St Indianapolis, IN | 1.0 | 1.0 | 552 | $2,500 | $4.53 | 25d | 1 | 0.58mi |
| 2036 Calhoun St Indianapolis, IN | 2.0 | 1.0 | 880 | $1,200 | $1.36 | 9d | 1 | 0.60mi |
| 1503 Dawson St Indianapolis, IN | 2.0 | 1.0 | 700 | $1,200 | $1.71 | 45d | 1 | 0.61mi |
| 620 E Beecher St Indianapolis, IN | 3.0 | 2.0 | 1072 | $1,639 | $1.53 | 21d | 1 | 0.62mi |
| 1026 Laurel St Indianapolis, IN | 1.0 | 1.0 | 655 | $860 | $1.31 | 45d | 1 | 0.63mi |
| 1318 Shelby St Unit B 120% AMI Indianapolis, IN | 1.0 | 1.0 | 1116 | $1,350 | $1.21 | 25d | 1 | 0.64mi |
| 1026 Orange St Indianapolis, IN | 2.0 | 2.0 | 1007 | $1,600 | $1.59 | 18d | 1 | 0.64mi |
| 1024 Orange St Indianapolis, IN | 2.0 | 2.0 | 1007 | $1,650 | $1.64 | 45d | 1 | 0.64mi |
| 2525 Shelby St Unit 4 Indianapolis, IN | 1.0 | 1.0 | 600 | $775 | $1.29 | 25d | 1 | 0.67mi |
| 2525 Shelby St Unit 4 Indianapolis, IN | 1.0 | 1.0 | 600 | $775 | $1.29 | 0d | 1 | 0.67mi |
| 1637 Hoefgen St Indianapolis, IN | 2.0 | 1.0 | 780 | $1,000 | $1.28 | 45d | 1 | 0.67mi |
| 2525 Shelby St Unit 1 Indianapolis, IN | 1.0 | 1.0 | 600 | $865 | $1.44 | 4d | 1 | 0.67mi |
| 2469 Dawson St Indianapolis, IN | 2.0 | 1.0 | 700 | $949 | $1.36 | 5d | 4 | 0.73mi |
| 512 E Minnesota St Unit 203 Indianapolis, IN | 2.0 | 1.0 | 903 | $1,195 | $1.32 | 25d | 1 | 0.74mi |
| 2555 Shelby St Unit 2559 Indianapolis, IN | 1.0 | 1.0 | 717 | $1,250 | $1.74 | 45d | 1 | 0.75mi |
| 1337 Prospect St Unit 3 Indianapolis, IN | 1.0 | 2.0 | 1100 | $1,450 | $1.32 | 45d | 1 | 0.77mi |
| 1441 Prospect St Indianapolis, IN | 2.0 | 1.0–2.0 | 2840 | $1,972 | $0.69 | 0d | 14 | 0.77mi |
| 1224 Prospect St Indianapolis, IN | 2.0 | 1.0–2.0 | 691 | $2,223 | $3.21 | 0d | 8 | 0.81mi |
| 1437 S East St Indianapolis, IN | 2.0 | 2.0 | 1114 | $1,425 | $1.28 | 45d | 1 | 0.82mi |
| 1439 South East St Indianapolis, IN | 2.0 | 2.0 | 1114 | $1,425 | $1.28 | 0d | 1 | 0.82mi |
| 1439 South East St Indianapolis, IN | 2.0 | 2.0 | 1114 | $1,425 | $1.28 | 22d | 1 | 0.82mi |
| 1012 Prospect St Unit 907 Prospect NO AMI Indianapolis, IN | 3.0 | 1.5 | 1121 | $1,400 | $1.25 | 45d | 1 | 0.83mi |
Listing history 32 events
-
2026-06-21days on market $118,000 Active 124 DOM
-
2026-06-18days on market $118,000 Active 121 DOM
-
2026-06-17days on market $118,000 Active 120 DOM
-
2026-06-16days on market $118,000 Active 119 DOM
-
2026-06-15days on market $118,000 Active 118 DOM
-
2026-06-13days on market $118,000 Active 116 DOM
-
2026-06-13days on market $118,000 Active 115 DOM
-
2026-06-09days on market $118,000 Active 112 DOM
-
2026-06-08days on market $118,000 Active 111 DOM
-
2026-06-07days on market $118,000 Active 110 DOM
-
2026-06-03days on market $118,000 Active 106 DOM
-
2026-06-02days on market $118,000 Active 105 DOM
-
2026-06-01days on market $118,000 Active 104 DOM
-
2026-05-31days on market $118,000 Active 103 DOM
-
2026-04-03price $118,000 274-char remark
Show marketing remark (274 chars)
RENTED FOR $1,150/MONTH, this property offers an investor instant cash flow on day one. This 2-bed/1-bath home features a detached garage - a rare find at this price point - with easy I-65 access putting downtown Indianapolis just minutes away. Lease runs through July 2026.
-
2026-03-19price $120,000 274-char remark
Show marketing remark (274 chars)
RENTED FOR $1,150/MONTH, this property offers an investor instant cash flow on day one. This 2-bed/1-bath home features a detached garage - a rare find at this price point - with easy I-65 access putting downtown Indianapolis just minutes away. Lease runs through July 2026.
-
2026-02-17$122,500 Active 274-char remark
Show marketing remark (274 chars)
RENTED FOR $1,150/MONTH, this property offers an investor instant cash flow on day one. This 2-bed/1-bath home features a detached garage - a rare find at this price point - with easy I-65 access putting downtown Indianapolis just minutes away. Lease runs through July 2026.
-
2022-02-07price $1,095
-
2021-07-05soldstatus $59,900 Closed 385-char remark
Show marketing remark (385 chars)
3 Bedroom home with detached garage is great investment! Home in need of maintenance and updates. Tub surround and kitchen faucet replaced in 2020. Living room, dining room, master and kitchen on main level. 2 bedrooms up. Unfinished basement includes laundry area. Tenants rights apply. Long time tenant willing to stay. Do NOT show up at property without a scheduled appointment.
-
2021-06-19status Pending 385-char remark
Show marketing remark (385 chars)
3 Bedroom home with detached garage is great investment! Home in need of maintenance and updates. Tub surround and kitchen faucet replaced in 2020. Living room, dining room, master and kitchen on main level. 2 bedrooms up. Unfinished basement includes laundry area. Tenants rights apply. Long time tenant willing to stay. Do NOT show up at property without a scheduled appointment.
-
2021-06-17$59,900 Active 385-char remark
Show marketing remark (385 chars)
3 Bedroom home with detached garage is great investment! Home in need of maintenance and updates. Tub surround and kitchen faucet replaced in 2020. Living room, dining room, master and kitchen on main level. 2 bedrooms up. Unfinished basement includes laundry area. Tenants rights apply. Long time tenant willing to stay. Do NOT show up at property without a scheduled appointment.
-
2010-01-21historical
-
2010-01-20soldstatus $14,000
-
2009-12-08$14,000
-
2009-10-01historical
-
2008-06-09$19,900
-
2007-12-29historical
-
2007-01-09$59,900
-
2004-06-16historical
-
2004-01-16$62,900
-
2001-05-30soldstatus $23,000
-
2001-04-20$25,000
ⓘ Source: listings_history table (triggers on properties + properties_extension) + one-shot
backfill from property_details.listing_events for pre-trigger history.
Tax reassessment forecast IN · Partial reset (capped growth)
- Current annual tax
- $2,582 · $215/mo
- Projected year-2 tax
- $2,582 · $215/mo
- Expected delta
- $0/yr ($0/mo · 0.0%)
ⓘ Screening estimate from a state-policy table — verify with the county assessor before closing.
Climate risk First Street
- Flood 4/10 Moderate FEMA zone X (unshaded) · 22% chance over 30 yrs
- Wildfire 1/10 Low
- Heat 4/10 Moderate 7 d/yr ≥101°F today · 19 d/yr by 30 yrs out
- Wind 2/10 Low
- Air quality 3/10 Moderate 2 unhealthy d/yr today · 3 by 30 yrs out
Nearby sold comps map
Loading sold comps map…
Walkable amenities ~0.75 mi
Loading nearby amenities…
Taxation est. · year 1
- Rental income
- $14,647
- − Mortgage interest
- −$6,610
- − Property taxes
- −$2,582
- − Insurance
- −$590
- − Repairs & maintenance
- −$1,172
- − Management
- −$1,172
- − Depreciation
- −$3,433
- Taxable loss
- −$911
- Est. tax savings @ 24.0%
- +$219
- After-tax cash flow
- $1,192/yr
For passive investors: Depreciation is non-cash, so a rental often shows a tax loss while cash-flowing — sheltering income. Rental losses are passive: they offset passive income freely, and up to $25,000/yr can offset ordinary (W-2) income if you actively participate and your MAGI is under $100k (phasing out to $0 by $150k); unused losses carry forward. On sale, claimed depreciation is recaptured at up to 25%, and gains may owe capital-gains tax (a 1031 exchange can defer both). Figures are a year-1 estimate at your 24.0% rate — not tax advice; consult a CPA.
Schools (NCES district)
- District
- Indianapolis Public Schools
- NCES district ID
- 1804770
- Math proficiency
- 14% ▼ -7.00%
- Reading proficiency
- 20% ▼ -3.00%
- Median HH income
- $32,034
- Composite
- 13.69/100
- National rank
- #9499
- State rank
- #286 of 301 in IN
Livability — Indianapolis city (balance)
No livability data for this city. (Only ~50 U.S. cities are tracked.)
Census & demographics
- Census place
- Indianapolis city (balance), IN
- County
- Marion County · 998,460 people
- City population
- 881,119
- Metro
- Indianapolis-Carmel-Anderson, IN
- Population (ZIP)
- 37,758
- Household income
- $57,393
- Rent vs Own
- Severe rent burden
- 1499.0
Population outlook (Marion County) Hauer SSP2
- Today (2025)
- 1,025,572 people
- By 2030
- 1,065,727 · +3.9%
- By 2040
- 1,141,577 · +11.3%
- By 2050
- 1,208,920 · +17.9%
- By 2075
- 1,367,288 · +33.3%
- By 2100
- 1,438,201 · +40.2%
Race, ethnicity, and origin ACS 2023
- Neighborhood character
- Predominantly White (69%)
- Race & ethnicity
- White 69% Hispanic / Latino 14% Black 12% Two or more races 8% Asian 2% Native American 1%
- Hispanic origin (detail)
- Mexican 12% Puerto Rican 1%
- Common ancestry
- Slovak 2% Lithuanian 2% Italian 1%
- Foreign-born
- 8% · Canada
- Languages at home
- 88% English-only · Spanish 10% Other Indo-European 1%
Political lean MEDSL · Marion
- 2024 margin
- Strong D (+27.7) · D 63.0% · R 35.3% · Other 1.7%
- 2008→2024 swing
- -0.7pp no change · 2008: 28.4pp · 2024: 27.7pp
- All cycles
- 2024: D+27.7 2020: D+29.1 2016: D+22.8 2012: D+22.2 2008: D+28.4
Not yet ingested
- Civics
- —
Market trends
- HPI YoY
- ▼ -127.37%
- Current HPI
- 349.579
- Rent YoY
- ▲ 2.88%
- Metro
- Indianapolis-Carmel-Anderson, IN
- State GDP YoY
- ▲ 2.90%
- F500 in state
- 18
Industry mix (Fortune 500 HQ in IN)
| Industry | F500 HQs | Revenue |
|---|---|---|
| Industrial Machinery | 2 | $37B |
|
||
| Healthcare | 1 | $177B |
|
||
| Pharmaceuticals | 1 | $45B |
|
||
| Metals / Steel | 1 | $18B |
|
||
| Agriculture | 1 | $17B |
|
||
| Packaging | 1 | $12B |
|
||
Price history
+372.0% since first listed18 events — show timeline
- 2026-04-03 Price Changed $118,000 MIBOR as Distributed by MLS Grid
- 2026-03-19 Price Changed $120,000 MIBOR as Distributed by MLS Grid
- 2026-02-17 Listed $122,500 MIBOR as Distributed by MLS Grid
- 2022-02-07 Price Changed $1,095 RENT.
- 2021-07-05 Sold (MLS) $59,900 MIBOR as Distributed by MLS Grid
- 2021-06-19 Pending — MIBOR as Distributed by MLS Grid
- 2021-06-17 Listed $59,900 MIBOR as Distributed by MLS Grid
- 2010-01-21 Listing Removed — MIBOR as Distributed by MLS Grid
- 2010-01-20 Sold (MLS) $14,000 MIBOR as Distributed by MLS Grid
- 2009-12-08 Listed $14,000 MIBOR as Distributed by MLS Grid
- 2009-10-01 Listing Removed — MIBOR as Distributed by MLS Grid
- 2008-06-09 Listed $19,900 MIBOR as Distributed by MLS Grid
- 2007-12-29 Listing Removed — MIBOR as Distributed by MLS Grid
- 2007-01-09 Listed $59,900 MIBOR as Distributed by MLS Grid
- 2004-06-16 Listing Removed — MIBOR as Distributed by MLS Grid
- 2004-01-16 Listed $62,900 MIBOR as Distributed by MLS Grid
- 2001-05-30 Sold (MLS) $23,000 MIBOR as Distributed by MLS Grid
- 2001-04-20 Listed $25,000 MIBOR as Distributed by MLS Grid
Property tax history
+9.9%/yrLatest (2025): $2,582 · +7.6% YoY. Source: county tax records.
Cash-flow waterfall
monthlySold comps — $/sqft
last 12 mo · ≤1 miLoading sold comps…