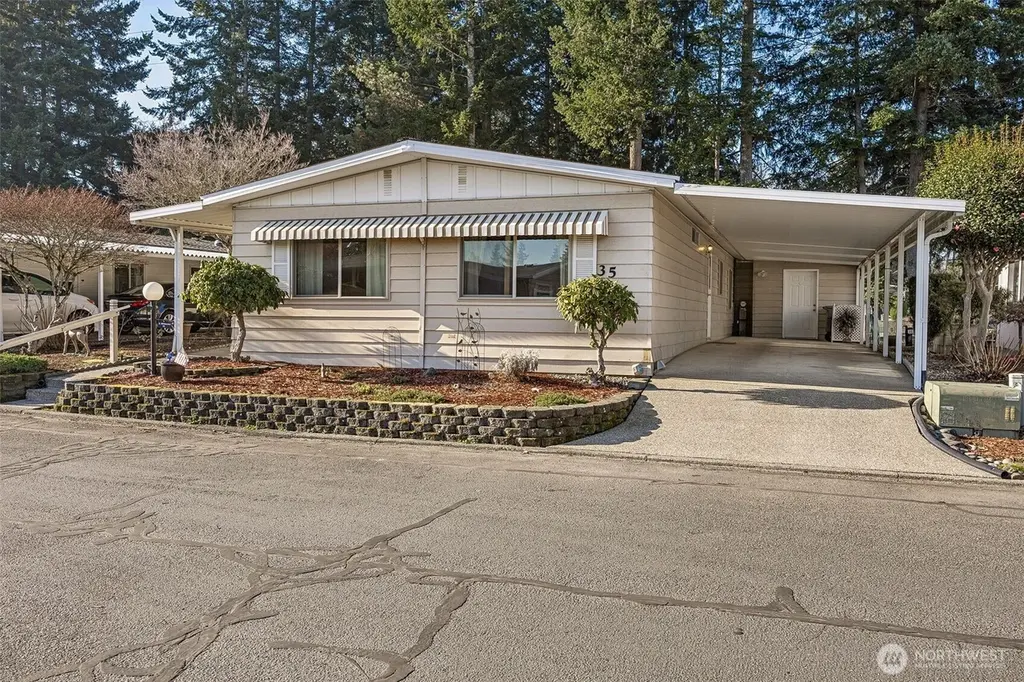
201 Union Ave SE #35 · Renton, WA
Flood risk 1/10 · Minimal
- FEMA flood zone
- X (unshaded)
- Chance of flooding over 30 yrs
- 0.0%
- Est. flood insurance / yr
- $507 – $1,088
Fire risk 1/10 · Minimal
- Est. fire insurance / yr
- $604 – $1,122
Heat risk 3/10 · Minor
- Hot days now (above 86°F)
- 7 days/yr
- Hot days in 30 yrs
- 15 days/yr
Wind risk 1/10 · Minimal
- Chance of severe wind over 30 yrs
- —
Air-quality risk 7/10 · Major
- Unhealthy air days now
- 10 days/yr
- Unhealthy air days in 30 yrs
- 11 days/yr
Risk factors via First Street. Map © Google.
Why this score? — see what drove the B grade
The composite is a weighted blend of 9 inputs, each scored 0–100. Each bar is that input's sub-score; the figure is the points it added to the 100-point composite (weight × sub-score).
- Cash flow +30.0/30.0
- 1% rule +10.0/10.0
- DSCR +10.0/10.0
- ARV discount +5.4/15.0
- Schools +4.7/10.0
- Livability +4.2/5.0
- Condition / age +4.0/5.0
- Rent growth +2.6/5.0
- Appreciation +0.0/10.0
$165,000
🖨 Deal sheet (PDF) 📄 Offer letter ✓ Due diligence
Listing remarks
Welcome to Leisure Estates, a sought-after 55+ gated community in Renton! This spacious double-wide manufactured home offers 1,536 sq ft with 3 bedrooms and 1.75 baths. Features include a primary suite with bath, walk-in closet, skylights, vinyl and wall-to-wall carpet flooring, and central A/C. Enjoy outdoor living with a patio/porch and landscaped yard. Appliances included. Two covered parking spaces. Leisure Estates offers outstanding amenities including a clubhouse, pool, spa, sauna, golf, tennis courts, exercise room, RV parking, sidewalks, and security gate. Park-approved sale required. Convenient location close to shopping, dining, and services.
Key facts
- Gated community
- Clubhouse
- Walk-in closet
Tags
Neighborhood map
What this means for you Summary
Snapshot
- This is a 3-bed/2.0-bath manufactured listed at $165k. Condition is rated good.
Deal economics
- At list price, monthly cash flow is $1k ($17k/yr) — positive.
- The deal already cash-flows at list — no discount required.
- Meets the 1% rule at list price ($3k rent vs $165k).
- Recommended offer: $145k (12.0% below list) — sets the bar for market timing.
- Cap rate 16.3% vs local median 2.3% in Renton — top-decile yield for the area; either an underpriced asset or a hidden risk that comps aren't pricing in. Stress-test before assuming the spread holds.
Location & tenants
- Location reads 83/100 on livability (#52 in WA, #949 nationally) — a professional / high-income tenant draw. Strengths: amenities A+, commute A+, employment A+; Watch: crime D-, cost of living F.
- Renton School District (urban): math 47% / reading 55% proficiency, ranked #119 of 291 in WA (top 41%) — acceptable for families but not a draw, mixed tenant base, ~2y average lease.
- Zoned schools: Maplewood Heights Elementary School (610 students, 27% FRL); Mcknight Middle School (861 students, 52% FRL); Hazen Senior High School (1,871 students, 40% FRL) — zoned schools at 39% FRL track the district average.
- Market conditions: Rents flat; 255 active listings in the ZIP; 20 comparable units currently listed for rent nearby; rentals leasing fast (median 4d on market — plan ~1-2 weeks tenant-placement turnaround); high-income renter base; 10,555 units permitted in King County in 2024 (7,119 in 5+ unit buildings).
Forward outlook
- Local home prices are declining (-3.0%/yr); year-one equity from $1k of loan paydown is wiped out by about $5k of value loss. Plan a longer hold.
- King County population projected at +44% by 2050 — long-run rental-demand tailwind backs the buy-and-hold thesis.
- At projected returns (-3.0% appreciation + 0.3% rent growth), your $46k cash investment doubles in ~4 years — after that, you're playing with house money.
Negotiation context
- It's been on market 152 days — a 12% lower offer ($145k) is reasonable based on typical stale-listing flexibility.
- 2 sale attempts since 23y ago; this cycle's ask has dropped $20k (11%) from the opening price — seller is motivated, your offer sets the floor, not the list.
- Current owner paid $69k; list at $165k implies a 139% gain — meaningful room to come down on a strong offer.
Questions for the listing agent
- It's been on market 152 days. Have you received any prior offers? Is the seller open to a 12% concession, seller financing, or rate buy-down credit?
- Built in 1977 — when were the roof, HVAC, electrical panel, plumbing, and water heater last replaced?
- Why hasn't it sold? Are there any deal-killer items the seller is aware of (foundation, flood, title, zoning, code violations)?
- Is there a deadline driving the sale (1031 exchange, divorce, estate, relocation)? That informs how much negotiation room exists.
- Schools are B-rated — typically a magnet for longer-tenancy family renters. What's the average tenant stay here, and is there a school-zone premium baked into asking?
- Crime grade is D in this area — have there been break-ins, vandalism, or insurance claims at this property in the last 3 years? What carrier currently insures it and at what premium?
- What's the average days-on-market for RENTAL listings here right now (not sales)? A rising rental-DOM trend means longer vacancies and softer asking-rent achievability than the comps imply.
- What's the recent tenant-quality profile in this submarket — average credit score on applications, eviction rate, late-payment / NSF rate, and stable-employment percentage? A property-management company in the area should have these aggregated.
- How much new for-sale + rental construction is in the pipeline within 1–3 miles? Heavy new supply typically softens prices + rents 12–24 months out; constrained supply supports both.
Investment metrics
- 1% rule
- 1.93% ✓
- Cap rate
- 16.32%
- Cash-on-cash
- 35.80%
- DSCR
- 2.59
- GRM
- 4.3
CMA / ARV
- ARV (median comp)
- $157,482
- List price
- $165,000
- Delta
- 4.77%
- Verdict
- FAIR
- Comps
- 20 within 1.0 mi
Show comp detail 12 sales within ~0.75 mi
| Address | Dist | Beds/Ba | Sqft | Sold | Price | $/sf | Match |
|---|---|---|---|---|---|---|---|
| 201 Union Ave SE #188 | 0.00mi | 2/2.0 (-1) | 1,536 (0%) | 10mo | $179,000 | $117 | 87 |
| 201 Union Ave SE #147 | 0.17mi | 2/2.0 (-1) | 1,536 (0%) | 2mo | $100,000 | $65 | 85 |
| 201 Union Ave SE #58 | 0.17mi | 3/2.0 | 1,536 (0%) | 9mo | $130,000 | $85 | 85 |
| 201 Union Ave SE #157 | 0.00mi | 3/2.0 | 1,440 (-6%) | 8mo | $140,000 | $97 | 83 |
| 201 Union Ave SE #74 | 0.00mi | 2/2.0 (-1) | 1,440 (-6%) | 5mo | $181,500 | $126 | 80 |
| 201 Union Ave SE #128 | 0.18mi | 2/2.0 (-1) | 1,536 (0%) | 8mo | $75,000 | $49 | 80 |
| 201 Union Ave SE #251 | 0.18mi | 2/2.0 (-1) | 1,536 (0%) | 10mo | $184,995 | $120 | 78 |
| 201 Union Ave SE #249 | 0.00mi | 2/2.0 (-1) | 1,344 (-12%) | 4mo | $185,500 | $138 | 71 |
| 201 Union Ave SE #234 | 0.18mi | 2/2.0 (-1) | 1,440 (-6%) | 10mo | $90,000 | $63 | 68 |
| 375 Union Ave SE #136 | 0.25mi | 3/2.0 | 1,344 (-12%) | 0mo | $192,448 | $143 | 67 |
| 201 Union Ave SE #112 | 0.22mi | 2/2.0 (-1) | 1,339 (-13%) | 2mo | $86,000 | $64 | 61 |
| 201 Union Ave SE #247 | 0.22mi | 2/2.0 (-1) | 1,344 (-12%) | 6mo | $175,000 | $130 | 59 |
Match score weights: distance 35% · size 25% · config 20% · recency 20%. Top-matched comps best support the ARV.
Projected returns pro-forma
-3.0% appreciation · 0.29% rent growth · sell at horizon
- IRR
- 28.4%
- Equity multiple
- 2.14×
- Total profit
- $52,631
- Equity at exit
- $24,602
- IRR
- 34.2%
- Equity multiple
- 3.73×
- Total profit
- $126,164
- Equity at exit
- $14,266
Cash invested: $46,200 (down + closing). Projections, not guarantees.
Landlord ↔ Tenant lean methodology
- Overall (STATE)
- 28 Tenant-Leaning
- State Washington
- 28 Tenant-Leaning · D+8
- County
- — inherits STATE
- City
- — inherits STATE
ZIP-level market 98059
- Rents YoY
- 0.3%
- Active inventory
- 255
- Price-to-rent
- 4.3×
Monthly cashflow live
- Estimated rent
- $3,188 high interval (Pro) →
- Mortgage (P&I)
- −$865
- Tax est. 1.5%
- −$206 /mo · $2,475/yr
- Insurance
- −$69
- HOA
- −$0
- Vacancy / Maint / Mgmt
- −$669
- Net cashflow
- $1,378
Break-even live
Sensitivity live
| Price | -10% $1,492 | -5% $1,435 | +0% $1,378 | +5% $1,321 | +10% $1,264 |
|---|---|---|---|---|---|
| Rent | -10% $1,126 | -5% $1,252 | +0% $1,378 | +5% $1,504 | +10% $1,630 |
| Rate | -1.0pp $1,461 | -0.5pp $1,420 | base $1,378 | +0.5pp $1,336 | +1.0pp $1,292 |
UW: 25.0% down · 7.5% · 30yr · 1.5% tax · 5.0% vac · 8.0% maint · 8.0% mgmt
Financing live
Cash to close
- Down payment
- $41,250
- Closing costs
- $4,950
- Reserves months
- —
- Total cash needed
- —
Loan-product check · same deal, 3 products live
Conventional
25% down · 7.5% · 30yr
- Down + closing
- —
- Monthly P&I
- —
- Monthly cashflow
- —
- DSCR
- —
- Eligible?
- —
Personal DTI + credit; lowest rate.
DSCR
20% down · 8.5% · 30yr
- Down + closing
- —
- Monthly P&I
- —
- Monthly cashflow
- —
- DSCR
- —
- Eligible?
- —
No personal income docs; deal must DSCR.
Hard money
10% down · 12.0% · 12mo
- Down + closing
- —
- Monthly P&I
- —
- Monthly cashflow
- —
- DSCR
- —
- Eligible?
- —
Short-term bridge; refi at stabilization.
Rent comps 20 comps
| Address | Beds | Baths | Sqft | Rent | $/sqft | DOM | Units | Dist |
|---|---|---|---|---|---|---|---|---|
| 4319 NE 5th Ct #106 Renton, WA | 2.0 | 2.0 | 1090 | $2,250 | $2.06 | 1d | 1 | 0.61mi |
| 4415 NE 5th St Renton, WA | 1.0–3.0 | 1.0–2.0 | 923 | $3,044 | $3.30 | 0d | 10 | 0.63mi |
| 650 Duvall Ave NE Renton, WA | 1.0–3.0 | 1.0–3.0 | 1020 | $3,009 | $2.95 | 0d | 13 | 0.84mi |
| 706 Bremerton Pl NE Renton, WA | 4.0 | 2.5 | 1850 | $3,600 | $1.95 | 3d | 1 | 0.85mi |
| 4627 NE 7th Pl Renton, WA | 4.0 | 2.5 | 1870 | $3,595 | $1.92 | 25d | 1 | 0.87mi |
| 5027 NE 5th Pl Renton, WA | 3.0 | 2.5 | 1287 | $3,300 | $2.56 | 25d | 1 | 0.88mi |
| 850 Bremerton Ave NE Renton, WA | 4.0 | 2.5 | 2010 | $3,490 | $1.74 | 45d | 1 | 0.96mi |
| 5415 NE 4th St Renton, WA | 2.0 | 2.0 | 1810 | $2,650 | $1.46 | 45d | 1 | 1.01mi |
| 2902 SE 11th Pl #1066 Renton, WA | 4.0 | 3.0 | 1823 | $3,299 | $1.81 | 26d | 1 | 1.04mi |
| 14051 145th Ave SE Renton, WA | 3.0 | 2.0 | 1548 | $3,050 | $1.97 | 0d | 1 | 1.08mi |
| 950 Harrington Ave NE Renton, WA | 1.0–2.0 | 1.0–2.0 | 882 | $2,854 | $3.24 | 1d | 9 | 1.15mi |
| 15205 140th Way SE Renton, WA | 1.0–3.0 | 1.0–2.0 | 1121 | $3,542 | $3.16 | 0d | 10 | 1.21mi |
| 1601 Olympia Ave SE Renton, WA | 4.0 | 2.5 | 2230 | $3,600 | $1.61 | 45d | 1 | 1.24mi |
| 2715 Sunset Ln NE Renton, WA | 1.0–2.0 | 1.0–2.0 | 922 | $3,131 | $3.39 | 1d | 7 | 1.27mi |
| 2227 SE 8th Pl Renton, WA | 3.0 | 2.0 | 1560 | $3,650 | $2.34 | 5d | 1 | 1.29mi |
| 3109 NE 11th Pl Unit 3109D Renton, WA | 2.0 | 1.5 | 1186 | $2,525 | $2.13 | 5d | 1 | 1.32mi |
| 2950 NE 11th St Renton, WA | 1.0–2.0 | 1.0–2.5 | 1050 | $3,937 | $3.75 | 0d | 16 | 1.35mi |
| 1930 NE 7th Ct Renton, WA | 3.0 | 2.5 | 1742 | $3,450 | $1.98 | 1d | 1 | 1.44mi |
| 2615 SE 16th St Renton, WA | 4.0 | 3.0 | 1910 | $3,100 | $1.62 | 3d | 1 | 1.45mi |
| 825 Sunset Blvd NE Unit B-1 Renton, WA | 2.0 | 2.5 | 1150 | $2,650 | $2.30 | 14d | 1 | 1.47mi |
Listing history 19 events
-
2026-06-21days on market $165,000 Active 152 DOM
-
2026-06-18days on market $165,000 Active 149 DOM
-
2026-06-17days on market $165,000 Active 148 DOM
-
2026-06-16days on market $165,000 Active 147 DOM
-
2026-06-15days on market $165,000 Active 146 DOM
-
2026-06-13days on market $165,000 Active 144 DOM
-
2026-06-13days on market $165,000 Active 143 DOM
-
2026-06-09days on market $165,000 Active 140 DOM
-
2026-06-08days on market $165,000 Active 139 DOM
-
2026-06-07days on market $165,000 Active 138 DOM
-
2026-06-04days on market $165,000 Active 135 DOM
-
2026-06-03days on market $165,000 Active 134 DOM
-
2026-06-02days on market $165,000 Active 133 DOM
-
2026-06-01days on market $165,000 Active 132 DOM
-
2026-05-31days on market $165,000 Active 131 DOM
-
2026-04-13price $165,000
-
2026-01-20$185,000 Active
-
2003-11-26soldstatus $68,950
-
2003-09-28$68,950
ⓘ Source: listings_history table (triggers on properties + properties_extension) + one-shot
backfill from property_details.listing_events for pre-trigger history.
Climate risk First Street
- Flood 1/10 Low FEMA zone X (unshaded) · 0% chance over 30 yrs
- Wildfire 1/10 Low
- Heat 3/10 Moderate 7 d/yr ≥86°F today · 15 d/yr by 30 yrs out
- Wind 1/10 Low
- Air quality 7/10 Severe 10 unhealthy d/yr today · 11 by 30 yrs out
Nearby sold comps map
Loading sold comps map…
Walkable amenities ~0.75 mi
Loading nearby amenities…
Taxation est. · year 1
- Rental income
- $38,257
- − Mortgage interest
- −$9,243
- − Property taxes
- −$2,475
- − Insurance
- −$825
- − Repairs & maintenance
- −$3,061
- − Management
- −$3,061
- − Depreciation
- −$4,800
- Taxable income
- $14,793
- Est. tax owed @ 24.0%
- −$3,550
- After-tax cash flow
- $12,989/yr
For passive investors: Depreciation is non-cash, so a rental often shows a tax loss while cash-flowing — sheltering income. Rental losses are passive: they offset passive income freely, and up to $25,000/yr can offset ordinary (W-2) income if you actively participate and your MAGI is under $100k (phasing out to $0 by $150k); unused losses carry forward. On sale, claimed depreciation is recaptured at up to 25%, and gains may owe capital-gains tax (a 1031 exchange can defer both). Figures are a year-1 estimate at your 24.0% rate — not tax advice; consult a CPA.
Condition & rehab AI · 12 photos
This well-maintained manufactured home in Leisure Estates offers a good condition with minor updates needed to enhance its resale and rental value.
Repairs flagged
- Minor kitchen cabinets — Aesthetic update needed.
- Minor bathroom fixtures — Update to modernize the space.
- Minor kitchen countertops — Clean and freshen up the space.
Value-add opportunities
- Both Paint interior walls — Fresh paint enhances curb appeal and interior aesthetics.
- Both Replace kitchen cabinets — Modern cabinets improve functionality and aesthetics.
- Both Update bathroom fixtures — Modern fixtures improve functionality and aesthetics.
Renovation cost estimate screening
| Repair item | Severity | Est. cost |
|---|---|---|
| kitchen cabinets · Aesthetic update needed. | Minor | $500–3,000 |
| bathroom fixtures · Update to modernize the space. | Minor | $500–3,000 |
| kitchen countertops · Clean and freshen up the space. | Minor | $500–3,000 |
| Total estimated repair cost · 3 items | $1,500–9,000 |
Value-add ROI direction
- Both Paint interior walls — Fresh paint enhances curb appeal and interior aesthetics. ↑
- Both Replace kitchen cabinets — Modern cabinets improve functionality and aesthetics. ↑
- Both Update bathroom fixtures — Modern fixtures improve functionality and aesthetics. ↑
ⓘ Cost ranges are severity-bucket heuristics (US national rule-of-thumb). Get contractor quotes + a written scope before underwriting a rehab budget.
Schools (NCES district)
- District
- Renton School District
- NCES district ID
- 5307230
- Math proficiency
- 47% ▼ -1.00%
- Reading proficiency
- 55% ▼ -1.00%
- Median HH income
- $66,354
- Composite
- 47.13/100
- National rank
- #5108
- State rank
- #119 of 291 in WA
Livability — Renton
- Score
- 83/100
- State rank
- #52
- US rank
- #949
Category grades
Schools grade is shown separately in the Schools card above.
Census & demographics
- Census place
- Renton, WA
- County
- King County · 2,251,916 people
- City population
- 158,600
- Metro
- Seattle-Tacoma-Bellevue, WA
- Population (ZIP)
- 42,406
- Household income
- $138,654
- Rent vs Own
- Severe rent burden
- 908.0
Population outlook (King County) Hauer SSP2
- Today (2025)
- 2,576,485 people
- By 2030
- 2,803,316 · +8.8%
- By 2040
- 3,255,921 · +26.4%
- By 2050
- 3,706,444 · +43.9%
- By 2075
- 4,746,063 · +84.2%
- By 2100
- 5,407,730 · +109.9%
Race, ethnicity, and origin ACS 2023
- Neighborhood character
- Diverse neighborhood (Simpson 0.68)
- Race & ethnicity
- White 48% Asian 29% Two or more races 15% Hispanic / Latino 9% Black 2%
- Hispanic origin (detail)
- Mexican 5%
- Common ancestry
- Portuguese 3% Italian 3% Slovak 2%
- Foreign-born
- 23% · China, Vietnam, Canada
- Languages at home
- 67% English-only · Chinese 9% Vietnamese 6% Spanish 5%
Political lean MEDSL · King
- 2024 margin
- Solid D (+51.7) · D 74.2% · R 22.5% · Other 3.4%
- 2008→2024 swing
- +9.6pp toward D · 2008: 42.1pp · 2024: 51.7pp
- All cycles
- 2024: D+51.7 2020: D+52.7 2016: D+50.4 2012: D+39.9 2008: D+42.1
Not yet ingested
- Civics
- —
Market trends
- HPI YoY
- ▼ -920.66%
- Current HPI
- 338.4495
- Rent YoY
- ▲ 0.29%
- Metro
- Seattle-Tacoma-Bellevue, WA
- State GDP YoY
- ▲ 4.65%
- F500 in state
- 22
Industry mix (Fortune 500 HQ in WA)
| Industry | F500 HQs | Revenue |
|---|---|---|
| Retail | 2 | $269B |
|
||
| Technology / Retail | 1 | $638B |
|
||
| Technology | 1 | $245B |
|
||
| Telecommunications | 1 | $38B |
|
||
| Food / Beverage | 1 | $36B |
|
||
| Automotive / Trucks | 1 | $34B |
|
||
Price history
+139.3% since first listed4 events — show timeline
- 2026-04-13 Price Changed $165,000 NWMLS as Distributed by MLS Grid
- 2026-01-20 Listed $185,000 NWMLS as Distributed by MLS Grid
- 2003-11-26 Sold (MLS) $68,950 NWMLS as Distributed by MLS Grid
- 2003-09-28 Listed $68,950 NWMLS as Distributed by MLS Grid
Cash-flow waterfall
monthlySold comps — $/sqft
last 12 mo · ≤1 miLoading sold comps…