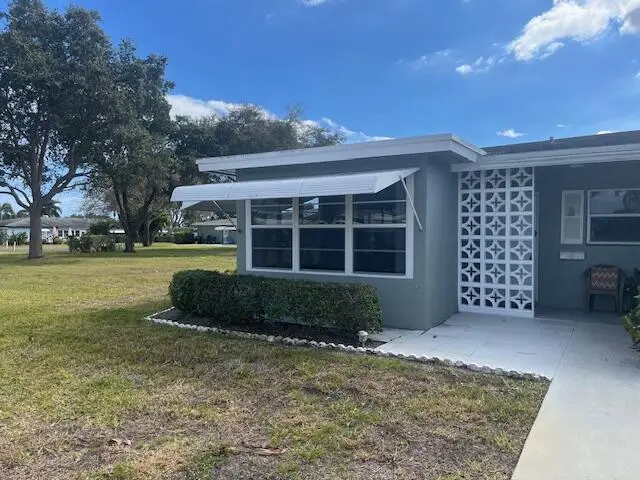
910 S South Dr Unit A · Delray Beach, FL
Flood risk 1/10 · Minimal
- FEMA flood zone
- X (unshaded)
- Chance of flooding over 30 yrs
- 0.0%
- Est. flood insurance / yr
- $507 – $1,088
Fire risk 1/10 · Minimal
- Est. fire insurance / yr
- $947 – $1,759
Heat risk 10/10 · Severe
- Hot days now (above 106°F)
- 7 days/yr
- Hot days in 30 yrs
- 28 days/yr
Wind risk 10/10 · Severe
- Chance of severe wind over 30 yrs
- 99.0%
Air-quality risk 2/10 · Minimal
- Unhealthy air days now
- 1 days/yr
- Unhealthy air days in 30 yrs
- 2 days/yr
Risk factors via First Street. Map © Google.
Why this score? — see what drove the C+ grade
The composite is a weighted blend of 9 inputs, each scored 0–100. Each bar is that input's sub-score; the figure is the points it added to the 100-point composite (weight × sub-score).
- Cash flow +23.7/30.0
- 1% rule +10.0/10.0
- DSCR +7.6/10.0
- ARV discount +7.5/15.0
- Schools +4.3/10.0
- Livability +3.9/5.0
- Rent growth +3.0/5.0
- Condition / age +2.5/5.0
- Appreciation +0.0/10.0
$170,000
🖨 Deal sheet 📄 Offer letter ✓ Due diligence
Listing remarks
Great price 170K! High Point of Delray which is a 55+ age community. End location with lots of windows- replaced 2009, see the lovely green views. Sunny & bright 2 bedroom 2 bath + Enclosed patio/Sunroom/Florida rm more space to enjoy. . Updated Kitchen is open & gorgeous w/ granite. Baths are also updated. Ceramic tile flooring & carpet in liv rm & bedrooms. The Assoc fee includes water, sewer, wifi, Bldg Ins, & TV/cable. The Clubhouse & Pool are close. The Furniture stays except for kitchen table & chairs, rocking chair & twin beds in guest room. The laundry room(washer & dryer) is attached just a few steps from backdoor. Open patio are
Key facts
- Clubhouse
- Impact glass
- Updated kitchen
Tags
Property features AI
Finance
- HOA & community: Monthly HOA ($559) — includes cable TV, insurance, grounds maintenance, pest control, sewer, water, and common areas; Community amenities: Billiard room, Clubhouse, Fitness center, Laundry, Pool, Shuffleboard court, Tennis courts, Bocce ball, Library; Senior community; No pets allowed
Exterior
- Security: Smoke detector(s)
- Utilities: Public water; Public sewer; Three-phase electric; Cable available; Sewer available; Water available
- Home design: Condominium; Single-story; Faces north; Resale
- Construction: CBS construction; Composition/shingle roof
- Exterior features: Open patio; Patio
Interior
- Kitchen: Dishwasher; Electric range; Microwave; Refrigerator; Disposal; Electric water heater
- Bedrooms: 2 bedrooms on the main level
- Flooring: Carpet; Ceramic tile
- Bathrooms: 2 full bathrooms on the main level
- Heating & cooling: Central heating; Central air
- Interior features: Built-in features; Walk-in closet(s); Blinds; Furnished
- Laundry & utility: Laundry facilities (association amenities include laundry)
Neighborhood map
What this means for you Summary
Snapshot
- This is a 2-bed/2.0-bath condo listed at $170k.
Deal economics
- At list price, monthly cash flow is $323 ($4k/yr) — positive.
- The deal already cash-flows at list — no discount required.
- Meets the 1% rule at list price ($3k rent vs $170k).
- Recommended offer: $160k (6.0% below list) — sets the bar for market timing.
- Cap rate 8.6% vs local median 4.3% in Delray Beach — top-decile yield for the area; either an underpriced asset or a hidden risk that comps aren't pricing in. Stress-test before assuming the spread holds.
Location & tenants
- Location reads 77/100 on livability (#202 in FL, #3,160 nationally) — a middle-class / working-renter tenant base. Strengths: housing A+, health & safety A+, commute A-; Watch: cost of living C-, crime D-, amenities F.
- Palm Beach (suburban): math 46% / reading 53% proficiency, ranked #34 of 73 in FL (top 47%) — families likely to look elsewhere, expect single-tenant / working-renter base with shorter leases.
- Zoned schools: Crosspointe Elementary School (math 36% / reading 45%, grade F, #1,471 of 2,144 statewide, top 69%, 652 students, 75% FRL); Atlantic High School (math 28% / reading 52%, grade F, #296 of 667 statewide, top 45%, 1,889 students, 59% FRL) — zoned schools average 67% FRL vs 52% district-wide (15 pts higher); higher-poverty schools than district average — tighter screening recommended.
- Market conditions: Rents rising (+1.8%/yr); 354 active listings in the ZIP; 40 comparable units currently listed for rent nearby; rentals at typical pace (median 22d on market — plan ~3-4 weeks tenant-placement turnaround); solid renter incomes; 3,974 units permitted in Palm Beach County in 2024 (1,012 in 5+ unit buildings).
- This rent runs 41% of the median local income ($78k/yr) — at the standard rent-burdened threshold; future hikes will face affordability resistance.
Forward outlook
- Local home prices are declining (-3.0%/yr); year-one equity from $1k of loan paydown is wiped out by about $5k of value loss. Plan a longer hold.
- Palm Beach County population projected at +30% by 2050 — long-run rental-demand tailwind backs the buy-and-hold thesis.
Negotiation context
- It's been on market 85 days — a 6% lower offer ($160k) is reasonable based on typical stale-listing flexibility.
- 4 sale attempts; this cycle's ask has dropped $35k (17%) from the opening price — seller is motivated, your offer sets the floor, not the list.
- Current owner paid $42k; list at $170k implies a 305% gain — meaningful room to come down on a strong offer.
Risks & watch-outs
- Watch-outs: HOA is 21% of rent.
- Climate carrying-cost: severe wind risk, 99% chance of damaging wind over 30y; extreme-heat days projected 7→28/yr by 2055 (HVAC capex compounding) — expect insurance premiums to compound above CPI over the hold.
Questions for the listing agent
- It's been on market 85 days. Have you received any prior offers? Is the seller open to a 6% concession, seller financing, or rate buy-down credit?
- Built in 1973 — when were the roof, HVAC, electrical panel, plumbing, and water heater last replaced?
- What does the HOA fee cover, when was the last increase, and are there any pending special assessments or reserve-fund shortfalls?
- Any open or pending special assessments — roof, HVAC, plumbing, elevator, façade? What's the per-unit balance and payoff schedule, and is the seller paying it off at close or rolling it to the buyer?
- Why hasn't it sold? Are there any deal-killer items the seller is aware of (foundation, flood, title, zoning, code violations)?
- Is there a deadline driving the sale (1031 exchange, divorce, estate, relocation)? That informs how much negotiation room exists.
- Schools are B-rated — typically a magnet for longer-tenancy family renters. What's the average tenant stay here, and is there a school-zone premium baked into asking?
- Crime grade is D in this area — have there been break-ins, vandalism, or insurance claims at this property in the last 3 years? What carrier currently insures it and at what premium?
- What's the average days-on-market for RENTAL listings here right now (not sales)? A rising rental-DOM trend means longer vacancies and softer asking-rent achievability than the comps imply.
- What's the recent tenant-quality profile in this submarket — average credit score on applications, eviction rate, late-payment / NSF rate, and stable-employment percentage? A property-management company in the area should have these aggregated.
- How much new apartment / multifamily construction is in the pipeline within 1–3 miles? Heavy new supply (>2% of stock underway) typically softens rents 12–24 months out; light construction supports rent growth.
Investment metrics
- 1% rule
- 1.57% ✓
- Cap rate
- 8.58%
- Cash-on-cash
- 8.15%
- DSCR
- 1.36
- GRM
- 5.3
CMA / ARV
No comps found within radius.
Projected returns pro-forma
-3.0% appreciation · 1.83% rent growth · sell at horizon
- IRR
- -5.5%
- Equity multiple
- 0.80×
- Total profit
- $-9,647
- Equity at exit
- $25,348
- IRR
- 2.3%
- Equity multiple
- 1.15×
- Total profit
- $7,351
- Equity at exit
- $14,698
Cash invested: $47,600 (down + closing). Projections, not guarantees.
Landlord ↔ Tenant lean methodology
- Overall (STATE)
- 87 Strongly Landlord-Friendly
- State Florida
- 87 Strongly Landlord-Friendly · R+3
- County
- — inherits STATE
- City
- — inherits STATE
ZIP-level market 33445
- Rents YoY
- 1.8%
- Active inventory
- 354
- Price-to-rent
- 5.3×
Monthly cashflow live
- Estimated rent
- $2,670 high interval (Pro) →
- Mortgage (P&I)
- −$891
- Tax from tax record
- −$265 /mo · $3,174/yr
- Insurance
- −$71
- HOA
- −$559
- Vacancy / Maint / Mgmt
- −$561
- Net cashflow
- $323
Break-even live
UW: 25.0% down · 7.5% · 30yr · 1.5% tax · 5.0% vac · 8.0% maint · 8.0% mgmt
Financing live
Cash to close
- Down payment
- $42,500
- Closing costs
- $5,100
- Reserves months
- —
- Total cash needed
- —
Loan-product check · same deal, 3 products live
Conventional
25% down · 7.5% · 30yr
- Down + closing
- —
- Monthly P&I
- —
- Monthly cashflow
- —
- DSCR
- —
- Eligible?
- —
Personal DTI + credit; lowest rate.
DSCR
20% down · 8.5% · 30yr
- Down + closing
- —
- Monthly P&I
- —
- Monthly cashflow
- —
- DSCR
- —
- Eligible?
- —
No personal income docs; deal must DSCR.
Hard money
10% down · 12.0% · 12mo
- Down + closing
- —
- Monthly P&I
- —
- Monthly cashflow
- —
- DSCR
- —
- Eligible?
- —
Short-term bridge; refi at stabilization.
Rent comps 40 comps
| Address | Beds | Baths | Sqft | Rent | $/sqft | DOM | Units | Dist |
|---|---|---|---|---|---|---|---|---|
| 707 High Point Blvd N Unit C Delray Beach, FL | 1.0 | 1.5 | 994 | $1,600 | $1.61 | 24d | 1 | 0.10mi |
| 775 North Dr Unit A Delray Beach, FL | 2.0 | 2.0 | 1175 | $2,000 | $1.70 | 10d | 1 | 0.13mi |
| 512 High Point Dr Unit C Delray Beach, FL | 1.0 | 2.0 | 994 | $2,100 | $2.11 | 19d | 1 | 0.17mi |
| 1152 Circle Dr Unit D Delray Beach, FL | 2.0 | 2.0 | 1200 | $2,000 | $1.67 | 12d | 1 | 0.24mi |
| 1155 South Drive Cir Unit A Delray Beach, FL | 2.0 | 2.0 | 1080 | $2,195 | $2.03 | 24d | 1 | 0.24mi |
| 1152 Circle Dr Unit D Delray Beach, FL | 2.0 | 2.0 | 1200 | $2,000 | $1.67 | 24d | 1 | 0.24mi |
| 405 High Point Blvd Unit C Delray Beach, FL | 1.0 | 1.5 | 994 | $1,500 | $1.51 | 24d | 1 | 0.25mi |
| 1142 Circle Ter W Unit C Delray Beach, FL | 1.0 | 1.5 | 1080 | $1,700 | $1.57 | 2d | 1 | 0.27mi |
| 328 W Coral Trace Cir Unit 328 Delray Beach, FL | 3.0 | 2.5 | 1632 | $3,500 | $2.14 | 10d | 1 | 0.32mi |
| 328 W Coral Trace Cir Delray Beach, FL | 3.0 | 2.5 | 1632 | $3,500 | $2.14 | 21d | 1 | 0.32mi |
| 3935 Village Dr Unit A Delray Beach, FL | 3.0 | 3.0 | 1326 | $2,700 | $2.04 | 7d | 1 | 0.36mi |
| 3935 Village Dr Delray Beach, FL | 3.0 | 3.0 | 1326 | $2,700 | $2.04 | 5d | 1 | 0.36mi |
| 2513 Coral Trace Pl Delray Beach, FL | 3.0 | 2.5 | 1632 | $3,500 | $2.14 | 24d | 1 | 0.38mi |
| 215 NW 40th Ave Delray Beach, FL | 3.0 | 2.0 | 1240 | $3,350 | $2.70 | 24d | 1 | 0.40mi |
| 2480 S Coral Trace Cir Delray Beach, FL | 2.0 | 2.0 | 1379 | $2,900 | $2.10 | 7d | 1 | 0.40mi |
| 227 Coral Trace Ln Unit 227 Delray Beach, FL | 2.0 | 2.0 | 1376 | $3,100 | $2.25 | 24d | 1 | 0.41mi |
| 212 High Point Ter W Unit C Delray Beach, FL | 1.0 | 1.5 | 1122 | $2,000 | $1.78 | 21d | 1 | 0.42mi |
| 315 Coral Trace Ln Delray Beach, FL | 3.0 | 2.0 | 1576 | $3,800 | $2.41 | 7d | 1 | 0.42mi |
| 2450 S Coral Trace Cir Delray Beach, FL | 3.0 | 2.0 | 1576 | $2,975 | $1.89 | 24d | 1 | 0.44mi |
| 1252 Club Dr W Unit D Delray Beach, FL | 2.0 | 2.0 | 1137 | $2,100 | $1.85 | 24d | 1 | 0.46mi |
| 1252 Club Dr W Unit D Delray Beach, FL | 2.0 | 2.0 | 1137 | $2,100 | $1.85 | 5d | 1 | 0.46mi |
| 2941 Angler Dr Delray Beach, FL | 3.0 | 2.0 | 1578 | $5,000 | $3.17 | 24d | 1 | 0.46mi |
| 2712 Lake Ida Rd Delray Beach, FL | 3.0 | 2.0 | 1604 | $4,000 | $2.49 | 7d | 1 | 0.50mi |
| 4310 Village Dr Unit D Delray Beach, FL | 3.0 | 3.0 | 1326 | $2,600 | $1.96 | 24d | 1 | 0.53mi |
| 125 Via D Este Delray Beach, FL | 1.0–3.0 | 1.0–2.0 | 1156 | $3,290 | $2.85 | 1d | 13 | 0.56mi |
| 2622 NW 7th Ct Delray Beach, FL | 2.0 | 2.5 | 1384 | $2,750 | $1.99 | 24d | 1 | 0.56mi |
| 797 NW 32nd Ave Delray Beach, FL | 2.0 | 2.0 | 1480 | $2,800 | $1.89 | 17d | 1 | 0.61mi |
| 797 NW 32nd Ave Delray Beach, FL | 2.0 | 2.0 | 1480 | $2,800 | $1.89 | 24d | 1 | 0.61mi |
| 3996 NW 7th Ct Delray Beach, FL | 3.0 | 2.0 | 1480 | $5,000 | $3.38 | 24d | 1 | 0.61mi |
| 4515 NW 3rd Ct Unit C Delray Beach, FL | 1.0 | 2.0 | 1080 | $1,900 | $1.76 | 24d | 1 | 0.62mi |
| 872 NW 29th Ave Unit A Delray Beach, FL | 2.0 | 2.0 | 1188 | $2,700 | $2.27 | 24d | 1 | 0.65mi |
| 305 SW 28th Ave Delray Beach, FL | 2.0 | 2.0 | 1369 | $4,300 | $3.14 | 13d | 1 | 0.67mi |
| 354 SW 28th Ave Delray Beach, FL | 2.0 | 2.0 | 1369 | $5,450 | $3.98 | 24d | 1 | 0.69mi |
| 378 SW 28th Ave Delray Beach, FL | 3.0 | 2.0 | 1519 | $3,500 | $2.30 | 10d | 1 | 0.72mi |
| 945 Sunflower Ave Delray Beach, FL | 3.0 | 2.0 | 1755 | $4,500 | $2.56 | 7d | 1 | 0.72mi |
| 500 N Congress Ave Delray Beach, FL | 2.0–3.0 | 1.0–2.0 | 989 | $2,295 | $2.32 | 1d | 6 | 0.73mi |
| 4110 NW 10th St Delray Beach, FL | 3.0 | 2.5 | 1839 | $4,500 | $2.45 | 24d | 1 | 0.78mi |
| 4510 NW 2nd St Unit A Delray Beach, FL | 2.0 | 2.0 | 1080 | $1,800 | $1.67 | 24d | 1 | 0.78mi |
| 2915 NW 12th St Unit D Delray Beach, FL | 2.0 | 2.0 | 1499 | $3,200 | $2.13 | 7d | 1 | 0.84mi |
| 2583 NW 13th St Delray Beach, FL | 2.0 | 2.0 | 1466 | $2,600 | $1.77 | 17d | 1 | 0.92mi |
HOA detail condo
- Monthly dues
- $559 · $6,708/yr
- Likely covers
- watersewerinternetcablepool
- Assessments
- None detected in remarks — confirm with the listing agent.
Listing history 18 events
-
2026-05-05status Pending
-
2026-05-04price $170,000
-
2026-04-28price $175,000
-
2026-04-28price $184,900
-
2026-04-22price $185,000
-
2026-04-08price $190,000
-
2026-03-27price $197,900
-
2026-03-17price $199,000
-
2026-03-02price $202,500
-
2026-02-06$205,000 Active
-
2026-02-04historical
-
2025-12-07$219,900 Active
-
2025-12-06historical
-
2025-11-05price $219,900
-
2025-11-04historical $2,400
-
2025-05-07$2,400
-
2025-05-02$229,000 Active
-
1997-05-02soldstatus $42,000
ⓘ Source: listings_history table (triggers on properties + properties_extension) + one-shot
backfill from property_details.listing_events for pre-trigger history.
Tax reassessment forecast FL · Resets to sale price
- Current annual tax
- $3,174 · $265/mo
- Projected year-2 tax
- $3,174 · $265/mo
- Expected delta
- $0/yr ($0/mo · 0.0%)
ⓘ Screening estimate from a state-policy table — verify with the county assessor before closing.
Climate risk First Street
- Flood 1/10 Low FEMA zone X (unshaded) · 0% chance over 30 yrs
- Wildfire 1/10 Low
- Heat 10/10 Extreme 7 d/yr ≥106°F today · 28 d/yr by 30 yrs out
- Wind 10/10 Extreme 99% chance of damaging wind over 30 yrs
- Air quality 2/10 Low 1 unhealthy d/yr today · 2 by 30 yrs out
Nearby sold comps map
Loading sold comps map…
Walkable amenities ~0.75 mi
Loading nearby amenities…
Taxation est. · year 1
- Rental income
- $32,037
- − Mortgage interest
- −$9,523
- − Property taxes
- −$3,174
- − Insurance
- −$850
- − Repairs & maintenance
- −$2,563
- − Management
- −$2,563
- − HOA
- −$6,708
- − Depreciation
- −$4,945
- Taxable income
- $1,711
- Est. tax owed @ 24.0%
- −$411
- After-tax cash flow
- $3,469/yr
For passive investors: Depreciation is non-cash, so a rental often shows a tax loss while cash-flowing — sheltering income. Rental losses are passive: they offset passive income freely, and up to $25,000/yr can offset ordinary (W-2) income if you actively participate and your MAGI is under $100k (phasing out to $0 by $150k); unused losses carry forward. On sale, claimed depreciation is recaptured at up to 25%, and gains may owe capital-gains tax (a 1031 exchange can defer both). Figures are a year-1 estimate at your 24.0% rate — not tax advice; consult a CPA.
Schools (NCES district)
- District
- Palm Beach
- NCES district ID
- 1201500
- Math proficiency
- 46% ▼ -16.00%
- Reading proficiency
- 53% ▼ -4.00%
- Median HH income
- $53,943
- Composite
- 42.72/100
- National rank
- #3160
- State rank
- #34 of 73 in FL
Livability — Delray Beach
- Score
- 77/100
- State rank
- #202
- US rank
- #3160
Category grades
Schools grade is shown separately in the Schools card above.
Census & demographics
- Census place
- Delray Beach, FL
- County
- Palm Beach County · 1,438,312 people
- City population
- 123,167
- Metro
- Miami-Fort Lauderdale-Pompano Beach, FL
- Population (ZIP)
- 33,122
- Household income
- $78,163
- Rent vs Own
- Severe rent burden
- 1649.0
Population outlook (Palm Beach County) Hauer SSP2
- Today (2025)
- 1,637,487 people
- By 2030
- 1,743,255 · +6.5%
- By 2040
- 1,948,712 · +19.0%
- By 2050
- 2,132,979 · +30.3%
- By 2075
- 2,530,027 · +54.5%
- By 2100
- 2,706,979 · +65.3%
Race, ethnicity, and origin ACS 2023
- Neighborhood character
- Diverse neighborhood (Simpson 0.62)
- Race & ethnicity
- White 55% Black 24% Hispanic / Latino 11% Two or more races 11% Asian 4%
- Hispanic origin (detail)
- Puerto Rican 3% Cuban 2%
- Common ancestry
- Hispanic 14% Romanian 3% Scotch-Irish 3%
- Foreign-born
- 27% · Canada, Jamaica, Dominican Republic
- Languages at home
- 66% English-only · French/Haitian/Cajun 18% Spanish 9% Other Indo-European 4%
Political lean MEDSL · Palm Beach
- 2024 margin
- Toss-up / Even · D 50.0% · R 49.2%
- 2008→2024 swing
- -22.1pp toward R · 2008: 22.9pp · 2024: 0.8pp
- All cycles
- 2024: D+0.8 2020: D+12.8 2016: D+15.3 2012: D+17.0 2008: D+22.9
Not yet ingested
- Civics
- —
Market trends
- HPI YoY
- ▼ -258.16%
- Current HPI
- 349.5505
- Rent YoY
- ▲ 1.83%
- Metro
- Miami-Fort Lauderdale-Pompano Beach, FL
- State GDP YoY
- ▲ 3.28%
- F500 in state
- 36
Industry mix (Fortune 500 HQ in FL)
| Industry | F500 HQs | Revenue |
|---|---|---|
| Industrial Technology | 2 | $29B |
|
||
| Insurance | 2 | $17B |
|
||
| Retail | 1 | $60B |
|
||
| Technology Distribution | 1 | $58B |
|
||
| Homebuilding | 1 | $35B |
|
||
| Technology Manufacturing | 1 | $35B |
|
||
Price history
+304.8% since first listed18 events — show timeline
- 2026-05-05 Pending — Beaches MLS
- 2026-05-04 Price Changed $170,000 Beaches MLS
- 2026-04-28 Price Changed $175,000 Beaches MLS
- 2026-04-28 Price Changed $184,900 Beaches MLS
- 2026-04-22 Price Changed $185,000 Beaches MLS
- 2026-04-08 Price Changed $190,000 Beaches MLS
- 2026-03-27 Price Changed $197,900 Beaches MLS
- 2026-03-17 Price Changed $199,000 Beaches MLS
- 2026-03-02 Price Changed $202,500 Beaches MLS
- 2026-02-06 Listed $205,000 Beaches MLS
- 2026-02-04 Listing Removed — Beaches MLS
- 2025-12-07 Listed $219,900 Beaches MLS
- 2025-12-06 Listing Removed — Beaches MLS
- 2025-11-05 Price Changed $219,900 Beaches MLS
- 2025-11-04 Rental Removed $2,400 RMLSFL
- 2025-05-07 Listed for Rent $2,400 RMLSFL
- 2025-05-02 Listed $229,000 Beaches MLS
- 1997-05-02 Sold (Public Records) $42,000 Public Records
Property tax history
+9.0%/yrLatest (2025): $3,174 · +9.1% YoY. Source: county tax records.
Cash-flow waterfall
monthlySold comps — $/sqft
last 12 mo · ≤1 miLoading sold comps…