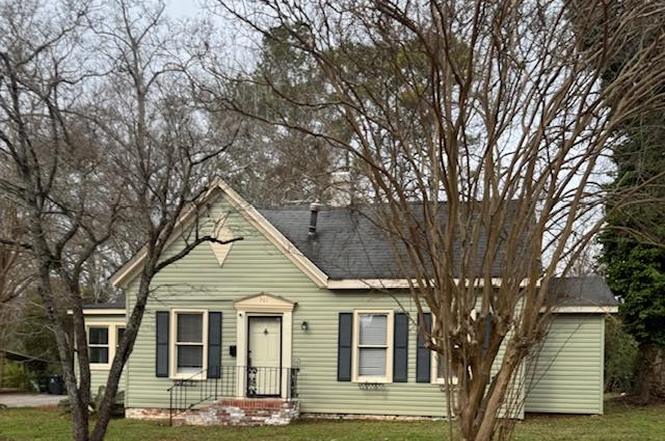
301 Magazine St · Abbeville, SC
Flood risk 1/10 · Minimal
- FEMA flood zone
- X (unshaded)
- Chance of flooding over 30 yrs
- 0.0%
- Est. flood insurance / yr
- $507 – $1,088
Fire risk 3/10 · Minor
- Est. fire insurance / yr
- $783 – $1,453
Heat risk 6/10 · Moderate
- Hot days now (above 106°F)
- 7 days/yr
- Hot days in 30 yrs
- 17 days/yr
Wind risk 6/10 · Moderate
- Chance of severe wind over 30 yrs
- 27.0%
Air-quality risk 2/10 · Minimal
- Unhealthy air days now
- 2 days/yr
- Unhealthy air days in 30 yrs
- 2 days/yr
Risk factors via First Street. Map © Google.
Why this score? — see what drove the D+ grade
The composite is a weighted blend of 9 inputs, each scored 0–100. Each bar is that input's sub-score; the figure is the points it added to the 100-point composite (weight × sub-score).
- ARV discount +12.3/15.0
- Appreciation +10.0/10.0
- Cash flow +8.0/30.0
- Schools +4.1/10.0
- Livability +3.3/5.0
- Rent growth +2.5/5.0
- Condition / age +2.5/5.0
- DSCR +2.0/10.0
- 1% rule +1.9/10.0
$179,900
🖨 Deal sheet 📄 Offer letter ✓ Due diligence
Listing remarks
Adorable home on one of Abbeville's nicest streets. It's unique design will catch your eye. Walk into the front door into the family room then straight into a room that could be used as a dining room or another sitting room. From the kitchen to the right is the Primary bedroom with a full bath. From the outside door at side of house, enter into an area that leads to the laundry room and to a private second bedroom with a half bath. At the side of the house is a multi-use room that was once a porch but is enclosed with windows and could be used as a sun room, sitting area, an office or a playroom. This home is within walking distance to the historic square of Abbeville where you can just enj
Key facts
- Multi-use room
- 0.31 acre lot
- Built 1920
Tags
Property features AI
Exterior
- Utilities: Sewer connected
- Home design: Single-family detached residence; Residential property
- Construction: Vinyl siding
- Exterior features: Level lot
Interior
- Kitchen: Refrigerator
- Flooring: Hardwood
- Bathrooms: 1 full bathroom; 1 half bathroom
- Heating & cooling: Electric cooling; Natural gas heating
- Interior features: Refrigerator included; Hardwood flooring
Neighborhood map
What this means for you Summary
Snapshot
- This is a 2-bed/1.5-bath single-family listed at $180k.
Deal economics
- At list price, monthly cash flow is $-188 ($-2k/yr) — negative.
- To cash-flow at today's rent, offer at most $147k (18.4% below list).
- To meet the 1% rule (rent ≥ 1% of price), the offer needs to be $124k (30.8% below list).
- Recommended offer: $124k (30.8% below list) — sets the bar for 1% rule.
Location & tenants
- Location reads 66/100 on livability (#111 in SC) — a middle-class / working-renter tenant base. Strengths: cost of living A+, housing A+; Watch: health & safety C-, amenities F, commute F.
- Abbeville 60 (rural): math 50% / reading 49% proficiency, ranked #15 of 80 in SC (top 19%) — families likely to look elsewhere, expect single-tenant / working-renter base with shorter leases.
- Market conditions: 109 active listings in the ZIP; 1 comparable units currently listed for rent nearby; 145 units permitted in Abbeville County in 2024 (0 in 5+ unit buildings).
Forward outlook
- In year one you build about $19k of equity ($1k loan paydown + $18k appreciation (10.0% local appreciation)).
- Abbeville County population projected at -17% by 2050 — secular population decline; favor cash flow + early exit over multi-decade hold.
- By year 2, paydown + projected appreciation supports a ~$31k cash-out refi (75% LTV) — recoverable capital for the next deal without selling this one.
Negotiation context
- It's been on market 163 days — a 12% lower offer ($158k) is reasonable based on typical stale-listing flexibility.
- Current owner paid $61k; list at $180k implies a 195% gain — meaningful room to come down on a strong offer.
Risks & watch-outs
- Watch-outs: built in 1920 — expect roof / HVAC / electrical / plumbing capex.
- Climate carrying-cost: major wind risk, 27% chance of damaging wind over 30y; extreme-heat days projected 7→17/yr by 2055 (HVAC capex compounding) — expect insurance premiums to compound above CPI over the hold.
Questions for the listing agent
- What do current leases actually rent for vs. the listed asking? Can we see a recent rent roll and the last 12 months of T-12 income?
- It's been on market 163 days. Have you received any prior offers? Is the seller open to a 31% concession, seller financing, or rate buy-down credit?
- Built in 1920 — when were the roof, HVAC, electrical panel, plumbing, and water heater last replaced?
- Why hasn't it sold? Are there any deal-killer items the seller is aware of (foundation, flood, title, zoning, code violations)?
- Is there a deadline driving the sale (1031 exchange, divorce, estate, relocation)? That informs how much negotiation room exists.
- The area grade is low — what's the realistic commute time and amenity access for the typical tenant pool here? Any planned neighborhood developments (good or bad) we should know about?
- What's the average days-on-market for RENTAL listings here right now (not sales)? A rising rental-DOM trend means longer vacancies and softer asking-rent achievability than the comps imply.
- What's the recent tenant-quality profile in this submarket — average credit score on applications, eviction rate, late-payment / NSF rate, and stable-employment percentage? A property-management company in the area should have these aggregated.
- How much new for-sale + rental construction is in the pipeline within 1–3 miles? Heavy new supply typically softens prices + rents 12–24 months out; constrained supply supports both.
Investment metrics
- 1% rule
- 0.69% ✗
- Cap rate
- 5.04%
- Cash-on-cash
- -4.47%
- DSCR
- 0.80
- GRM
- 12.0
CMA / ARV
- ARV (on-the-fly)
- $201,420
- Comps found
- 8
Show comp detail 8 sales within ~0.75 mi
| Address | Dist | Beds/Ba | Sqft | Sold | Price | $/sf | Match |
|---|---|---|---|---|---|---|---|
| 107 Calhoun St | 0.25mi | 3/2.0 (+1) | 1,485 (-0%) | 1mo | $187,500 | $126 | 80 |
| 401 Marshall Ave | 0.37mi | 2/1.0 | 1,500 (+0%) | 12mo | $190,000 | $127 | 70 |
| 111 Wingfield St | 0.30mi | 3/2.0 (+1) | 1,293 (-13%) | 6mo | $180,000 | $139 | 52 |
| 502 E Greenwood St | 0.32mi | 3/2.0 (+1) | 1,412 (-5%) | 24mo | $190,000 | $135 | 49 |
| 100 Church St | 0.40mi | 3/2.5 (+1) | 1,655 (+11%) | 7mo | $190,500 | $115 | 49 |
| 301 Byrnes Ave | 0.46mi | 3/2.0 (+1) | 1,700 (+14%) | 0mo | $275,000 | $162 | 48 |
| 109 Wingfield St | 0.28mi | 3/2.0 (+1) | 1,293 (-13%) | 15mo | $198,900 | $154 | 45 |
| 105 Railroad St | 0.41mi | 3/1.0 (+1) | 1,360 (-9%) | 22mo | $57,000 | $42 | 41 |
Match score weights: distance 35% · size 25% · config 20% · recency 20%. Top-matched comps best support the ARV.
Projected returns pro-forma
10.0% appreciation · 3.0% rent growth · sell at horizon
- IRR
- 21.1%
- Equity multiple
- 2.71×
- Total profit
- $85,996
- Equity at exit
- $162,068
- IRR
- 19.1%
- Equity multiple
- 6.21×
- Total profit
- $262,597
- Equity at exit
- $349,506
Cash invested: $50,372 (down + closing). Projections, not guarantees.
Landlord ↔ Tenant lean methodology
- Overall (STATE)
- 90 Strongly Landlord-Friendly
- State South Carolina
- 90 Strongly Landlord-Friendly · R+6
- County
- — inherits STATE
- City
- — inherits STATE
ZIP-level market 29620
- Home prices YoY
- 15.0%
- Active inventory
- 109
- Price-to-rent
- 12.0×
Monthly cashflow live
- Estimated rent
- $1,245 medium interval (Pro) →
- Mortgage (P&I)
- −$943
- Tax from tax record
- −$153 /mo · $1,835/yr
- Insurance
- −$75
- HOA
- −$0
- Vacancy / Maint / Mgmt
- −$261
- Net cashflow
- $-188
Break-even live
UW: 25.0% down · 7.5% · 30yr · 1.5% tax · 5.0% vac · 8.0% maint · 8.0% mgmt
Financing live
Cash to close
- Down payment
- $44,975
- Closing costs
- $5,397
- Reserves months
- —
- Total cash needed
- —
Loan-product check · same deal, 3 products live
Conventional
25% down · 7.5% · 30yr
- Down + closing
- —
- Monthly P&I
- —
- Monthly cashflow
- —
- DSCR
- —
- Eligible?
- —
Personal DTI + credit; lowest rate.
DSCR
20% down · 8.5% · 30yr
- Down + closing
- —
- Monthly P&I
- —
- Monthly cashflow
- —
- DSCR
- —
- Eligible?
- —
No personal income docs; deal must DSCR.
Hard money
10% down · 12.0% · 12mo
- Down + closing
- —
- Monthly P&I
- —
- Monthly cashflow
- —
- DSCR
- —
- Eligible?
- —
Short-term bridge; refi at stabilization.
Rent comps 1 comps
| Address | Beds | Baths | Sqft | Rent | $/sqft | DOM | Units | Dist |
|---|---|---|---|---|---|---|---|---|
| 605 Cherokee St Abbeville, SC | 2.0 | 1.0 | 1100 | $1,245 | $1.13 | 11d | 1 | 0.90mi |
Listing history 17 events
-
2026-06-18days on market $179,900 Active 163 DOM
-
2026-06-17days on market $179,900 Active 162 DOM
-
2026-06-16days on market $179,900 Active 161 DOM
-
2026-06-15days on market $179,900 Active 160 DOM
-
2026-06-13days on market $179,900 Active 158 DOM
-
2026-06-10days on market $179,900 Active 155 DOM
-
2026-06-09days on market $179,900 Active 154 DOM
-
2026-06-08days on market $179,900 Active 153 DOM
-
2026-06-07days on market $179,900 Active 152 DOM
-
2026-06-03days on market $179,900 Active 148 DOM
-
2026-06-03days on market $179,900 Active 147 DOM
-
2026-06-01days on market $179,900 Active 146 DOM
-
2026-05-31days on market $179,900 Active 145 DOM
-
2026-05-12price $179,900
-
2026-02-19price $189,900
-
2026-01-06$199,500 Active
-
2006-04-28soldstatus $61,000
ⓘ Source: listings_history table (triggers on properties + properties_extension) + one-shot
backfill from property_details.listing_events for pre-trigger history.
Tax reassessment forecast SC · Resets to sale price
- Current annual tax
- $1,835 · $153/mo
- Projected year-2 tax
- $1,835 · $153/mo
- Expected delta
- $0/yr ($0/mo · 0.0%)
ⓘ Screening estimate from a state-policy table — verify with the county assessor before closing.
Climate risk First Street
- Flood 1/10 Low FEMA zone X (unshaded) · 0% chance over 30 yrs
- Wildfire 3/10 Moderate
- Heat 6/10 Major 7 d/yr ≥106°F today · 17 d/yr by 30 yrs out
- Wind 6/10 Major 27% chance of damaging wind over 30 yrs
- Air quality 2/10 Low 2 unhealthy d/yr today · 2 by 30 yrs out
Nearby sold comps map
Loading sold comps map…
Walkable amenities ~0.75 mi
Loading nearby amenities…
Taxation est. · year 1
- Rental income
- $14,940
- − Mortgage interest
- −$10,077
- − Property taxes
- −$1,835
- − Insurance
- −$900
- − Repairs & maintenance
- −$1,195
- − Management
- −$1,195
- − Depreciation
- −$5,233
- Taxable loss
- −$5,495
- Est. tax savings @ 24.0%
- +$1,319
- After-tax cash flow
- $-934/yr
For passive investors: Depreciation is non-cash, so a rental often shows a tax loss while cash-flowing — sheltering income. Rental losses are passive: they offset passive income freely, and up to $25,000/yr can offset ordinary (W-2) income if you actively participate and your MAGI is under $100k (phasing out to $0 by $150k); unused losses carry forward. On sale, claimed depreciation is recaptured at up to 25%, and gains may owe capital-gains tax (a 1031 exchange can defer both). Figures are a year-1 estimate at your 24.0% rate — not tax advice; consult a CPA.
Schools (NCES district)
- District
- Abbeville 60
- NCES district ID
- 4500690
- Math proficiency
- 50% ▼ -12.00%
- Reading proficiency
- 49% ▼ -7.00%
- Median HH income
- $34,522
- Composite
- 40.9/100
- National rank
- #3618
- State rank
- #15 of 80 in SC
Livability — Abbeville
- Score
- 66/100
- State rank
- #111
- US rank
- #11534
Category grades
Schools grade is shown separately in the Schools card above.
Census & demographics
- Census place
- Abbeville, SC
- Population (ZIP)
- 12,116
Population outlook (Abbeville County) Hauer SSP2
- Today (2025)
- 24,141 people
- By 2030
- 23,446 · -2.9%
- By 2040
- 21,768 · -9.8%
- By 2050
- 20,098 · -16.7%
- By 2075
- 16,518 · -31.6%
- By 2100
- 13,125 · -45.6%
Race, ethnicity, and origin ACS 2023
- Neighborhood character
- Predominantly White (65%)
- Race & ethnicity
- White 65% Black 30% Two or more races 4% Hispanic / Latino 2%
- Common ancestry
- Italian 2% Serbian 2% Slovak 2%
- Foreign-born
- 2% · Canada, Jamaica
- Languages at home
- 98% English-only · Spanish 2%
Political lean MEDSL · Abbeville
- 2024 margin
- Solid R (+42.4) · D 28.2% · R 70.6% · Other 1.2%
- 2008→2024 swing
- -27.2pp toward R · 2008: -15.2pp · 2024: -42.4pp
- All cycles
- 2024: R+42.4 2020: R+33.1 2016: R+28.3 2012: R+13.4 2008: R+15.2
Not yet ingested
- Civics
- —
Market trends
- HPI YoY
- ▲ 49.52%
- Current HPI
- 379.552
- Rent YoY
- —
- Metro
- —
- State GDP YoY
- ▲ 4.51%
- F500 in state
- 2
Industry mix (Fortune 500 HQ in SC)
| Industry | F500 HQs | Revenue |
|---|---|---|
| Packaging | 1 | $7B |
|
||
Price history
+194.9% since first listed4 events — show timeline
- 2026-05-12 Price Changed $179,900 GAOR
- 2026-02-19 Price Changed $189,900 GAOR
- 2026-01-06 Listed $199,500 GAOR
- 2006-04-28 Sold (Public Records) $61,000 Public Records
Property tax history
+5.6%/yrLatest (2025): $1,835 · +6.1% YoY. Source: county tax records.
Cash-flow waterfall
monthlySold comps — $/sqft
last 12 mo · ≤1 miLoading sold comps…